
Abstract
Canine bone marrow is frequently assessed in the advanced preclinical research environment. Automated analysis provides time savings and objectivity over the gold standard of microscopic (cytologic) evaluation. We compared the analysis of 90 canine bone marrow samples by the Sysmex XT-2000iV hematology analyzer (Sysmex Corp., Kobe, Japan) with cytologic evaluation. Gates for cell populations were created in the system’s WBC/BASO channel. Variables “total nucleated red blood cells” (total_NRBC), “poly- and orthochromatic nucleated red blood cells” (poly_orth_NRBC), “total neutrophils” (total_NEUT), “mature neutrophils” (mature_NEUT), and myeloid-to-erythroid (M:E) ratio were compared with cytologic evaluation. Intra-assay repeatability and total error (TE) were calculated for both methods. Intra-assay repeatability was 0.95–2.48% for the XT-2000iV and 8.32–23.23% for cytology. Observed TE for the automated measurement was 5.16–46.8% and for cytology 22.70–76.74%. Spearman rank correlation was excellent for M:E ratio (0.91) and fair for the other populations (0.65–0.71). Absolute bias for M:E ratio was low (−0.114). A negative absolute bias of −7.71% for the XT-2000iV was found for poly_orth_NRBC, whereas the bias was positive for total_NEUT (7.10%) and mature_NEUT (14.67%). M:E ratio of canine bone marrow samples can be precisely determined using the Sysmex XT-2000iV WBC/BASO channel. Total_NRBC, poly_orth_NRBC, total_NEUT, and mature_NEUT can be estimated rapidly. With distinctly lower coefficient of variation and observed TE compared with cytology, automated measurement provides advantages in terms of standardization, and it is suited to the advanced preclinical research environment where large numbers of samples are investigated.
Introduction
Bone marrow examination is part of the evaluation of the hematopoietic system and is used to determine the potential hematotoxicity of new compounds on hematopoietic cells in the advanced pharmaceutical and toxicologic research environment.3,4,13 Cytologic examination of bone marrow may be considered when characterization of the hematopoietic system is inadequate using the standard assays (e.g., histopathology or peripheral blood examination). 14 Cytologic evaluation of bone marrow smears may be used to differentiate early hematopoietic precursors and determine potentially affected cell lines. 14 Furthermore, incompletely characterized increases or decreases in bone marrow cellularity in relation to peripheral blood cell counts may be investigated. 14 Moreover, cytologic evaluation may be indicated if atypical or abnormal cells can be detected in circulation or if there are abnormalities in erythrocyte indices (mean corpuscular volume; mean corpuscular hemoglobin concentration). 14
Microscopic evaluation of bone marrow smears is time-consuming, and results depend on the experience of the microscopist and the quality of the specimen. Therefore, a standardized automated measurement of bone marrow samples can be useful to increase consistency and to save time.
Flow cytometry was used previously to analyze bone marrow of rats.1,2 However, this method requires antibody-staining before measurement and manual gating of each sample after measurement, and is thus expensive and time-consuming.
The Sysmex XT-2000iV a (hereinafter XT-2000iV analyzer) is a modern automated hematology analyzer widely used for the analysis of veterinary peripheral blood samples. The analyzer provides leukocyte count and differentiation performed in 2 channels, the so-called WBC/BASO and DIFF channels.
Predefined analysis profiles may be used to measure peripheral blood samples from dogs, cats, horses, cattle, pigs, rats, mice, rabbits, guinea pigs, and monkeys. Additionally, the open architecture of the analyzer software allows user-defined gating and creation of new profiles for further mammalian species as well as specimens other than blood. User-defined profiles can be saved and used to analyze further samples of the same type. Moreover, previously measured and stored samples can be reanalyzed using the new profile. This software function has been used for the measurement of rat and mouse bronchoalveolar lavage fluids, canine and feline effusions, canine reticulated platelets, and canine neoplastic cells.5,8,10,12 In 2014, the XT-2000iV was validated for the analysis of rat bone marrow using the DIFF channel.3,4
However, canine bone marrow has yet to be evaluated. Thus, we compared canine bone marrow samples analyzed by the XT-2000iV WBC/BASO channel with standard microscopic evaluation. Additionally, we assessed repeatability and total error of the automated measurement and cytology.
Materials and methods
Animals and bone marrow sampling
Bone marrow samples from 45 male and 45 female Beagle dogs, taken at autopsy, were included in our study. The dogs, 14–30 mo of age, were used in the course of preclinical studies. The studies were conducted in accordance with the German Animal Welfare Act (Article 8), and the competent authority was informed accordingly (ethics committee numbers: DA 4/Anzeige 330, Methode 3b; DA 4/Anzeige 330, Methode 3a; DA/Anzeige 330, Methode 2). The dogs were assigned to 4 groups. Animals included in groups 2–4 were treated with different test compounds at a low-, medium-, or high-dose regime, whereas dogs of group 1 were used as control animals.
The animals were routinely checked for their health status by clinical examination, hematology, and clinical chemistry. They had been vaccinated at the breeder’s facility against leptospirosis and bordetellosis, as well as against various viruses (Canine distemper virus, canine parvovirus 2, Rabies virus, papillomavirus, adenovirus, and parainfluenza virus) before they arrived in the facilities where the preclinical studies had been performed. Furthermore, the dogs were treated with anthelmintics prior to treatment with test compounds.
Bone marrow was sampled from sternebrae during autopsy. Sternebrae were isolated immediately after death, then bisected and squeezed, and the bone marrow was collected with a brush. Approximately 1 mL of bone marrow was added to a tube containing 1 mL of flow buffer, b 0.1 mL of fetal calf serum, c and 0.5% sodium EDTA, d and was mixed thoroughly. Smears were prepared by push smear technique, air dried, and stained with May-Grünwald/Giemsa technique.
Measurement of bone marrow samples with the Sysmex XT-2000iV
Bone marrow was analyzed ~1 h after sampling with a XT-2000iV hematology analyzer a (software version 00–10). Samples were thoroughly inverted and measured undiluted and after dilution (50, 100, and 150 times with flow buffer b ). Each dilution was measured, and, for each animal, the dilution that contained ~10,000–20,000 cells/µL was used for further analysis in the WBC/BASO channel.
WBC counts are performed with the WBC/BASO channel in which erythrocytes are lysed and the cytoplasm of WBCs is removed by using an acid reagent. e Cells are sorted according to their side scatter (SSC; i.e., complexity) and forward scatter (FSC; i.e., size) characteristics. Basophilic cells resist shrinking and may thus be separated from other leukocytes. Moreover, differential WBC counts are performed in the DIFF channel using fluorescence flow cytometry after permeabilization with a surfactant e and staining the nucleic acid with a fluorescent polymethinedye. f
Cell populations in canine bone marrow obtained with the WBC/BASO channel could be clearly separated and showed consistent positions throughout all samples. Gates were set according to SSC/FSC characteristics around the cell population containing all granulocytes (total_NEUT) and the subpopulation mature neutrophils (mature_NEUT). Furthermore, all nucleated red blood cells (total_NRBC) and a subpopulation of polychromatic and orthochromatic nucleated red blood cells (poly_orth_NRBC) were gated (Fig. 1).
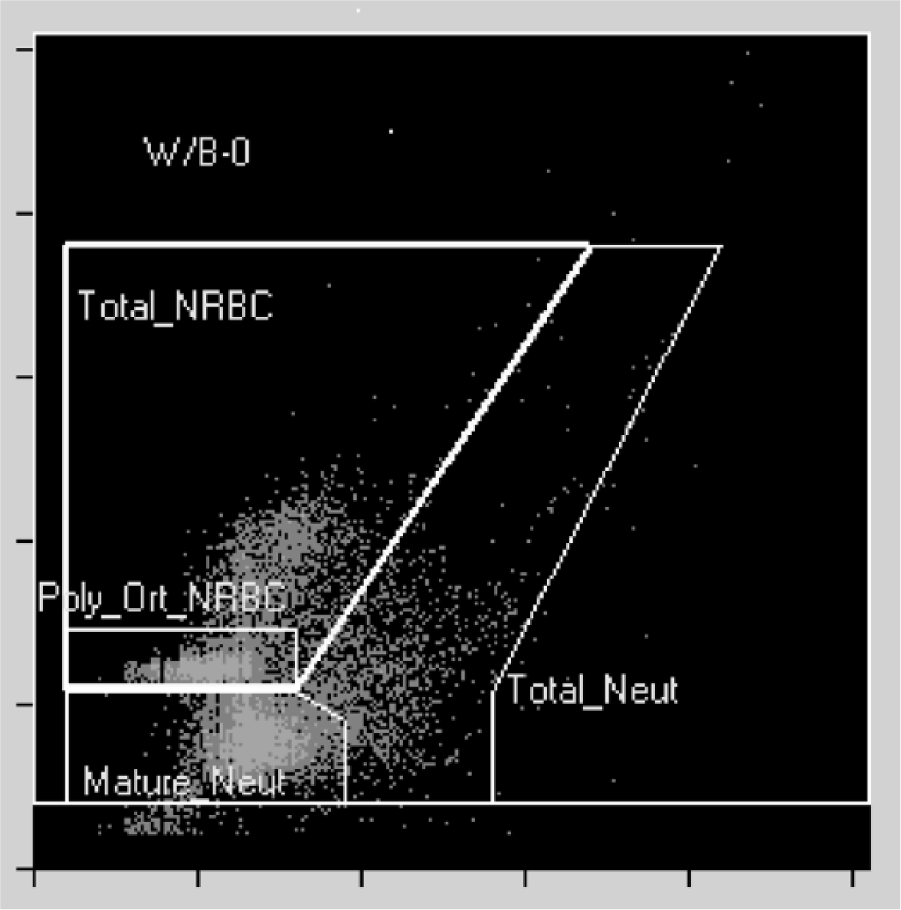
Dot plot for canine bone marrow from the WBC/BASO channel of the Sysmex XT 2000iV analyzer. a Abbreviations: man = manual; Neut = neutrophils; NRBC = nucleated red blood cell; orth = orthochromatic; poly = polychromatic; W/B-O = WBC-BASO channel; x-axis, side scatter; y-axis, forward scatter.
The new profile was filed and used to analyze further samples. The cell populations total_NEUT and total_NRBC were used to calculate the myeloid-to-erythroid (M:E) ratio. It was not possible to create a template for the DIFF channel as cell populations could not be separated clearly and gates did not fit for all samples.
Microscopic evaluation of bone marrow samples
A 500-cell differential was performed for each animal by a trained operator using a microscope with a 100× objective. g Populations of rubriblasts, prorubricytes, basophilic and polychromatophilic rubricytes, as well as metarubricytes were classified for the erythroid cell line. For the granulocytic cell line, eosinophilic and basophilic cells, as well as neutrophilic myeloblasts, promyelocytes, myelocytes and metamyelocytes, bands, and segmented neutrophils were classified. Comparable to cell populations obtained by automated measurement, polychromatophilic rubricytes and metarubricytes were summarized and band and segmented neutrophils, respectively. Moreover, the sum of all nucleated red blood cells as well as the sum of all neutrophils and their precursor cells was calculated. The M:E ratio was calculated for each sample.
Intra-assay repeatability and observed total error
To assess intra-assay repeatability for variables obtained with the XT-2000iV analyzer, 5 dog bone marrow samples were pooled and measured in 25 replicates. Furthermore, intra-assay repeatability was assessed for the same variables obtained by microscopic evaluation (total_NEUT, total_NRBC, poly_orth_NRBC, mature_NEUT, and M:E). For this purpose, 1 bone marrow slide was differentiated 10 times (500 cells each). Moreover, absolute bias and bias (%) as well as observed total error (TEobs) of both methods were calculated.
Statistical analysis
Data were analyzed with commercial statistical software. h Data obtained by standard microscopic cytologic examination and by automatic analysis were compared by Spearman rank correlation, Passing–Bablok regression, and Bland–Altman analysis. Bland–Altman diagrams show the mean bias (±1.96 standard deviation), defined as the difference between mean results obtained with the reference method (i.e., microscopic evaluation) and the automated analysis. Total_NRBC (XT) values were compared with the sum of the percentage of all nucleated erythroid cells counted in standard cytologic examination. Total_NEUT (XT) values were compared with all neutrophilic granulocytes (microscope), poly_orth_NRBC (XT) with polychromatophilic rubricytes and metarubricytes (microscope), and mature_NEUT (XT) with neutrophilic bands and segmented neutrophils (microscope), respectively. Furthermore, the M:E ratio obtained with both methods was compared.
Correlation was assessed as follows 11 : rs = 0.93–0.99 = excellent; rs = 0.80–0.92 = good; rs = 0.59–0.79 = fair; rs < 0.59 = poor. For intra-assay repeatability, coefficients of variation (CVs) were calculated as standard deviation/mean × 100%. The observed total error was calculated as follows: TEobs= bias (%) + 2 × CV (%), where bias (%) was obtained using the commercial software. h
Results
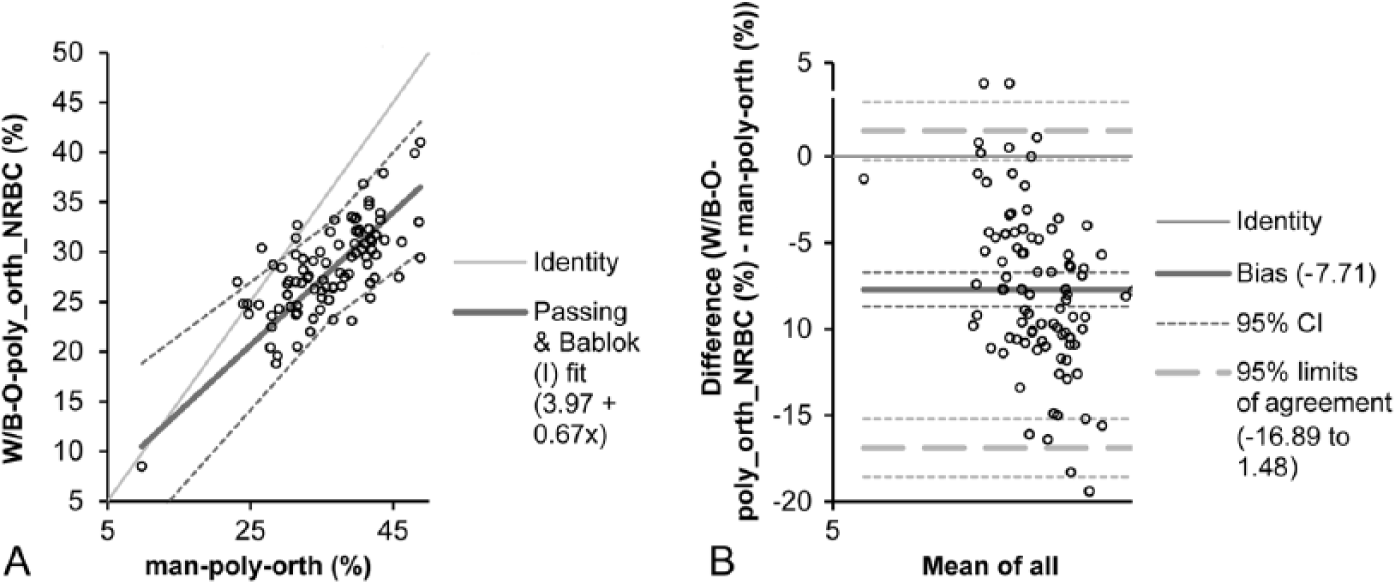
Scattergrams, as created at the beginning with a few samples, looked identical for all samples (Fig. 1). Bone marrow samples analyzed in our study did not show any abnormalities in cell lines with respect to quantity or morphology. Spearman rank correlation coefficients (rs) were calculated for data obtained with the XT-2000iV analyzer and by microscopic evaluation and ranged between 0.65 and 0.91 (Table 1; Figs. 2, 3; Supplemental Figs. 1–3). With Bland–Altman analysis, absolute bias for M:E ratio was close to zero (Table 1; Fig. 2). A negative systemic absolute bias for poly_orth_NRBC and a positive systemic bias for total_NEUT and mature_NEUT was found (Table 1; Fig. 3; Supplemental Figs. 2, 3). Slope was close to 1 for total_NRBC, total_NEUT, and for mature_NEUT 1.24 (Table 1; Supplemental Figs. 1–3), respectively.
Method comparison of XT-2000iV analyzer and cytologic analysis for bone marrow variables; rs from Spearman rank correlation coefficient; intercept and slope from Passing–Bablok regression; and absolute bias and bias (%) from Bland–Altman analysis (n = 90).*
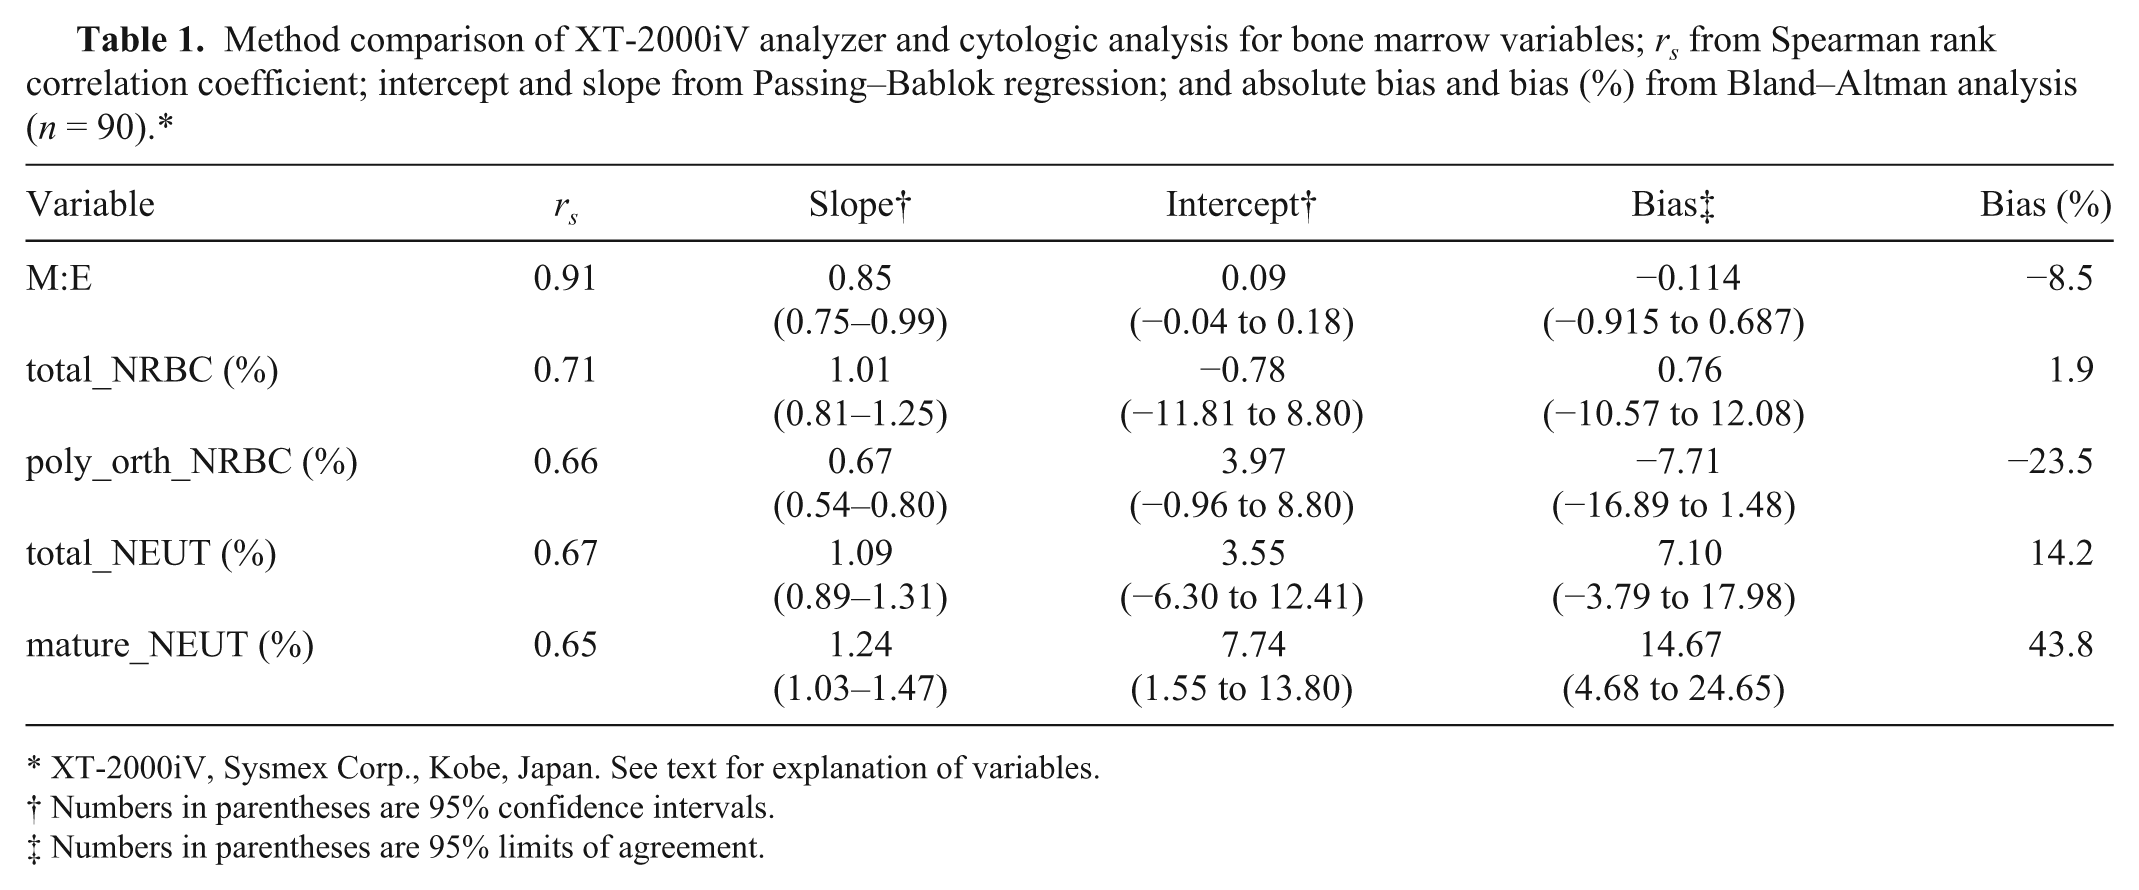
XT-2000iV, Sysmex Corp., Kobe, Japan. See text for explanation of variables.
Numbers in parentheses are 95% confidence intervals.
Numbers in parentheses are 95% limits of agreement.
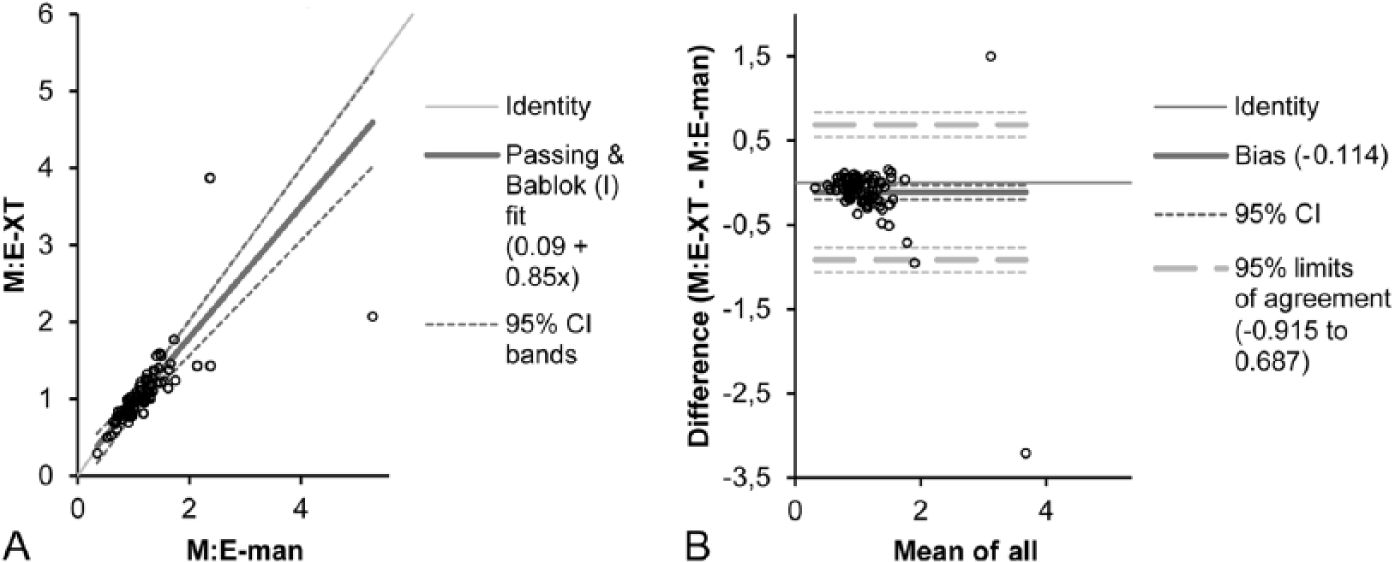
Passing–Bablok regression curve (
Spearman rank correlation coefficient for M:E ratio was 0.91; results obtained for all other variables analyzed (i.e., all nucleated red blood cells, poly- and orthochromatic red blood cells, all neutrophils and mature neutrophils) were lower (i.e., 0.65–0.71).
Using the XT-2000iV analyzer, intra-assay CV was 0.95–2.48% and TEobs was 5.16–46.80, whereby high TEs were based on a high bias between both methods (Tables 1, 2). Intra-assay CVs for the microscopic differentiation was 8.35–23.23% and TEobs was 22.70–76.74% (Table 3). High TEobs for total_NRBC, total_NEUT, and mature_NEUT were based on both a high CV and a high bias, whereas in the case of M:E ratio and poly_orth_NRBC, the high CV of the microscopic examination only was responsible for the high TEobs (Table 3).
Twenty-five-run intra-assay repeatability and observed total error (TEobs) for the XT-2000iV analyzer variables using a pooled specimen.*
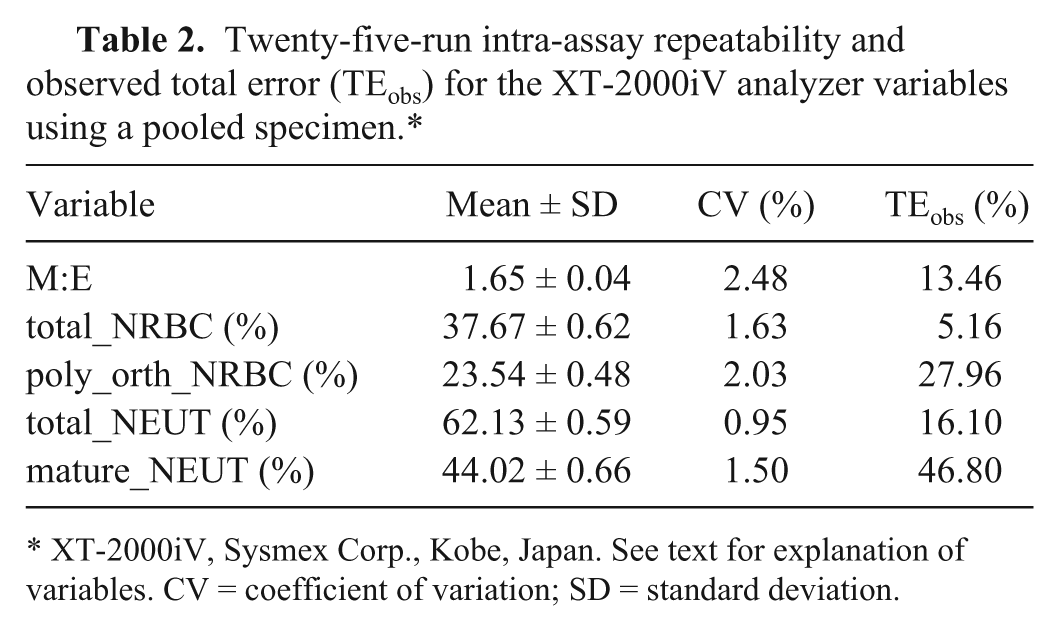
XT-2000iV, Sysmex Corp., Kobe, Japan. See text for explanation of variables. CV = coefficient of variation; SD = standard deviation.
Ten-run intra-assay repeatability and observed total error (TEobs) for microscopic examination using one bone marrow slide.*
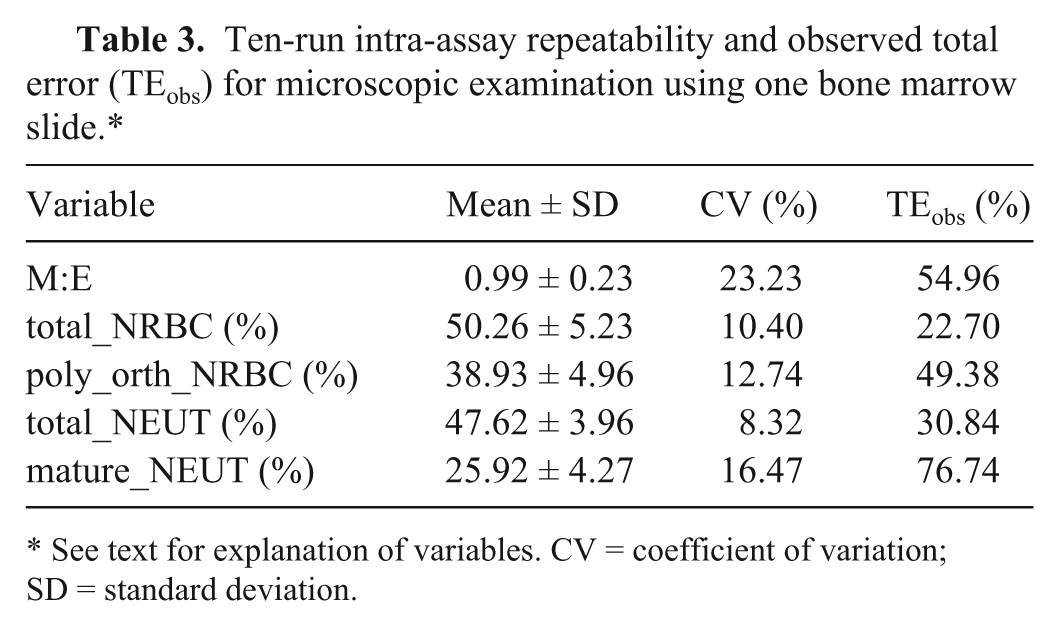
See text for explanation of variables. CV = coefficient of variation; SD = standard deviation.
Discussion
The XT2000iV analyzer WBC/BASO can be used to analyze bone marrow samples of dogs. In particular, the M:E ratio can be precisely and accurately determined, and further cell populations can be well estimated. To our knowledge, the measurement of canine bone marrow using this channel of the hematology analyzer has not been reported previously.
The XT-2000iV analyzer has been used to analyze materials other than blood samples, including bronchoalveolar lavage fluids and canine and feline effusions.8,12 Furthermore, rat bone marrow samples were analyzed using the system’s so-called DIFF channel, which is in contrast to our study where the WBC/BASO channel was used.3,4 In the DIFF channel, the x-axis represents the side scatter of light (i.e., the cells’ complexity), whereas the y-axis represents RNA and DNA fluorescence. Based on magnetic bead–mediated purified cell populations, gates were adjusted in the cytogram to distinct rat bone marrow cell lines.3,4
In the DIFF channel, immature myeloid cells were located high on the y-axis and on the right of the x-axis, and mature myeloid cells were located on the right of the x-axis but near the basis of the y-axis.3,4 Proliferating erythroid cells were found to reside left from the proliferating myeloid cells and high on the y-axis, whereas maturing erythroid cells were located beneath the immature erythroid cells, thus near the x-axis. 3
As in the DIFF channel, the x-axis of the WBC/BASO channel represents SSC, whereas the y-axis represents FSC. Immature cells are larger and contain more RNA/DNA. Therefore, they locate in both channels higher on the y-axis compared with maturing cell populations.
DIFF and WBC/BASO channels are not completely comparable and, in addition, differences in rat and dog bone marrow cell populations must be considered. However, comparing the scattergrams in our study with those published for rats, similarities can be observed. 3 In the WBC/BASO channel, mature canine neutrophils are located in the middle of the x-axis and on the bottom of the y-axis, representing small cells with relatively few granules. Maturing canine erythroid cells are located slightly higher on the y-axis in the WBC/BASO channel, which can also be observed for rat erythroid cells in the DIFF channel. 3 Larger immature erythroid cells are consequently located higher on the y-axis in both channels. Immature myeloid cells, which have many granules in their cytoplasm, reside on the right of the x-axis and, depending on their size, high up on the y-axis in the WBC/BASO channel as well as in the DIFF channel.
For the M:E ratio, limits of agreement obtained by Bland–Altman analysis for rats (−0.34 to 0.26 and −0.35 to 0.27 for males and females, respectively) and dogs (−0.915 to 0.687) were comparable. 3 Values for proliferating and maturing myeloid and erythroid cells were lower for rats compared to dogs:−2.36–5.4% (lower limit of agreement) and 1.48–6.03% (upper limit of agreement). 3
The CVs for the variables obtained with the XT-2000iV analyzer WBC/BASO channel were <3% for all cell lines. This can be judged as an excellent result and is comparable to precision determined previously for the DIFF channel. 3 CVs for cell lines counted microscopically were considerably higher (8.32–23.23%).
A manual differential normally contains at least 200–500, sometimes 1,000 cells, whereas thousands of cells are measured by the automatic analyzer.7,9,13,14 The CV depends on the number of cells counted and is usually lower with increasing numbers of cells. Moreover, CV is usually higher for cell types that are present less frequently in samples. 15 Therefore, the automated measurement provides advantages with regard to repeatability compared with cytologic examination.
Because the TEobs depends on the CV of a method, it is consequently higher for the cytologic analysis than for the automated measurement. Random errors are thus higher for variables obtained by cytology, as well. To our knowledge, even for people, quality requirements such as total allowable errors (TEas) do not exist for manual or automated analysis of bone marrows. Further studies must be performed to define such quality requirements for automated and microscopic analysis of bone marrow. Our results give an insight into quality that can be acquired in practice. However, apart from the total_NRBC and M:E ratio, there was a relatively high bias between both methods. Moreover, it must be noted that bone marrow without any morphologic abnormalities of cells was evaluated, as the preclinical studies in which dogs were investigated did not focus on compounds influencing the hematopoietic system. Therefore, bone marrow samples analyzed in our study did not show any abnormalities in cell lines with respect to quantity or morphology.
Ideally, samples included in method comparison studies should cover the complete working range of both methods and should represent the whole spectrum of abnormal samples. 6 Comparability of cytologic examination and XT-2000iV WBC/BASO channel should be further investigated using abnormal canine bone marrow samples.
Regarding the methodology of our study, the XT-2000iV analyzes a predefined sample volume instead of a predefined number of cells. Thus, cell-rich samples like bone marrow may contain too many cells, resulting in a very dense scattergram. Therefore, in our study, bone marrow samples were diluted stepwise, and those dilutions with a cell count of ~10,000–20,000 cells/µL were used for further analysis. In the rat study, bone marrow processing included centrifuge preparations and dilution to a volume of 10 mL. 3
Footnotes
Acknowledgements
We thank Sysmex Europe GmbH, Norderstedt, Germany, for kindly providing the Sysmex XT-2000iV hematology analyzer.
Authors’ contributions
I Pernecker contributed to acquisition, analysis, and interpretation of data, and drafted the manuscript. NB Bauer, S Johannes, and M Ginder contributed to analysis and interpretation of data, and critically revised the manuscript. JH Harleman and A Moritz contributed to interpretation of data and critically revised the manuscript. All authors contributed to conception and design of the study; gave final approval; and agreed to be accountable for all aspects of the work in ensuring that questions related to the accuracy or integrity of any part of the work are appropriately investigated and resolved.
a.
Sysmex, Kobe, Japan.
b.
CellWash, BD, Heidelberg, Germany.
c.
Fetal calf serum, Biochrom, Berlin, Germany.
d.
EDTA, AppliChem, Darmstadt, Germany.
e.
Stromatolyser-4DL, Sysmex, Kobe, Japan.
f.
Stromatolyser-4DS, Sysmex, Kobe, Japan.
g.
Axioskop, Carl Zeiss Microscopy, Jena, Germany.
h.
Analyse-it method validation edition, Analyse-it Software, Leeds, UK.
Declaration of conflicting interests
The author(s) declared no potential conflicts of interest with respect to the research, authorship, and/or publication of this article.
Funding
The author(s) disclosed receipt of the following financial support for the research, authorship, and/or publication of this article: The Sysmex XT-2000iV hematology analyzer was provided as a loan by the Sysmex Company.
References
Supplementary Material
Please find the following supplemental material available below.
For Open Access articles published under a Creative Commons License, all supplemental material carries the same license as the article it is associated with.
For non-Open Access articles published, all supplemental material carries a non-exclusive license, and permission requests for re-use of supplemental material or any part of supplemental material shall be sent directly to the copyright owner as specified in the copyright notice associated with the article.