
Abstract
Inflammatory bowel disease (IBD) and alimentary lymphoma (ALA) are common gastrointestinal diseases in cats. The very similar clinical signs and histopathologic features of these diseases make the distinction between them diagnostically challenging. We tested the use of supervised machine-learning algorithms to differentiate between the 2 diseases using data generated from noninvasive diagnostic tests. Three prediction models were developed using 3 machine-learning algorithms: naive Bayes, decision trees, and artificial neural networks. The models were trained and tested on data from complete blood count (CBC) and serum chemistry (SC) results for the following 3 groups of client-owned cats: normal, inflammatory bowel disease (IBD), or alimentary lymphoma (ALA). Naive Bayes and artificial neural networks achieved higher classification accuracy (sensitivities of 70.8% and 69.2%, respectively) than the decision tree algorithm (63%, p < 0.0001). The areas under the receiver-operating characteristic curve for classifying cases into the 3 categories was 83% by naive Bayes, 79% by decision tree, and 82% by artificial neural networks. Prediction models using machine learning provided a method for distinguishing between ALA–IBD, ALA–normal, and IBD–normal. The naive Bayes and artificial neural networks classifiers used 10 and 4 of the CBC and SC variables, respectively, to outperform the C4.5 decision tree, which used 5 CBC and SC variables in classifying cats into the 3 classes. These models can provide another noninvasive diagnostic tool to assist clinicians with differentiating between IBD and ALA, and between diseased and nondiseased cats.
Introduction
Inflammatory bowel disease (IBD) and alimentary lymphoma (ALA) are common gastrointestinal (GI) disorders in cats.17,19,25,27,36 The clinical signs of the 2 disorders are very similar, with the most common clinical signs being anorexia, weight loss, vomiting, and/or diarrhea.7,19,27,36 The chance of developing intestinal lymphoma is increased with a previous diagnosis of IBD, as previously seen in humans, dogs, and cats.17,24,34 To date, the diagnosis of IBD and ALA relies on the histopathologic examination of tissue biopsy specimens taken from the small intestine.14,33,35
Histologically, IBD in most cats is characterized by the accumulation of lymphocytes and plasma cells, and less often neutrophils, eosinophils, or macrophages, in the lamina propria of the stomach and small intestine.17,36 Similarly, ALA can be associated with the infiltration of lymphoid cells into these same anatomic locations. However, unlike IBD, the infiltrating lymphoid cells in ALA are not limited to the lamina propria of the mucosa but can also involve and efface the epithelial lining, submucosa, tunica muscularis, and serosa.7,19,27
Histologic evaluation of endoscopic and full-thickness biopsy samples has been the gold standard for diagnosing IBD and ALA in cats. However, in some cases, it can be challenging for pathologists to differentiate between small-cell lymphoma and lymphoplasmacytic enteritis and/or gastritis, particularly with endoscopic samples.10,26,33,38 This is a result of the similar, relevant clinical signs and the overlapping histologic features between the 2 diseases, especially when neoplastic cells do not extend beyond the mucosa. 37 To some extent, this challenge can be overcome by collecting a full-thickness intestinal wall tissue sample. However, this approach requires a more invasive procedure in which the animal is exposed to a higher morbidity risk because of surgical complications and is associated with higher financial cost for the owner.20,37
For GI diseases, and specifically IBD and ALA, previous studies11,28,29 have shown some common hematology and biochemistry abnormalities. Hypoalbuminemia, the most common serum biochemical abnormality in cats with lymphoma,24,32 is thought to be a result of the disruption of the intestinal wall integrity. Therefore, albumin is one possible analyte that can help discriminate between IBD and ALA. We speculate that there are more complex data patterns involving blood hematology and blood serum chemistry results that can be used to differentiate between these 2 disorders.
Data mining is the process of using computational techniques to convert raw data into useful information for knowledge discovery. The main goal is to identify patterns and detect hidden pieces of information. System models that employ classification algorithms are one of the most common tools in data mining. Each of these models takes a set of instances as an input, in which every instance belongs to a particular class. The model then outputs a classifier schema that can predict the class of a new instance, given its attributes’ values with a particular accuracy, in a process called machine learning.21,41
Naive Bayes, decision trees, and artificial neural networks are examples of common machine-learning algorithms that can exploit underlying complex patterns in large datasets to classify cases into related groups. Naive Bayes, decision trees, and artificial neural networks have been applied in many areas of medicine1,39,40 to distinguish between different disorders and have shown good classification accuracy. Such tools are initially trained using case controlled data representing the disorders of interest; the tools discover the underlying unique pattern for each disorder. After training, the tools use the experiential knowledge to classify new cases into the appropriate disorder category.
Naive Bayes classifier is one of the best known simple classifiers. 39 It is derived from Bayes’s theorem, but unlike the Bayesian classifier, the naive Bayes allows for a computationally inexpensive learning technique while keeping an accurate classification under the assumption that the random variables (attributes) are conditionally independent from each other.
Decision trees have proven to be an effective method for classification.39,41 Such trees are among the few classifiers that have incorporated visualization and user interaction for an easier classification at the point of practice. Decision trees do not require any assumption of independence between features (laboratory variables). Every decision tree is composed of nodes; the first tree node is called the root node, and children nodes are referred to as internal nodes. Each of these internal nodes carries a particular test used to classify instances (e.g., “Is the albumin level high?”). The nodes at the end of the tree are termed leaf nodes, and they are used to identify the instances class, which will be the target (diagnosis). 41
Artificial neural networks are computational models that mimic the structure and the function of biological neural networks. In this approach, knowledge is acquired through a learning process called back propagation and stored within the interconnection strength between nodes (neurons). An artificial neural networks algorithm using a multilayer perceptron is a well-known classification algorithm that has been shown1,3,12,13 to perform very well in many areas, including medicine. Moreover, a previous review of artificial intelligence applications to manage urological cancer 2 found that an artificial neural network consisting of a multilayer perceptron (comprising 3 neural layers) was the most successful model for improving diagnosis.
The objective of our study was to model the influence of IBD and ALA on different complete blood cell count (CBC) and serum chemistry (SC) variables and to help distinguish between the 2 diseases using naive Bayes, decision trees, and artificial neural networks classification algorithms.
Materials and methods
Our retrospective study examined 3 groups of 40 (120 total) client-owned cats presented to the Virginia Tech Veterinary Teaching Hospital (VTH; Blacksburg, Virginia) from 2008 to 2016. The groups were identified as normal, IBD, and ALA. The normal cats were a subset of clinically normal animals that had been used to establish reference interval CBC a and SC b results at the Virginia Tech Animal Laboratory Services (ViTALS), Clinical Pathology Service. The IBD and ALA cats were animals presented to the VTH with chronic GI disease and had undergone an upper GI endoscopic biopsy procedure. Duodenal endoscopic biopsy results were used to sort these animals into the IBD or ALA group if they met the following inclusion criteria. Only cats with lymphocytic or plasma cellular inflammation of moderate or marked severity were included in the IBD group. None of these cats had lymphoma identified in any other biopsy sites. Based on the 2008 World Health Organization classification standards for lymphomas, 15 histopathologically, the ALA group of cats had either a small- or large-cell lymphoma diagnosis at the duodenal site and may have had a similar or other diagnosis at another sample site. The original attending pathologist’s diagnosis was used to classify these cats into their appropriate group. The duodenal biopsy samples were randomized and reviewed by a single board-certified pathologist (KL Zimmerman) who was blinded to the final diagnosis. The samples were scored by the pathologist following the GI endoscopic biopsy reporting guidelines of the World Small Animal Veterinary Association GI International Standardization Group. 8
Twelve CBC and 19 SC independent variables (31 total, all quantitative variables) were evaluated in all 120 cats. The CBC variables were hematocrit, hemoglobin, platelet count, red blood cell count, white blood cell count, mean corpuscular volume, mean corpuscular hemoglobin, mean corpuscular hemoglobin concentration, neutrophils, lymphocytes, monocytes, and eosinophils. The SC variables were albumin, alkaline phosphatase, alanine aminotransferase, calcium, cholesterol, chloride, CO2, creatinine, glucose, phosphorus, potassium, total protein, sodium, urea nitrogen, anion gap, total bilirubin, direct bilirubin, indirect bilirubin, and globulin.
It was insured that the analytical method and instrumentation used for each analyte (CBC and SC) was the same for all 3 cohorts. All sampling was the same across groups as well; CBCs were done in ethylenediaminetetra-acetic acid, and SCs were drawn in heparin. Distribution normality of the CBC and SC variables was assessed across different groups by Shapiro–Wilk c test. The nonparametric Kruskal–Wallis c test, without any distributional assumptions, was used for group comparison. The analysis was followed by a nonparametric comparison for each diagnosis pair using Wilcoxon. c Results were considered statistically significant at a 2-tailed value of p < 0.05.
Data mining
Three classification algorithms were examined using the data mining software WEKA. d This open source software provides tools for data preprocessing, classification, regression, clustering, and visualization. Naive Bayes, J48, and multiple perceptron are 3 classification algorithms in WEKA that implement the naive Bayes, C4.5 decision tree, and artificial neural networks algorithms, respectively.
Attribute selection
A subset of data attributes (CBC and SC variables) was selected for use with each of the classifier algorithms. The aim of the attribute selection was to remove variables with minimal diagnostic weight from the models to minimize any confusion that could be introduced by them, simplify the generated models, minimize the overfitting of the classifiers to our dataset (make the classification models less specific so they perform well in new examples), and save classification cost with regard to time and computation load. 4 Before the creation of classification models, the list of CBC and SC variables was pre-processed and filtered using WEKA BestFirst searching method (to create different attribute subsets) and WEKA Wrapper evaluator (to evaluate the performance of every subset). In Wrapper, 3 subsets of the CBC and SC variables were selected using the 3 previously mentioned classification algorithms as part of the subsets performance evaluation method.
The parameter settings used in WEKA for attribute selection using Wrapper are shown in Table 1. All other parameter settings in the study were left at their default values unless declared otherwise.
The parameter settings of Wrapper attribute selection evaluators in Waikato Environment for Knowledge Analysis (WEKA). d Three data subsets were created using the same settings but with different classifiers in evaluation.
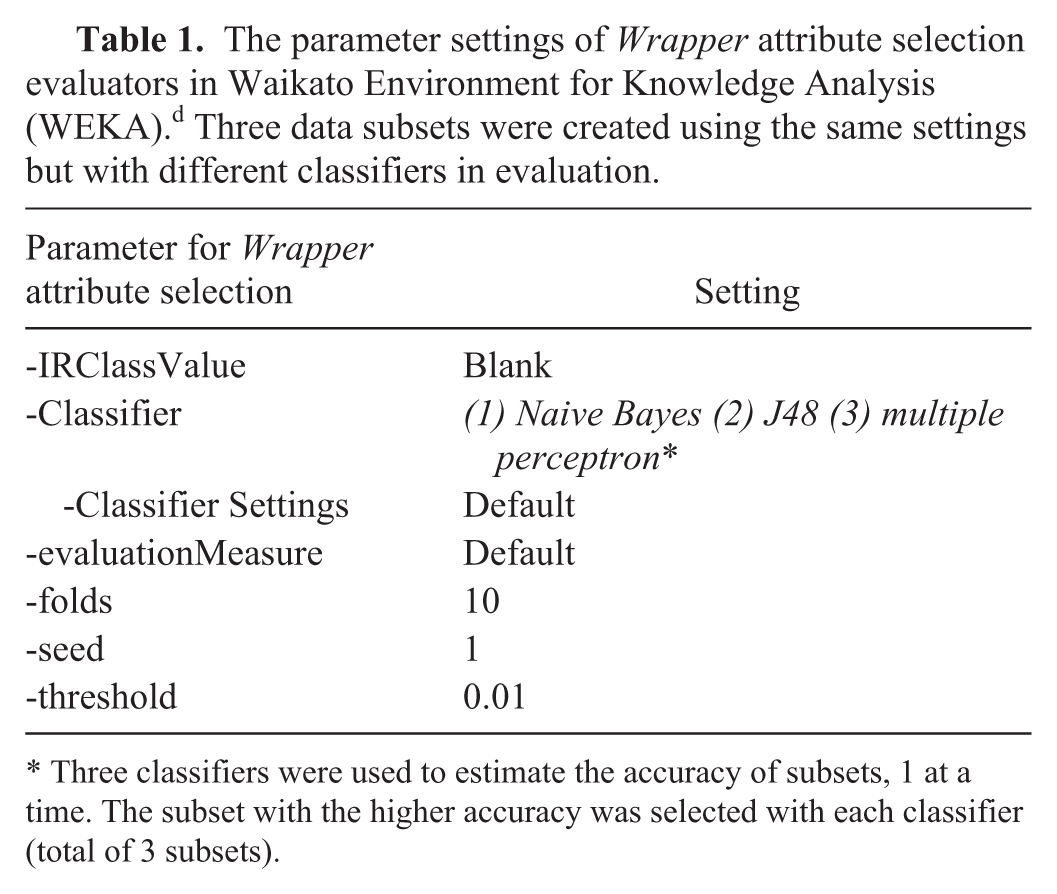
Three classifiers were used to estimate the accuracy of subsets, 1 at a time. The subset with the higher accuracy was selected with each classifier (total of 3 subsets).
Classification algorithms
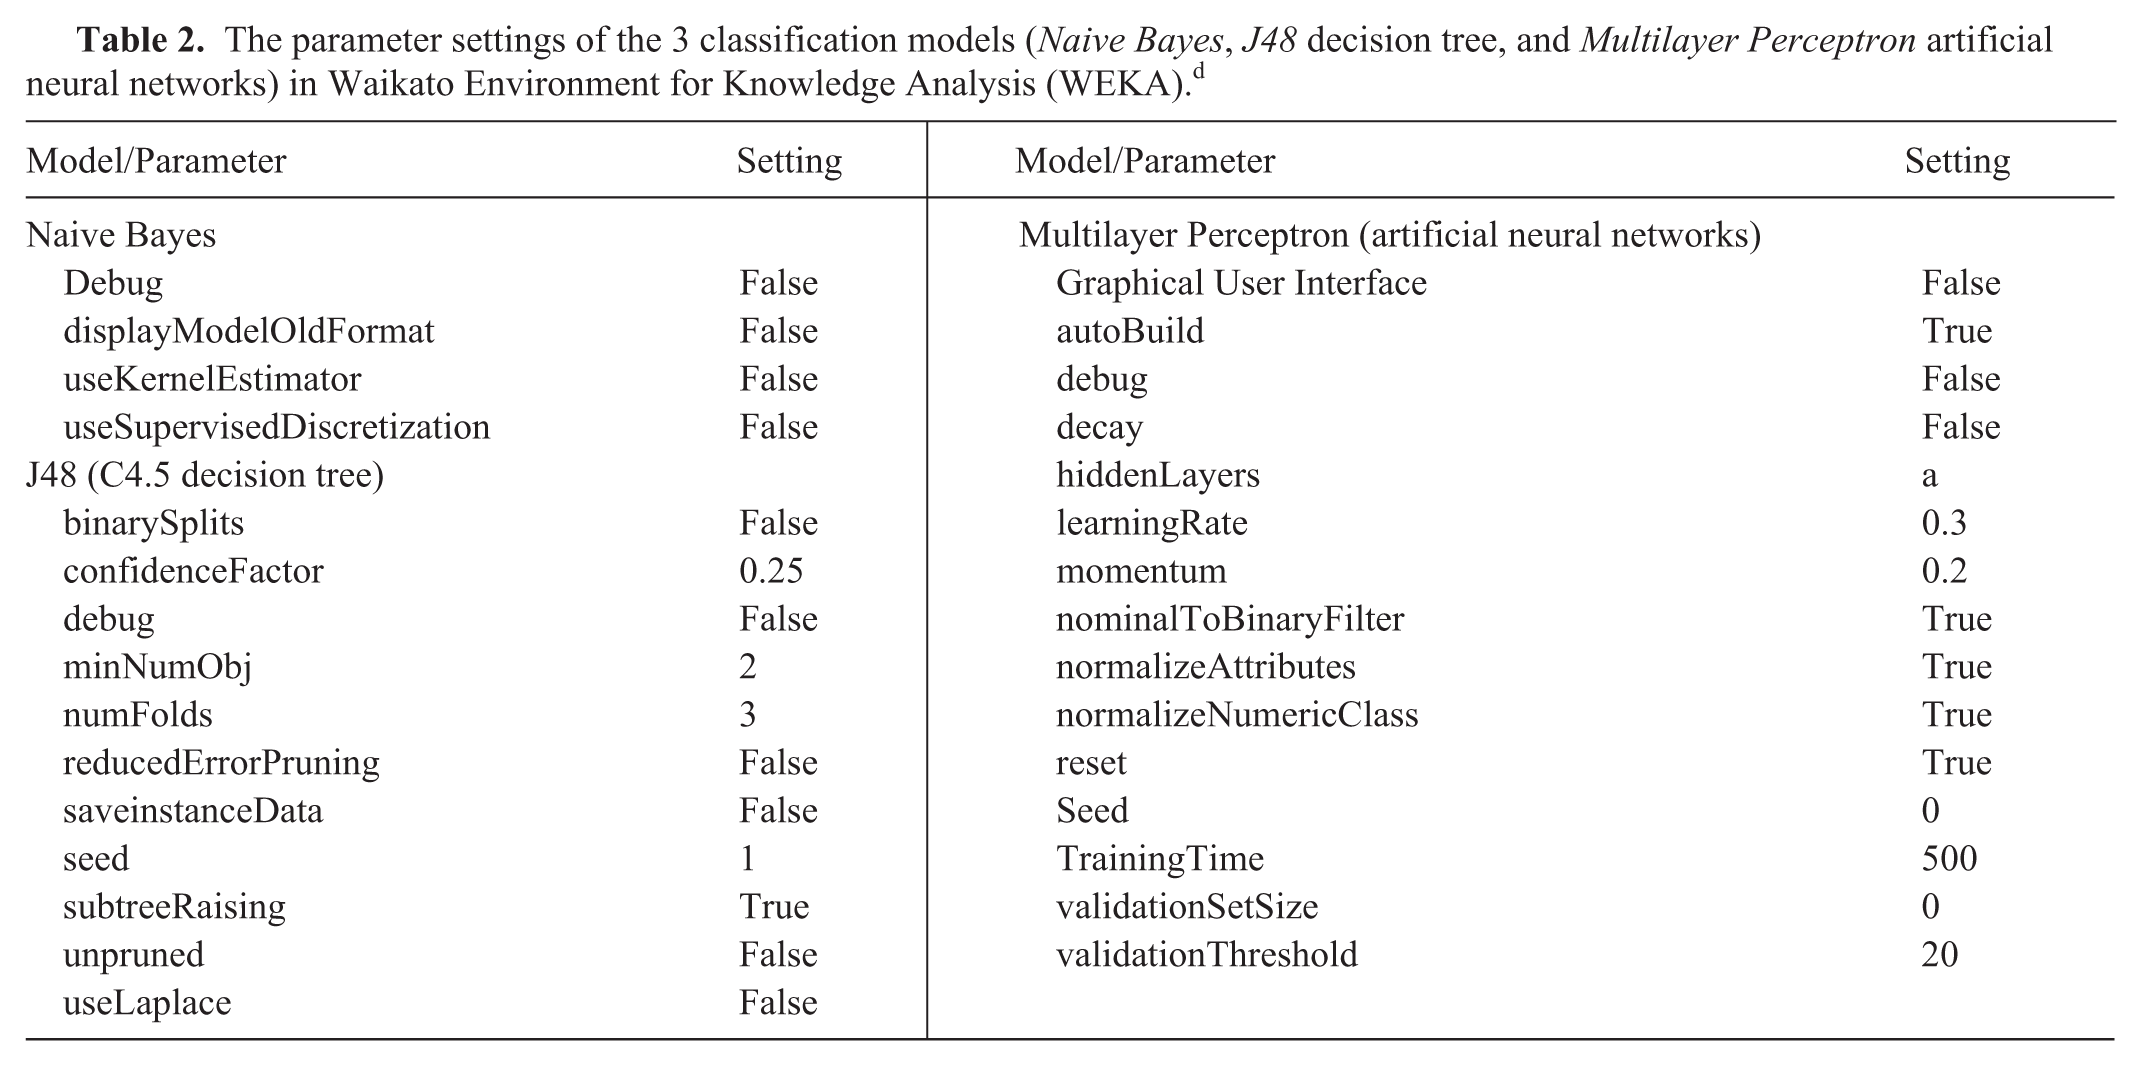
Naive Bayes, C4.5 decision tree, and artificial neural networks classification algorithms were utilized to model the data. Three models for diagnosis prediction were trained using the selected attributes. The parameter settings used in WEKA for classification are shown in Table 2.
The parameter settings of the 3 classification models (Naive Bayes, J48 decision tree, and Multilayer Perceptron artificial neural networks) in Waikato Environment for Knowledge Analysis (WEKA). d
To train and test the generated models, a 10-fold cross-validation technique was performed as previously described (Kohavi R. A study of cross-validation and bootstrap for accuracy estimation and model selection. Proceeding of the 14th international joint conference on artificial intelligence; 1995 Aug 20–25; Montreal, Canada). In this technique, the 120 instances were split into training (90%) and testing sets (10%), in which the testing set was not part of the training set. In the 10-fold cross-validation, 10 different datasets were created; in every one of them a different 10% data partition was held out for testing, and the rest of the 90% data was used for training. The models’ performance was assessed using values of sensitivity, specificity, and area under the receiver-operating characteristic curve (AUC).
In order to exclude any distinction that can be caused by an artifact division of training and testing sets, 10 random repeats of the 10-fold cross-validation technique were performed. Average sensitivity and confidence intervals for every classifier were considered and used for classifiers performance comparisons.
Results
The distribution of the cats in the groups according to their sex and disease was as follows: 16 males and 24 females in the normal group, 21 males and 19 females in the IBD group, and 28 males and 12 females in the ALA group. The median age was 6 years (range: 1–15 years) in the normal cats, 10 years (range: 1–17 years) for cats with IBD, and 13 years (range: 4–18 years) for cats with ALA. Nonparametric comparison tests revealed that the median age was significantly higher in cats with ALA (median = 12.5 years, standard deviation [SD] = 2.51 years) compared to the IBD group (median = 10 years, SD = 4.41 years, p = 0.0043), and significantly higher in the IBD compared to the normal group (median = 6 years, SD = 4.57 years, p = 0.0057).
Nineteen of the 31 CBC and SC variables were not normally distributed on the normal group, along with 22 of the IBD variables, and 16 of the ALA variables. A nonparametric Kruskal–Wallis test revealed 16 CBC and SC variables statistically different across the 3 groups (normal, IBD, and ALA). Table 3 shows median and range values for the variables that were statistically different across different groups. In Table 4, a nonparametric each-paired Wilcoxon test shows the CBC and SC variables that were different across each diagnosis pair (Normal–IBD, Normal–ALA, and IBD–ALA). Variables were selected using the Wrapper attribute selection method, using naive Bayes, decision tree, and artificial neural networks as evaluators, as shown in Table 4.
Cohort comparison of complete blood count and serum chemistry data; only statistically different variables are shown.*
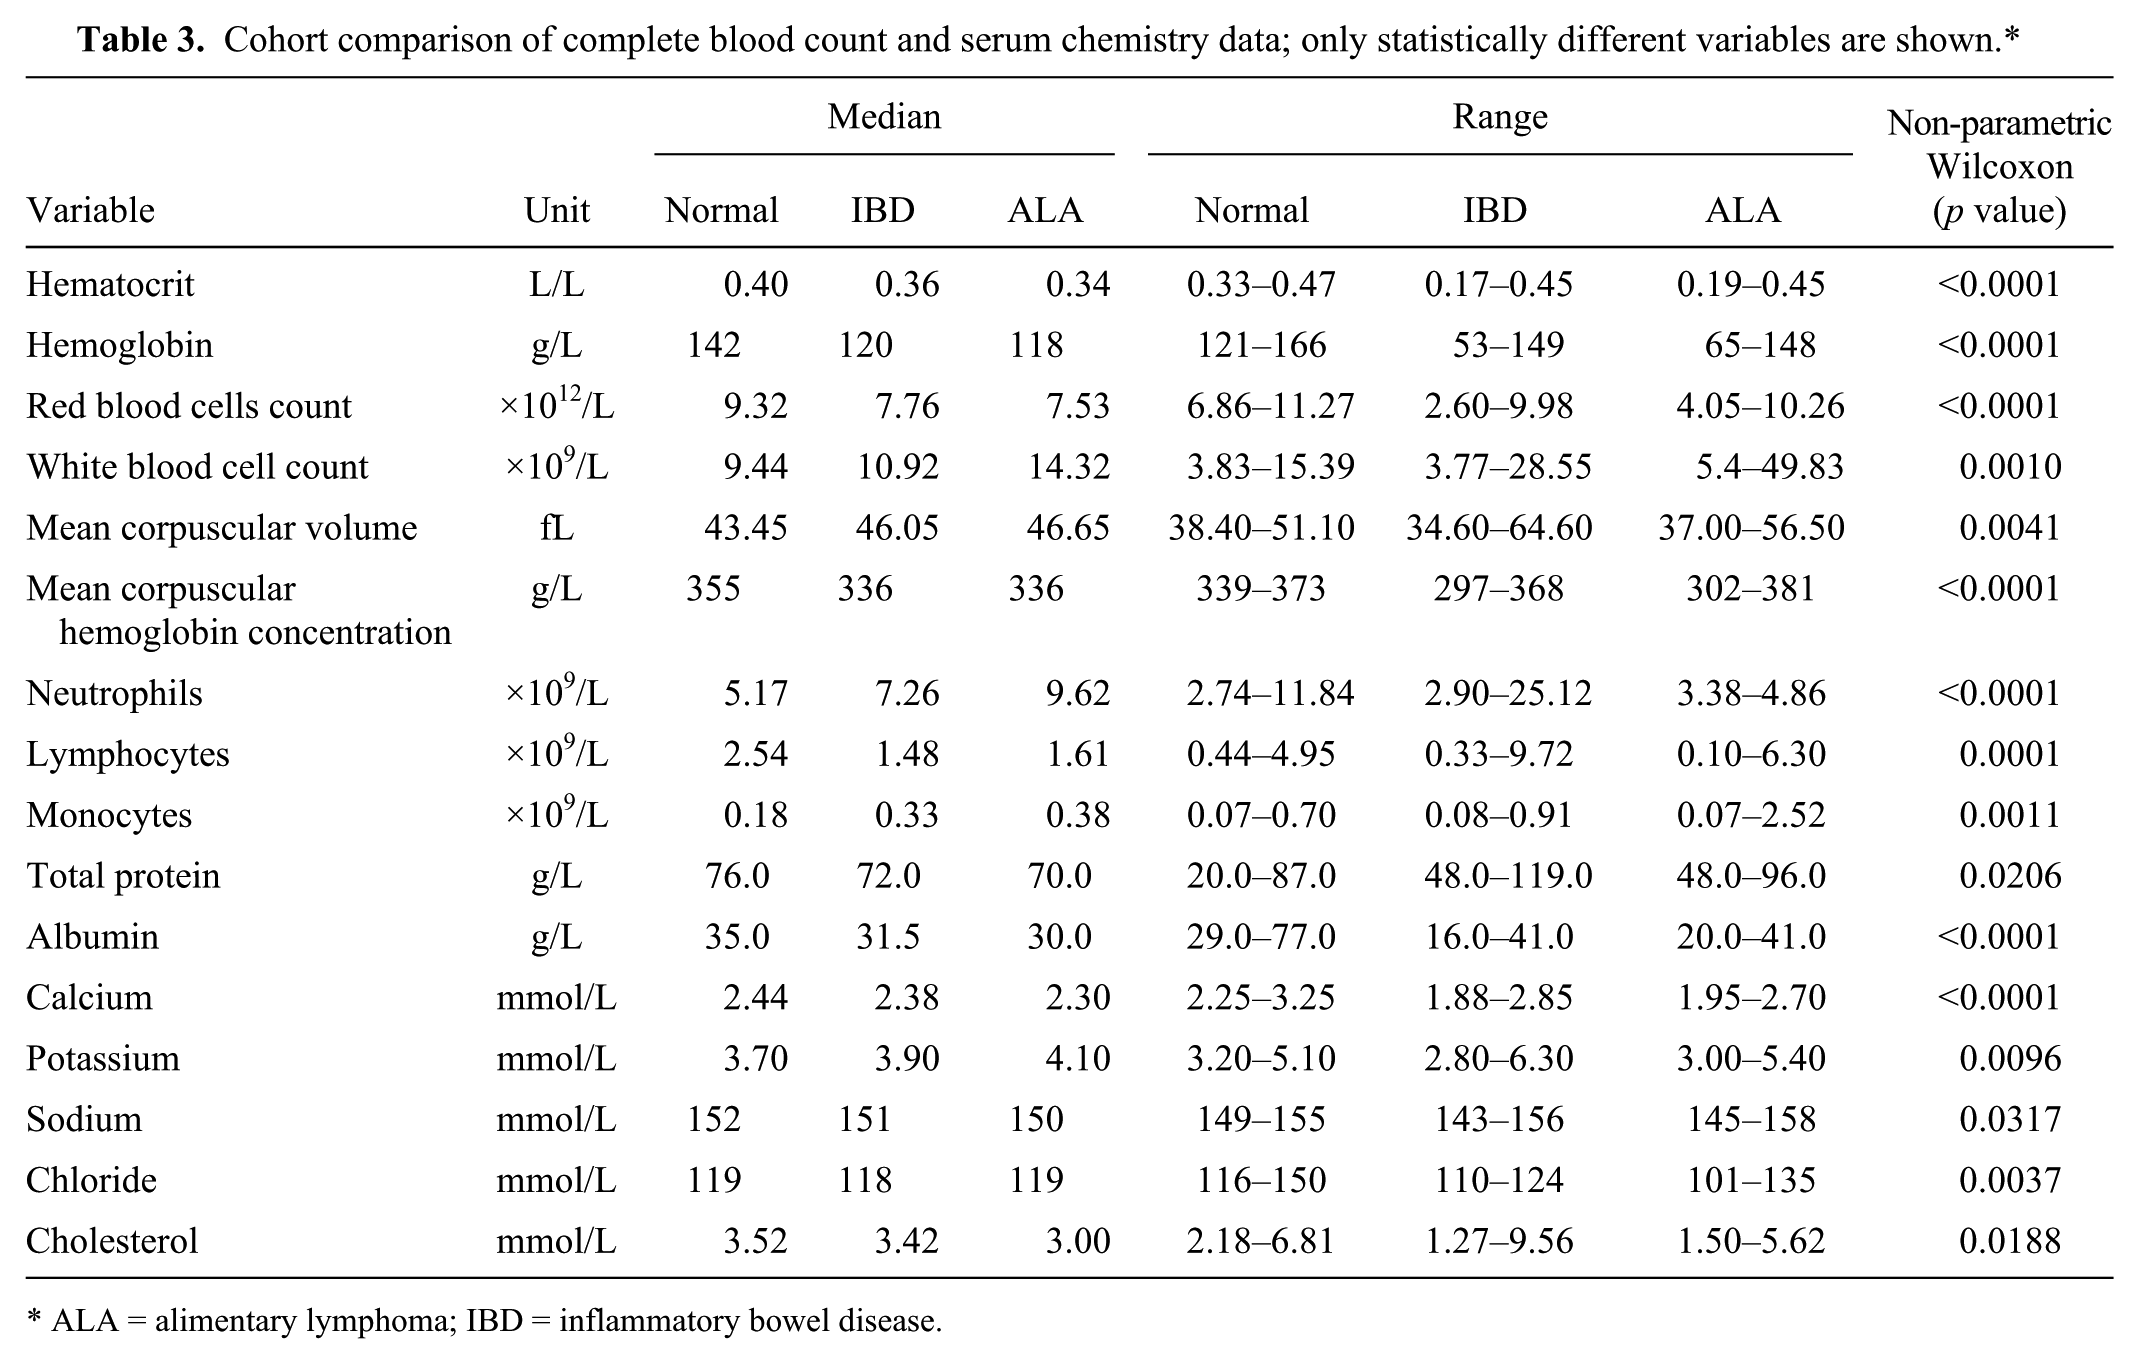
ALA = alimentary lymphoma; IBD = inflammatory bowel disease.
Each-paired comparison of complete blood cell count and serum chemistry data according to the diagnosis groups. Variable is only shown if it was different across all pairs and between any pair, or if it was selected by the attribute selection approach.*
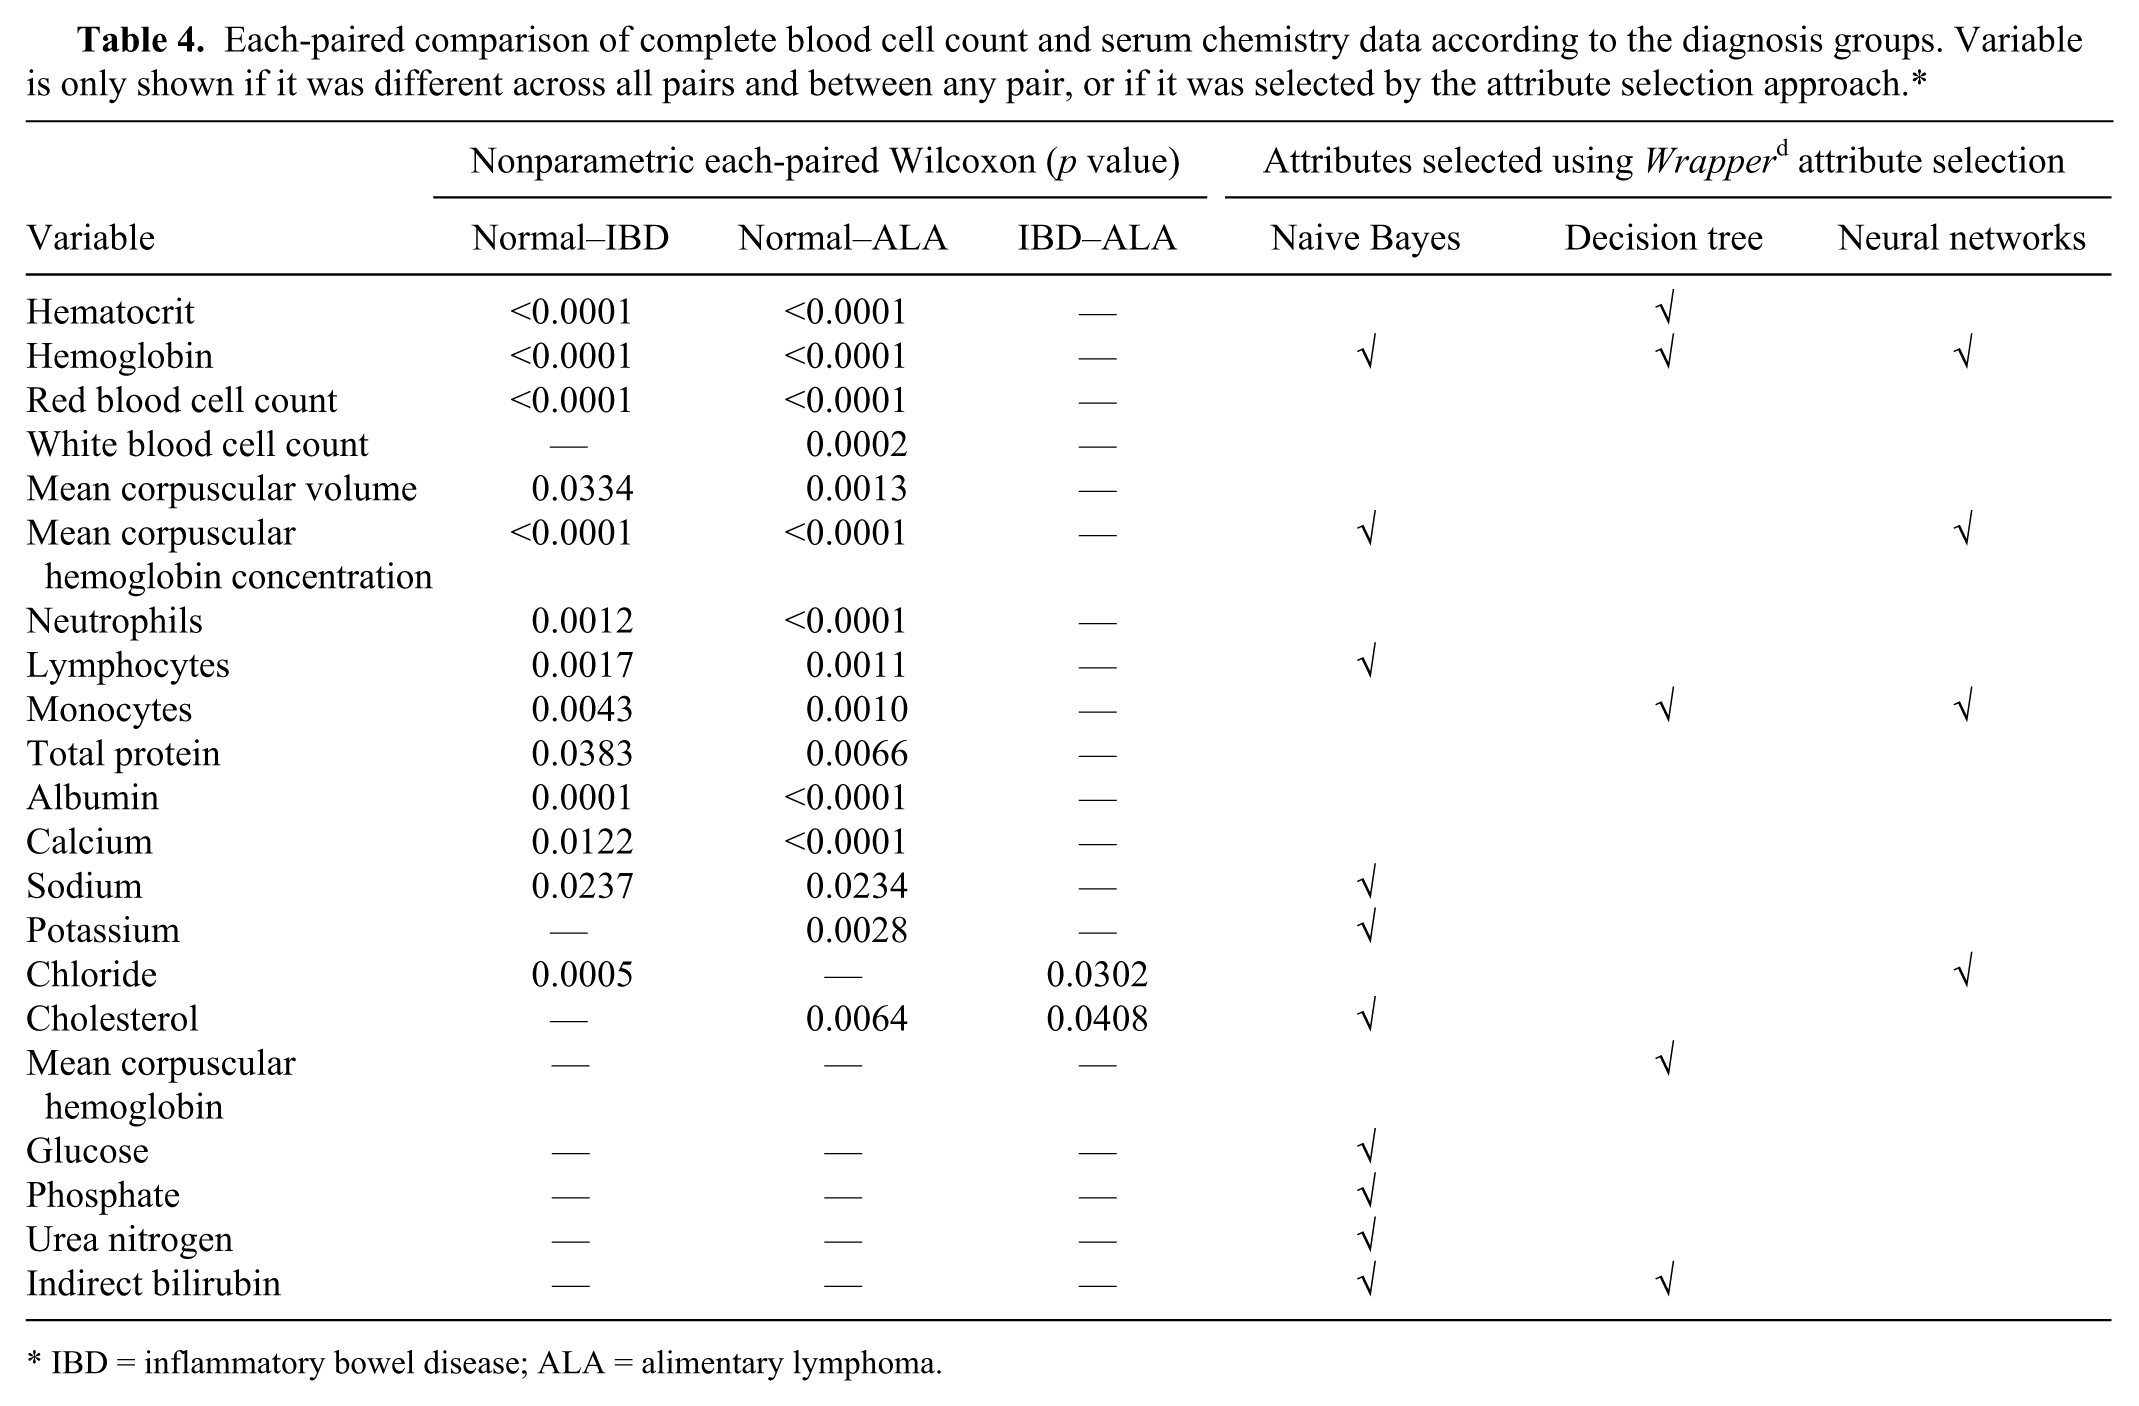
IBD = inflammatory bowel disease; ALA = alimentary lymphoma.
The first run of the 3 models using the 120 instances on a 10-fold cross-validation to split data into training and testing sets revealed an AUC of 83.2% using the naive Bayes classifier, 79.0% AUC using the decision tree classifier, and 82.0% AUC using the artificial neural networks (Table 5). ROC curves of naive Bayes, C4.5 decision tree, and artificial neural networks are presented in Figure 1A–1C, respectively. The decision tree generated by the C4.5 model trained on the 120 instances is shown in Figure 2.
Sensitivity, specificity, and areas under the curve (AUC) from the receiver-operating characteristic graphs for the 3 classifiers.*
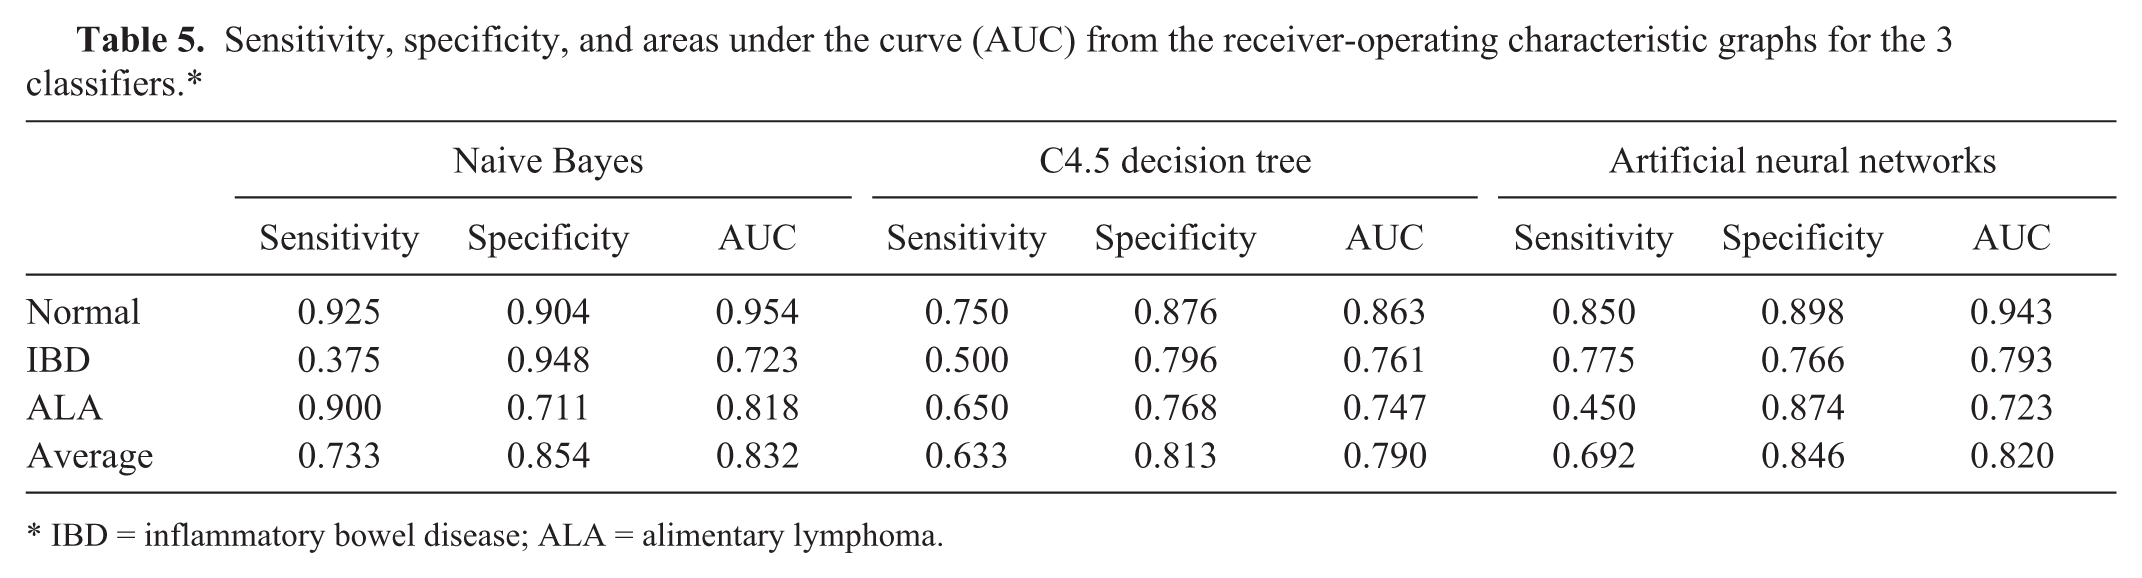
IBD = inflammatory bowel disease; ALA = alimentary lymphoma.
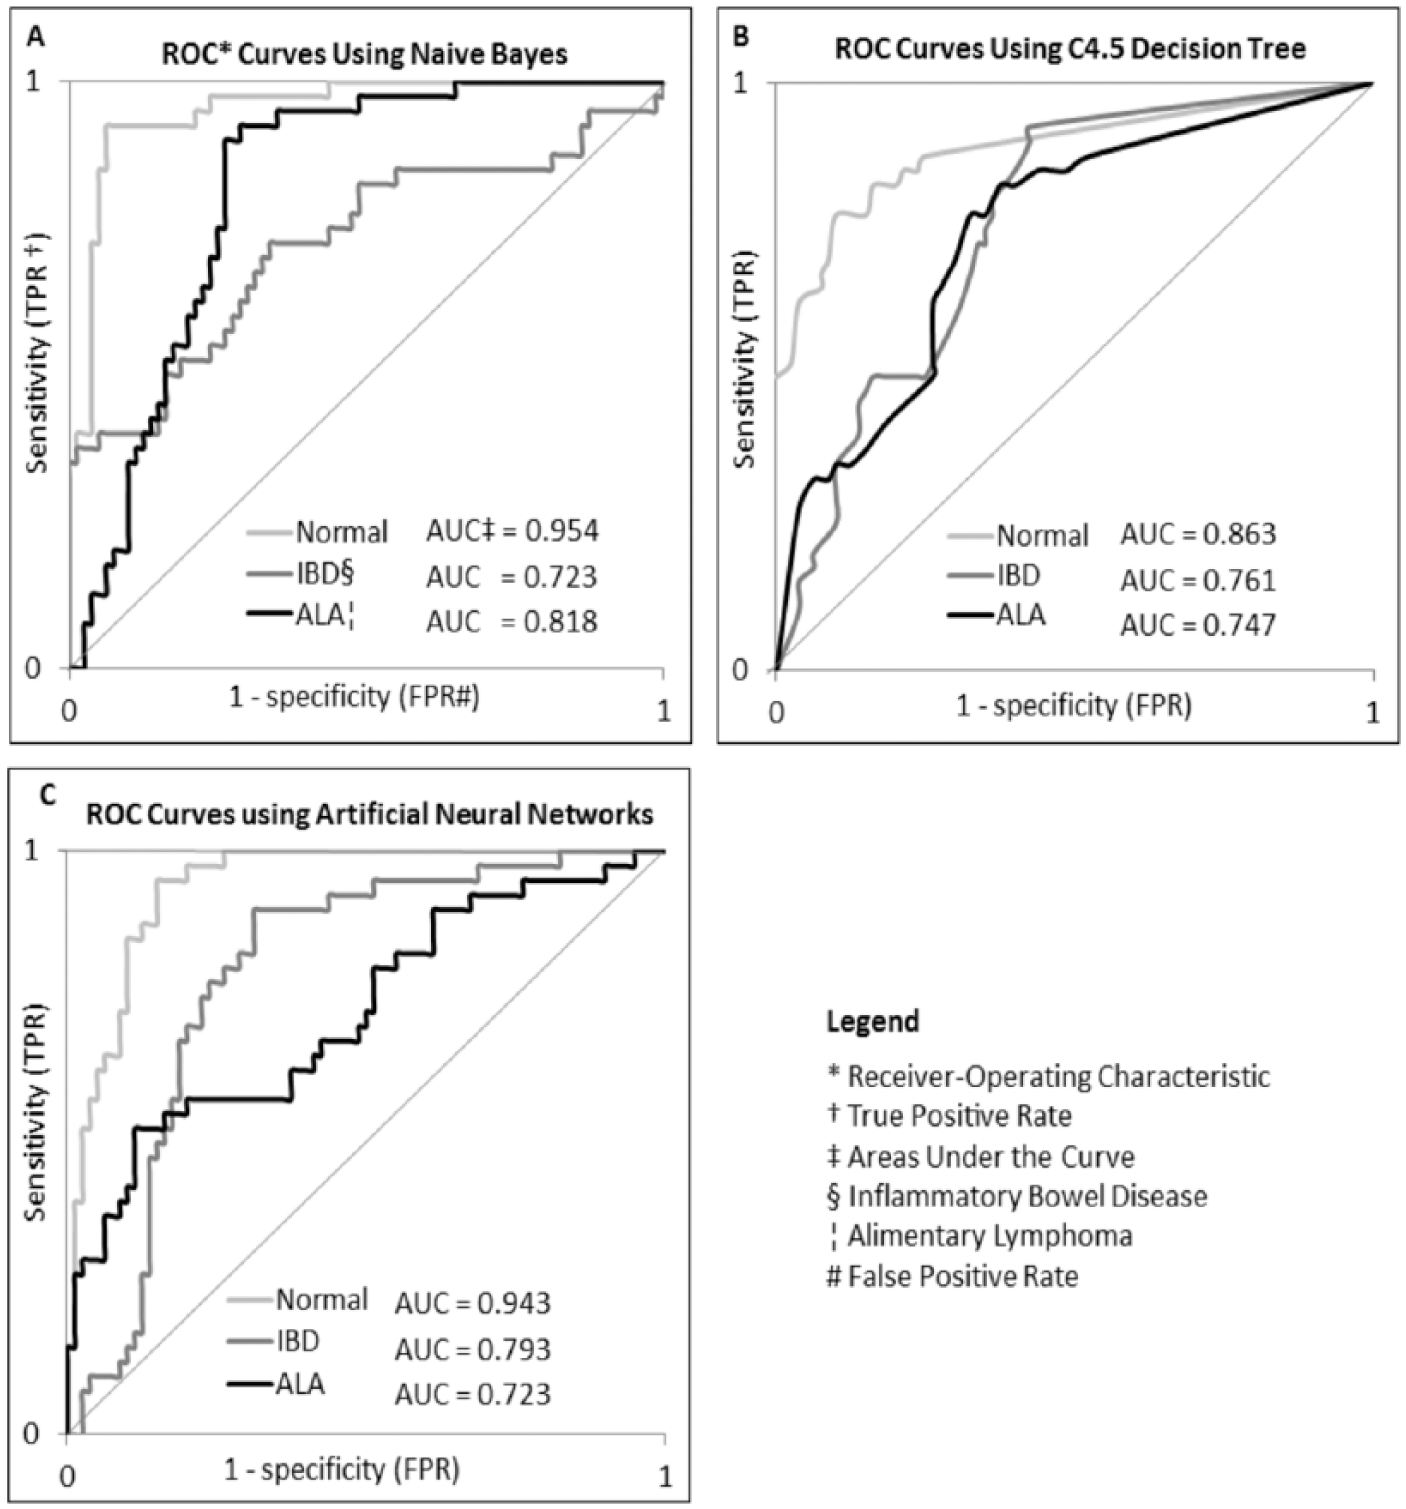
Receiver-operating characteristic graphs and areas under the curve from the 3 classification models: naive Bayes (
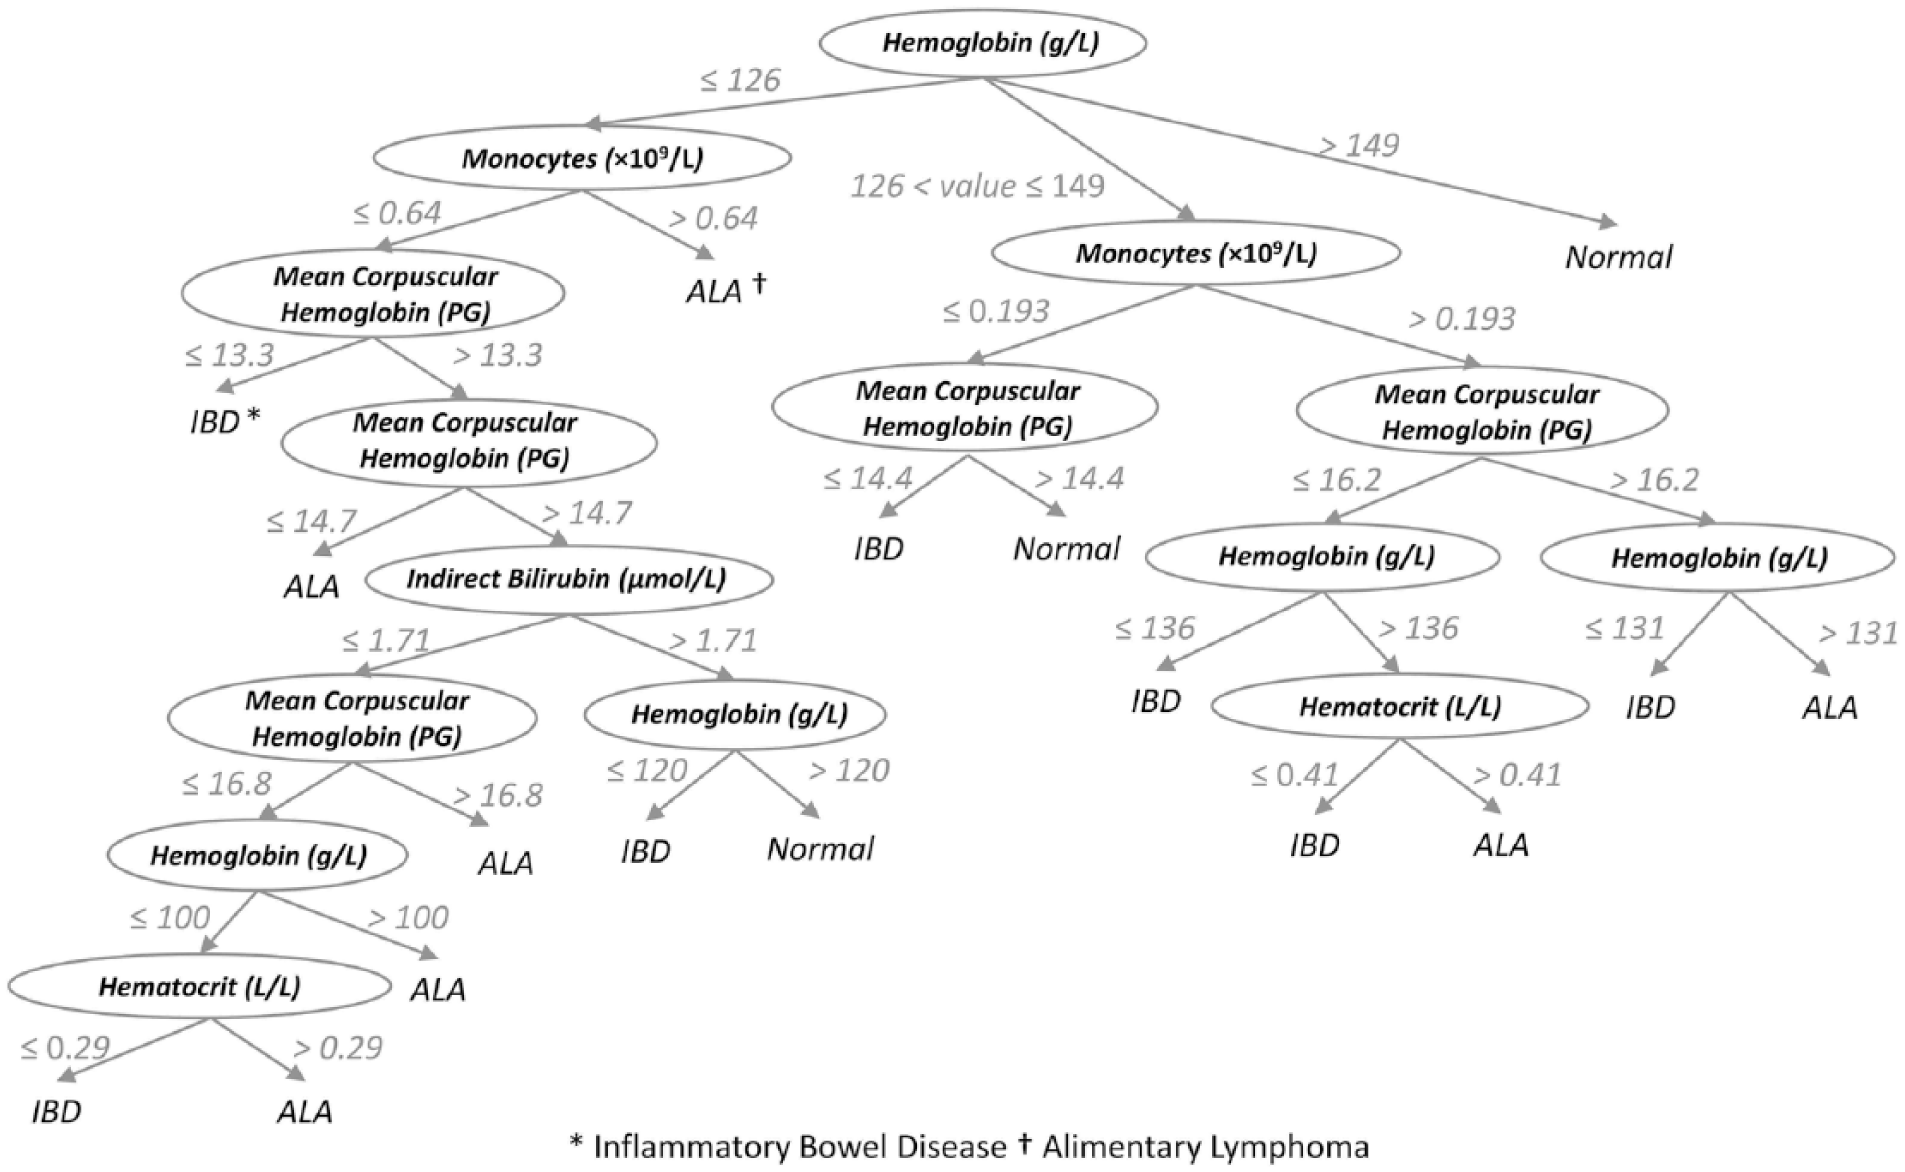
A flowchart showing the decision tree generated by the C4.5 classifier. Each node (variable shown in oval shape) represents an attribute and criteria used to classify cases. Numbers indicate values used for branching between nodes. Leaf terms (the ends of branches) represent case predicted class.
The average sensitivity values for every model using 10 repeats of 10-fold cross-validation were the following: 70.83% (95% confidence interval [CI]: 68.91–72.75%) for the naive Bayes, 62.67% (95% CI: 59.59–65.75%) for the C4.5 decision tree, and 69.17% (95% CI: 67.04–71.30%) for the artificial neural networks (Table 6). Two-tailed t-tests showed that performance sensitivity achieved by naive Bayes was not different than the sensitivity achieved using the neural network classifier (p = 0.2586). However, both classifiers achieved a sensitivity that was higher than the one achieved using the decision tree classifier (p < 0.0001).
Summary for 10 random repeats of 10-fold cross-validation: the performance of naive Bayes, C4.5 decision tree, and artificial neural networks classifiers.
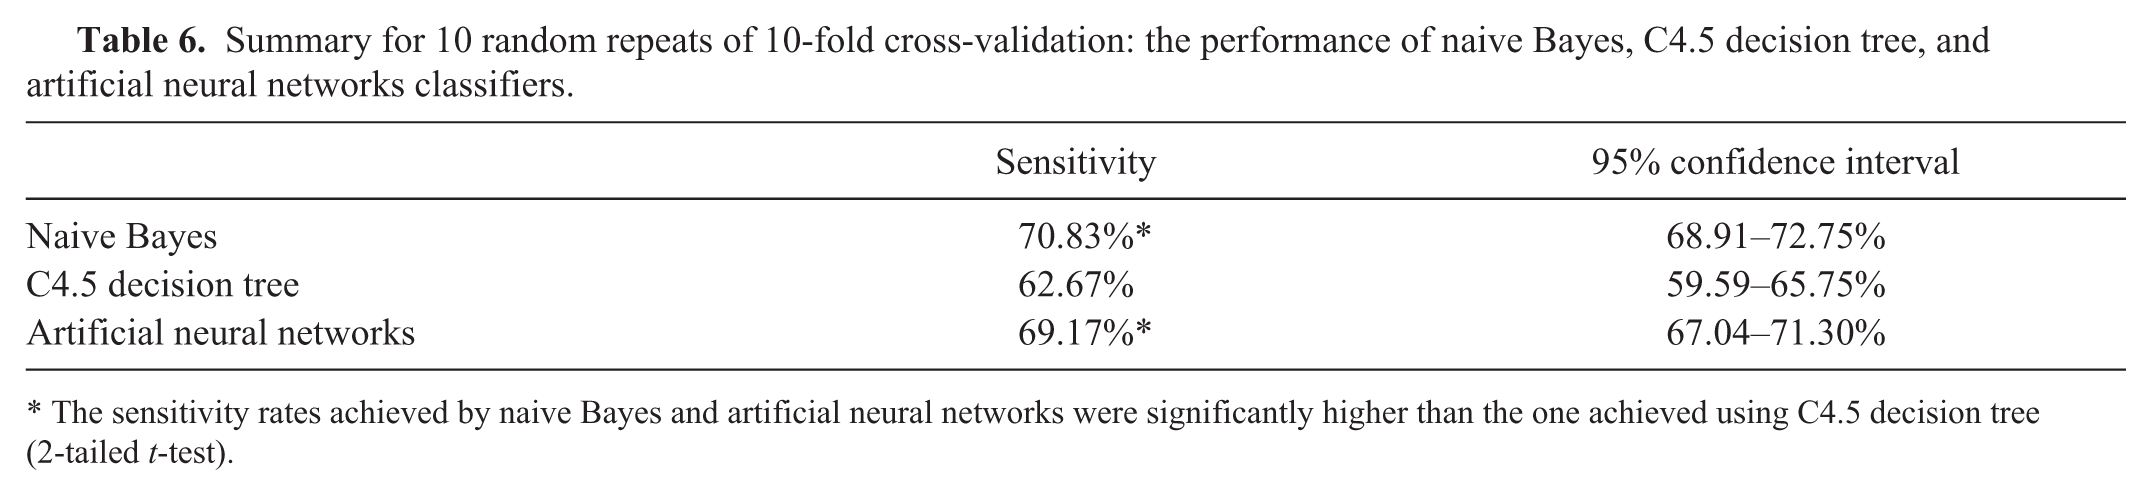
The sensitivity rates achieved by naive Bayes and artificial neural networks were significantly higher than the one achieved using C4.5 decision tree (2-tailed t-test).
Discussion
Basic statistical analyses in previous studies7,16,18,27 have shown laboratory differences between normal cats and cats with IBD and ALA. Cats with IBD or ALA tended to have mild non-regenerative anemia attributed to chronic disease and suppression of hematopoiesis as previously found.16,18 Consistent with these previous reports, CBC results in our study showed that cats with IBD and ALA had significantly lower red blood cell counts (RBC; 7.76 × 10¹²/L and 7.53 × 10¹²/L, respectively) and cats with ALA had higher white blood cell counts (WBC; 14.32 × 10⁹/L) compared to the normal group (9.32 × 10¹²/L RBC, 9.44 ×10⁹/L WBC). Some of the SC abnormalities revealed in this study are also consistent with previous studies, 9 in which plasma total protein and albumin concentrations were significantly lower in IBD and ALA cats compared to the normal group (Tables 3, 4). Unfortunately, few differences were identified as possible discriminators using traditional comparative statistics between the ALA and IBD groups except for chloride and cholesterol (Table 4).
However, the naive Bayes, C4.5 decision tree, and artificial neural networks proved more successful in differentiating between IBD and ALA cases as well as normal animals. Of the 3 algorithms examined, the naive Bayes and artificial neural network overall sensitivities were significantly higher than achieved by the decision tree algorithm (2-tailed values, p < 0.0001 and p = 0.0008, respectively), as shown in Table 6.
In classifying ALA cases alone, the mean sensitivity achieved by the naive Bayes was higher (p < 0.0001) than achieved by the decision tree classifier, and both were higher (p < 0.0001) than achieved by the neural networks. For IBD, the mean sensitivity achieved using the neural networks classifier was higher (p < 0.0001) than achieved by the naive Bayes and decision tree classifiers.
Naive Bayes was the top performer for identifying normal cats (but not different from neural networks), and this group had the highest sensitivity in all classifications. Sensitivities achieved by the naive Bayes and the neural networks were significantly higher (p < 0.0001) than achieved by decision tree.
These findings suggest that the best practice is to use the naive Bayes or artificial neural networks classifiers for class prediction. It might be essential to consider the number of attributes used in making the classification; the naive Bayes achieved its accuracy using 10 CBC and SC variables, and the artificial neural networks classifier achieved a not significantly different accuracy using only 4 variables as shown in Table 4.
Several studies have investigated the use of a variety of biomarkers to differentiate feline ALA from IBD and support the diagnosis. In immunophenotyping, a previous study 5 showed that in 28 T-cell type ALA cases, 82% had >75% of neoplastic lymphocytes labeled for expression of CD3 and 18% of cases had 51–75% of cells expressing CD3. In the same study, 50% of cases with lymphoplasmacytic enteritis had the same number of CD3+ or CD79a+ lymphocytes. In another study, 30 immunolabeling for the critical lymphocyte survival factor, Bcl-2, was performed on small intestinal biopsy sections, and the study determined that the expression in ALA was significantly higher than it was in cats with IBD. Another approach to distinguish between IBD and ALA is by clonality testing using PCR. In 1 study, 22 22 of 28 cats with ALA had clonal rearrangement of the T-cell receptor γ chain gene, and polyclonal population of cells was identified in all 9 cats with IBD. Using disease indicators from feces, 6 it was previously shown that fecal α1-PI concentration is higher in cats with severe IBD or ALA. The same study showed that low serum albumin and total protein concentrations may be common findings in cats with IBD or ALA. Serum thymidine kinase activity 31 has been reported to be a useful tumor marker in humans and animals. The level of thymidine kinase in serum has shown also to be a prognostic indicator of ALA. However, the AUC, which has been advocated as an evaluation criterion for comparing different diagnostic tools, showed that using this predictor for the diagnosis of ALA is weak (AUC = 0.66), leading to an inability to identify the cats with ALA. The AUC in our study for the diagnosis of ALA using the naive Bayes model is considered to be good (Fig. 2). Moreover, the variables used in prediction do not require any extra tests to be performed; we are utilizing routine laboratory values (CBC and SC variables) to make the prediction.
In spite of its “black box” limitation, the accuracy achieved using the naive Bayes algorithm alone (80.6%) was good in this study. It was the overall best classifier examined. Other medical decision support studies have found similar results using naive Bayes classifiers. An intelligent heart disease prediction system was developed using the 3 machine-learning techniques of decision tree, naive Bayes, and neural networks. These techniques were applied on medical profiles data from attributes such as age, sex, and blood sugar to predict the likelihood of animals developing heart disease. The revealed prediction system had a high performance using the 3 techniques; however, the naive Bayes model was shown 23 to outperform the other 2 with the highest number of correctly classified instances. The naive Bayes classifier was considered 40 the most useful machine-learning classifier that can support physicians’ decisions; it achieved the highest accuracy in classifying 20 case and 10 case datasets into 30 diagnostic classes of sport injuries using only 118 training instances.
A decision tree for predicting classification of groups can be developed using the C4.5 classifier. The advantage of the decision tree over the other algorithms used in our study is that it creates a visual graph depicting selected variables and threshold values used for decision making. This is in direct contrast to the neural network and naive Bayes algorithms, which have been referred to as a “black box,” providing no insight as to how classification was determined. The decision tree consists of human-readable rules of classification that makes it easily applicable by clinicians and pathologists at the point of practice. However, the tree can still be hard to understand from a pathophysiologic standpoint, with some of the decision variables making little intuited sense.
Clinically, it is difficult to distinguish between IBD and ALA in cats. Compared with statistical-based descriptive analyses, prediction models using machine learning provided a method for distinguishing between the 2 disorders, and they allow for individualized prediction of disease. The prediction models reported in our study used noninvasive laboratory data, a decided advantage over traditional endoscopic testing. The naive Bayes and artificial neural networks classifiers used 10 and 4 CBC/SC variables, respectively, to outperform the C4.5 decision tree, which used 5 CBC/SC variables. Both the naive Bayes and neural network models are good algorithm choices for constructing prediction models in this medical domain.
Footnotes
Authors’ contributions
All authors contributed to conception and design of the study; critically revised the manuscript; and gave final approval. A Awaysheh and KL Zimmerman contributed to acquisition, analysis, and interpretation of data; drafted the manuscript; and agreed to be accountable for all aspects of the work in ensuring that questions relating to the accuracy or integrity of any part of the work are appropriately investigated and resolved. J Wilcke, F Elvinger, L Rees, and W Fan contributed to analysis of data.
a.
Advia 2120 hematology analyzer, Siemens Healthcare Diagnostics, Deerfield, IL.
b.
AU480 analyzer, Beckman Coulter, Krefeld, Germany.
c.
JMP Pro 11 program, SAS Inc., Cary, NC.
Declaration of conflicting interests
The author(s) declared no potential conflicts of interest with respect to the research, authorship, and/or publication of this article.
Funding
The author(s) received no financial support for the research, authorship, and/or publication of this article.