
Abstract
Haptoglobin is a positive moderate acute phase protein (APP) in cats. Measurement of haptoglobin can be used in the diagnosis, prognosis, and monitoring of systemic inflammatory disease, especially by creating profiles with major APPs. The aim of our study was to validate a sandwich enzyme-linked immunosorbent assay (ELISA) for measurement of feline haptoglobin. The validation included an assessment of precision, accuracy, detection limit, method comparison with a spectrophotometric assay, and evaluation of the overlap performance. The concentration of haptoglobin was measured in serum from 27 healthy and 23 sick cats. The coefficients of variation were 2.5–4.7% for intra-assay variability and 7.1–11.6% for interassay variability. The ratio of observed to expected dilutional parallelism of 4 serum samples was 108.1–118.4%. The ratio of observed to expected spike recovery of 4 serum samples was 90.8–94.0%. The lower detection limit was 0.19 g/L. Method comparison revealed a positive correlation (rs = 0.949, P < 0.0001) and a proportional bias between the methods of −38.9%. Agreement between the methods was not clinically acceptable. Overlap performance of the ELISA was deemed satisfactory. The sandwich ELISA measures feline haptoglobin with an analytical and overlap performance acceptable for clinical purposes. Given the observed bias, the ELISA cannot be used interchangeably with the spectrophotometric assay.
Introduction
The acute phase response is part of the innate immune system. It is triggered by different stimuli, such as infection, inflammation, neoplasia, or surgical trauma. As part of this early-defense system, the concentration of plasma proteins, called acute phase proteins (APPs), changes by at least 25%. Measurement of APPs can be used as highly sensitive, but nonspecific, biomarkers in veterinary medicine.3,33,34,37 Haptoglobin is recognized as a positive moderate APP in cats. Its serum concentration increases up to 2- to 10-fold after stimulation, peaks after 2–3 days, and decreases at a slower rate than major APPs.3,10,23,35 Because of their different kinetics, measurement of both major and moderate APPs is recommended. Such profiles can be used in diagnosis, prognosis, and in monitoring response to therapy, as well as in general health screening.3,4,9 Assays for the detection of haptoglobin in serum or plasma can be classified into 2 main groups: 1) spectrophotometric assays, which are based on the ability of haptoglobin to bind hemoglobin11,17; and 2) immunoassays.3,41 A commercially available multispecies-specific kit based on the spectrophotometric method has been used to measure feline haptoglobin.13,23,24,28 This kit has only been validated independently in canine serum, demonstrating reliability for detecting canine haptoglobin.11,31 To our knowledge, no independent validation of a commercial assay to detect haptoglobin or another moderate APP in cats has been published. A species-specific enzyme-linked immunosorbent assay (ELISA) for canine and feline haptoglobin has become commercially available. The aim of our study was to evaluate the validity of this assay in detecting and measuring haptoglobin concentrations in feline serum. The evaluation included an assessment of precision, accuracy, detection limit, method comparison with the spectrophotometric assay, and evaluation of the overlap performance.
Material and methods
Samples
Serum samples used in our study were obtained from client-owned cats between June 2012 and January 2014 at the Clinic of Small Animals, Freie Universität Berlin, Germany. The specimens were unused remnants of samples routinely collected for diagnostic and monitoring purposes at the clinic. Owner consent to use these blood samples for scientific purposes is routinely given at the intake examination. The study was furthermore approved by the ethics committee of Berlin. Serum samples from 50 cats were included (n = 6 for analytical validation, n = 39 for method comparison, and n = 47 for overlap performance). All cats received a general clinical examination, as well as basic hematologic and biochemical profiles. Additional diagnostic tests for each cat were conducted at the discretion of the attending clinician (e.g., venous blood gas analysis, measurement of 3-β-hydroxybutyrate, urinalysis, radiography, ultrasonography, endocrine testing). Clinically healthy cats (n = 27) were client-owned cats with no history of clinical illness and unremarkable findings on physical and hematologic examination. They were presented to the clinic for various reasons, such as health screening prior to blood donation.
Venous blood was collected into a serum tube containing a clot activator a and allowed to clot at room temperature (20°C) for 30 min. Sera were separated by centrifugation at 3,500 × g for 5 min. Samples were stored in aliquots in plastic vials at 4°C within 60 min after collection and were then stored frozen at −20°C within 24 h for a maximum of 18 months until they were analyzed. On the day of analysis, only vials required for each specific analytical run were thawed to prevent potential variation because of repetitive freeze–thaw cycles. Aliquots were thoroughly vortexed before haptoglobin measurement. Lipemic and hemolyzed samples were excluded.
Enzyme-linked immunosorbent assay
Haptoglobin concentration was determined using a commercially available ELISA. b The assay is based on a direct sandwich technique and uses affinity-purified polyclonal rabbit anti-haptoglobin antibodies as capture and detection antibodies. The assay was performed according to the manufacturer’s instructions. Concentrations of standards were 0, 125, 250, 500, 1,000, and 2,000 µg/L (dilution factor of samples 1:10,000). After manually prewashing and adding assay buffer to each well, 20 µL of standards and prediluted samples were pipetted into the wells in duplicates. The plate was incubated for 60 min at 20°C on a plate shaker at 500 rpm. c After incubation, unbound antibodies were removed by manual washing, and horseradish peroxidase (HRP)-conjugated anti-haptoglobin antibodies were added. After a 30-min incubation at 20°C, the unbound HRP-labeled antibodies were washed away and the substrate 3,3′,5,5′-tetramethylbenzidine (TMB) was added. TMB substrate reacts with the HRP resulting in concentration-dependent color development. Hydrochloric acid (HCl) was added to stop the enzymatic reaction, changing the blue color to yellow. The optical density (OD) values were determined spectrophotometrically at 450 nm with a reader. d The average OD produced for duplicate standards was used to create a 4-parameter curve in a linear/linear scale. e The haptoglobin concentration in g/L was obtained by multiplying the value read off the standard curve by the dilution factor.
Spectrophotometric assay
The commercially available spectrophotometric assay f was used as a comparative method as it has been the main measuring method for feline haptoglobin in several previous studies,13,23,24,28 and is currently in use for routine diagnostic measurements of feline haptoglobin. The test is based on the ability of haptoglobin to bind hemoglobin. This complex conserves the peroxidase activity of hemoglobin at a low pH resulting in a color change of the added chromogen. 11 The assay was performed according to the manufacturer’s instructions. Concentrations of standards were 0, 0.312, 0.625, 1.25, and 2.5 g/L. As recommended by the manufacturer, samples were tested neat and were only diluted 1:5 with the diluent buffer if the haptoglobin concentration was >2.5 g/L. First, 7.5 µL of standards and samples were pipetted into the wells in duplicate. After adding hemoglobin and gently shaking the microplate for 1 min, the chromogen was pipetted into each microwell. The plate was incubated for 5 min at 20°C and was then measured spectrophotometrically at 630 nm. Results were calculated using a 4-parameter curve in linear/linear scale.d,e
Analytical validation
Precision was determined by calculating the intra- and interassay coefficients of variation (CVs) of 3 feline serum samples of different concentrations. One sample was analyzed 20 times in random order within 1 run, and 2 samples were analyzed 10 times each in random order within their respective run to determine intra-assay CV. The interassay CV was calculated by analyzing the same samples in duplicate using 4 different ELISA kits, carried out on 4 different days. Inaccuracy (i.e., bias or systematic error) was indirectly evaluated by linearity under dilution and by recovery studies. To assess linearity under dilution, 4 feline serum samples containing >3 g/L of haptoglobin were serially diluted (1:5,000; 1:10,000; 1:20,000) with the diluent buffer. The first dilution of 1:5,000 was used to determine the initial concentration. Samples were measured in duplicate in a single run. Results were compared with mathematically predicted concentrations to calculate percent recovery. Spiking recovery was performed to investigate whether a component in the sample interferes in the ELISA. This test was based on the addition of a standard, because purified feline haptoglobin was not available. For that purpose, a 1:5 diluted standard A with a measured haptoglobin concentration of 3.84 g/L was added to the 4 feline sera. The spiked samples were measured in duplicate in random order in a single run. Spike recovery, in percent, was calculated from comparison of mathematically versus measured haptoglobin concentrations. 20 Sensitivity was evaluated by calculating the limit of detection (LOD), which is defined as the ELISA’s capacity to measure the smallest concentration that is statistically distinguishable from a blank. It was calculated from data of 20 replicate measurements of the diluent buffer. 20 A method comparison was performed to assess bias and to determine whether the 2 methods agree sufficiently to be used interchangeably. As a necessary condition for evaluating the method comparison, repeatability of the ELISA and the spectrophotometric assay was first analyzed according to Bland and Altman.1,2 Thirty-nine feline serum samples from healthy and sick cats were included in the method comparison, and haptoglobin concentration of each serum was determined in the ELISA and the spectrophotometric assay. Serum samples that covered the full range of haptoglobin concentrations most frequently expected in clinical settings were chosen from available remnants. 19 All measurements were conducted by the same operator. The method validation of the ELISA was performed in 2 different laboratories: laboratory A for intra-assay imprecision (all measurements), interassay imprecision (12 from 24 measurements), dilution and recovery studies (all measurements), method comparison (all measurements); and laboratory B for interassay imprecision (12 from 24 measurements). All measurements with the spectrophotometric assay were performed in laboratory A.
Overlap performance
Based on the final clinical diagnoses, 47 cats were retrospectively assigned to 3 groups: clinically healthy cats (n = 27), diseased cats without systemic inflammation (n = 12), and cats with systemic inflammation (n = 8). Diseased cats without systemic inflammation included cats with diagnosed and well-managed diabetes mellitus (n = 3) and cats that were diagnosed with feline lower urinary tract disease (n = 9) without any signs of systemic inflammation. Cats classified with systemic inflammation were hospitalized because of diabetic ketoacidosis (n = 5), pancreatitis (n = 2), or diabetic ketosis (n = 1). Most cats of the latter group were diagnosed with other concurrent diseases, such as nephropathy and cholangitis. Overlap performance was assessed by comparing the distribution of haptoglobin levels between the various groups. All measurements were conducted by the same operator in 2 different laboratories (laboratory A, 18 measurements; laboratory B, 29 measurements).
Statistical analysis and performance goals
If available, quality goals were derived from previously reported data on biological variation in dogs, 15 or, if not available, goals were based on general recommendations for performance specifications in immunoassays 7 or in diagnostic tests for companion animals. 20 Arithmetic means, medians, standard deviations (SDs), and intra- and interassay CVs were calculated using routine descriptive statistical procedures. Total CV (CVtotal) of the assay was assessed according to the formula:

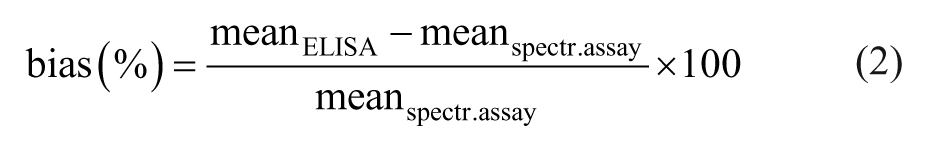
The desirable imprecision (CVdes) was set at 8.5%; the minimally acceptable CV (CVmin) was set at 12.75%. 15 The linearity study, as well as spiking recovery, was considered acceptable if the percentages ranged from 80% to 120%.7,20 LOD was estimated from the mean value of blanks plus 3 SDs. 20 Repeatability according to Bland and Altman1,2 of the ELISA and the spectrophotometric assay was accepted if the mean difference between the duplicate measurements did not differ significantly from zero, and if 95% of the differences lay within the ranges of mean difference ± 1.96 × SD of the mean difference. The method comparison was performed in 3 steps: 1) calculation of the Spearman rank correlation coefficient (rs) for initial assessment of relationship, 2) Passing–Bablok regression analysis, 36 and 3) Bland–Altman difference plot.1,2 In the Passing–Bablok regression, the regression equation and the confidence intervals of 95% (95% CI) of intercept and slope were used to provide information about proportional and constant error. A CUSUM (cumulative sum) test was performed to determine whether the data deviated significantly from the linear model. A Bland–Altman difference plot was created including mean difference of the 2 methods, limits of agreement (mean difference ± 1.96 × SD), and desirable total error (TEdes). In case of a proportional bias, the classical Bland–Altman plot was modified showing the relative difference in percentage on the Y-axis. Bias between the methods was calculated as the mean difference according to the formula12,15:
The desirable bias (biasdes) was set at 6.6%; the minimally acceptable bias (biasmin) at 9.9%. 15 TEdes was set at 20.63%; the minimally acceptable total error (TEmin) was set at 30.94%. 15 The 2 methods were considered to be in agreement if the calculated bias did not exceed biasdes or biasmin and if the limits of agreement were within the limits for TEdes or TEmin in the Bland–Altman difference plot. Overlap performance was assessed by comparison of haptoglobin concentrations among groups of cats using the Kruskal–Wallis analysis and visual assessment of scatter plots. In case of significant distinction, Dunn comparison test was performed to get more detailed information on the deviation. The ELISA was considered valid for the assessment of the acute phase response if the overlap performance of haptoglobin measured by the ELISA was able to discriminate cats with systemic inflammatory disease from clinically healthy cats and diseased cats without systemic inflammation.12,20 Measurements below the LOD of the ELISA were set at 0.1 g/L. P values <0.05 were considered significant. Statistical analyses were performed using commercial software.g,h,i
Results
Analytical validation
The intra- and interassay CVs of 3 feline serum samples measured in the ELISA were 2.5–4.7% and 7.1–11.6%, respectively. The total imprecision CVtotal of each tested serum (7.5%, 11.1%, 12.2%) was less than the minimally acceptable CVmin of 12.75%, but in 2 sera, the measured CVtotal exceeded the desired imprecision CVdes of 8.5% (Table 1). The investigation of linearity under dilution resulted in a range of recovery from 108.1% to 118.4% with a mean of 112.9% (Table 2). Spike recovery ranged from 90.8% to 94.0% with a mean of 91.8% (Table 3). Both recoveries lay within the preset tolerance range of 80–120%. The LOD was calculated as 0.19 g/L.
Intra- and interassay coefficients of variation (CVs) and total CV of haptoglobin concentrations in 3 feline serum samples determined with an enzyme-linked immunosorbent assay.*
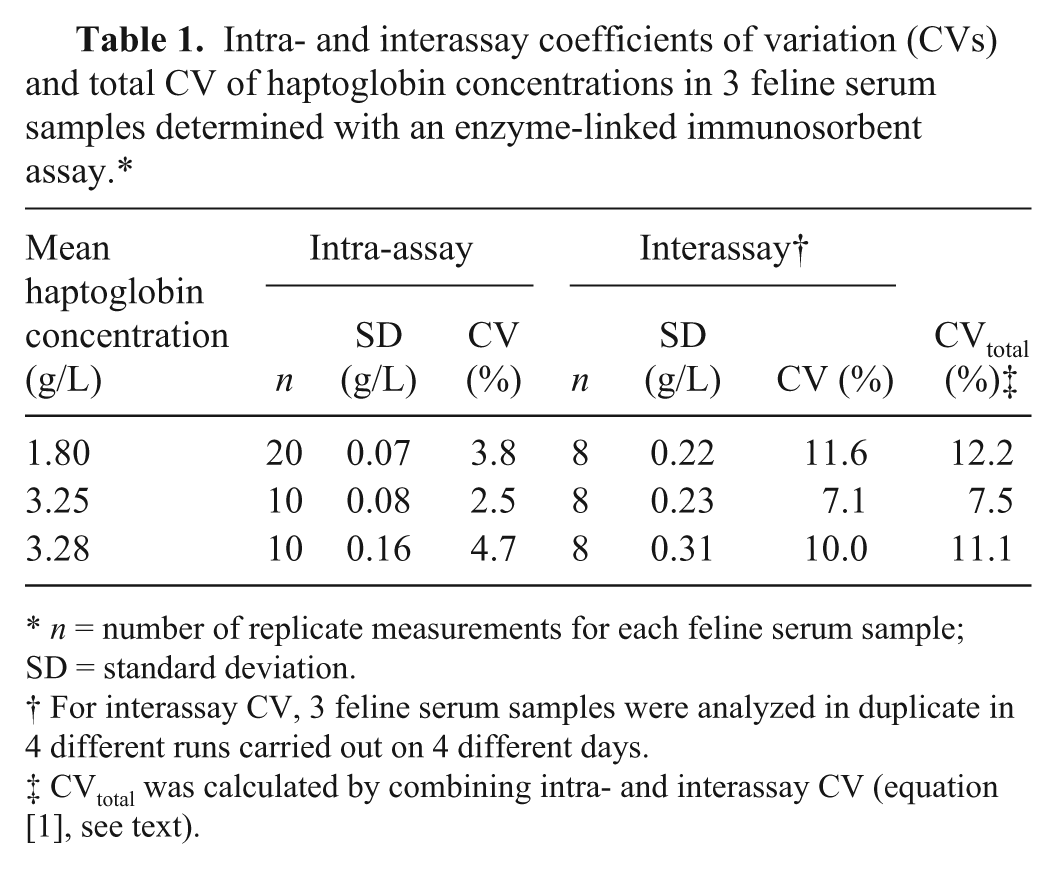
n = number of replicate measurements for each feline serum sample; SD = standard deviation.
For interassay CV, 3 feline serum samples were analyzed in duplicate in 4 different runs carried out on 4 different days.
CVtotal was calculated by combining intra- and interassay CV (equation [1], see text).
Recovery of haptoglobin after dilution evaluated in 4 feline serum samples serially diluted with diluent buffer.
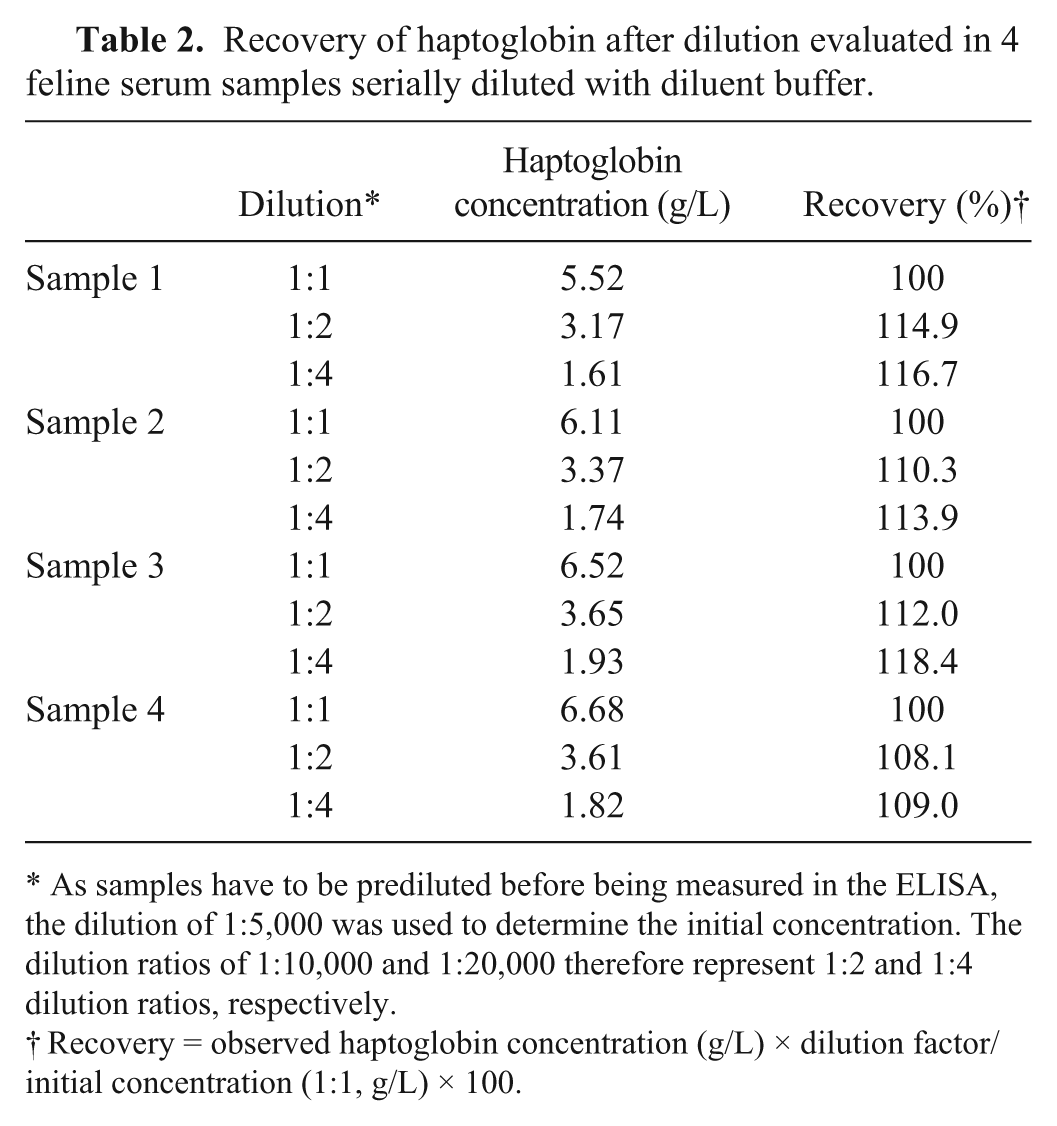
As samples have to be prediluted before being measured in the ELISA, the dilution of 1:5,000 was used to determine the initial concentration. The dilution ratios of 1:10,000 and 1:20,000 therefore represent 1:2 and 1:4 dilution ratios, respectively.
Recovery = observed haptoglobin concentration (g/L) × dilution factor/initial concentration (1:1, g/L) × 100.
Spike recovery study conducted to validate an enzyme-linked immunosorbent assay to measure feline haptoglobin.
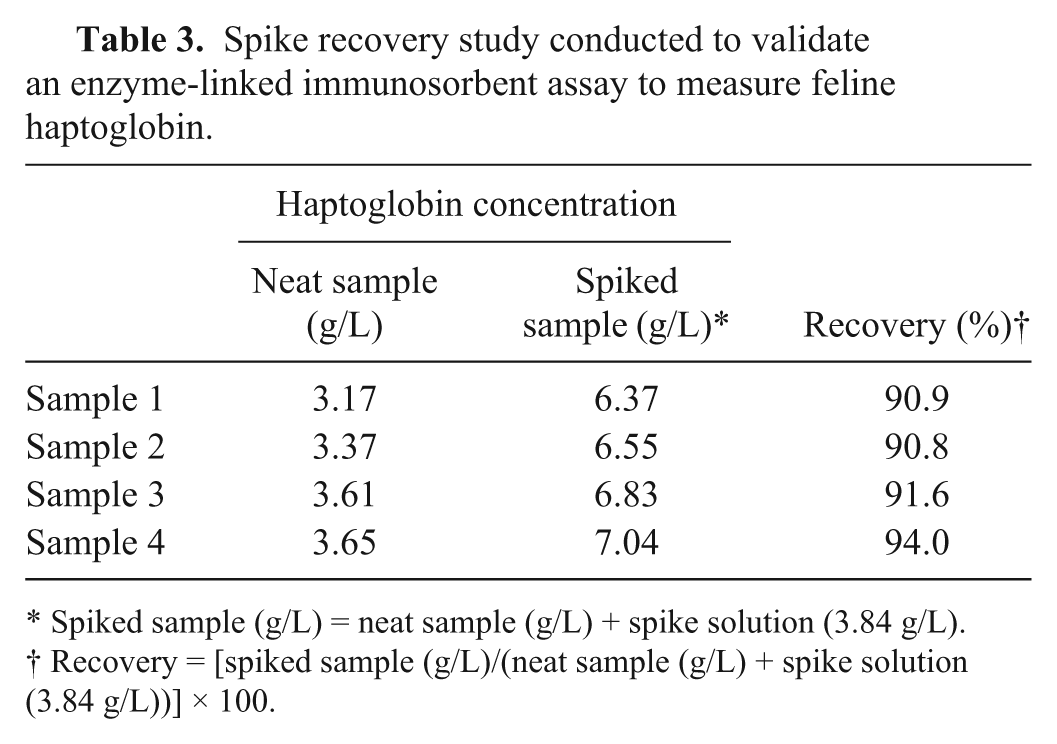
Spiked sample (g/L) = neat sample (g/L) + spike solution (3.84 g/L).
Recovery = [spiked sample (g/L)/(neat sample (g/L) + spike solution (3.84 g/L))] × 100.
The repeatability test according to Bland and Altman demonstrated acceptable results for measurements in the ELISA (Fig. 1A). In the spectrophotometric assay (Fig. 1B), >5% of the 39 measurements exceeded the range of mean difference ± 1.96 × SD of the mean difference. The 4 outliers belonged to 14 samples with a haptoglobin concentration of >2.5 g/L, which were manually diluted (1:5) in the spectrophotometric assay. The resulting concentrations of the diluted samples and consequently the differences between both measurements were back-transformed by multiplying the result with the dilution factor (i.e., 5). Plotting the duplicate measurements without back-transformation (Supplementary Fig. 1, available at http://vdi.sagepub.com/content/by/supplemental-data) criteria for acceptable repeatability were met.
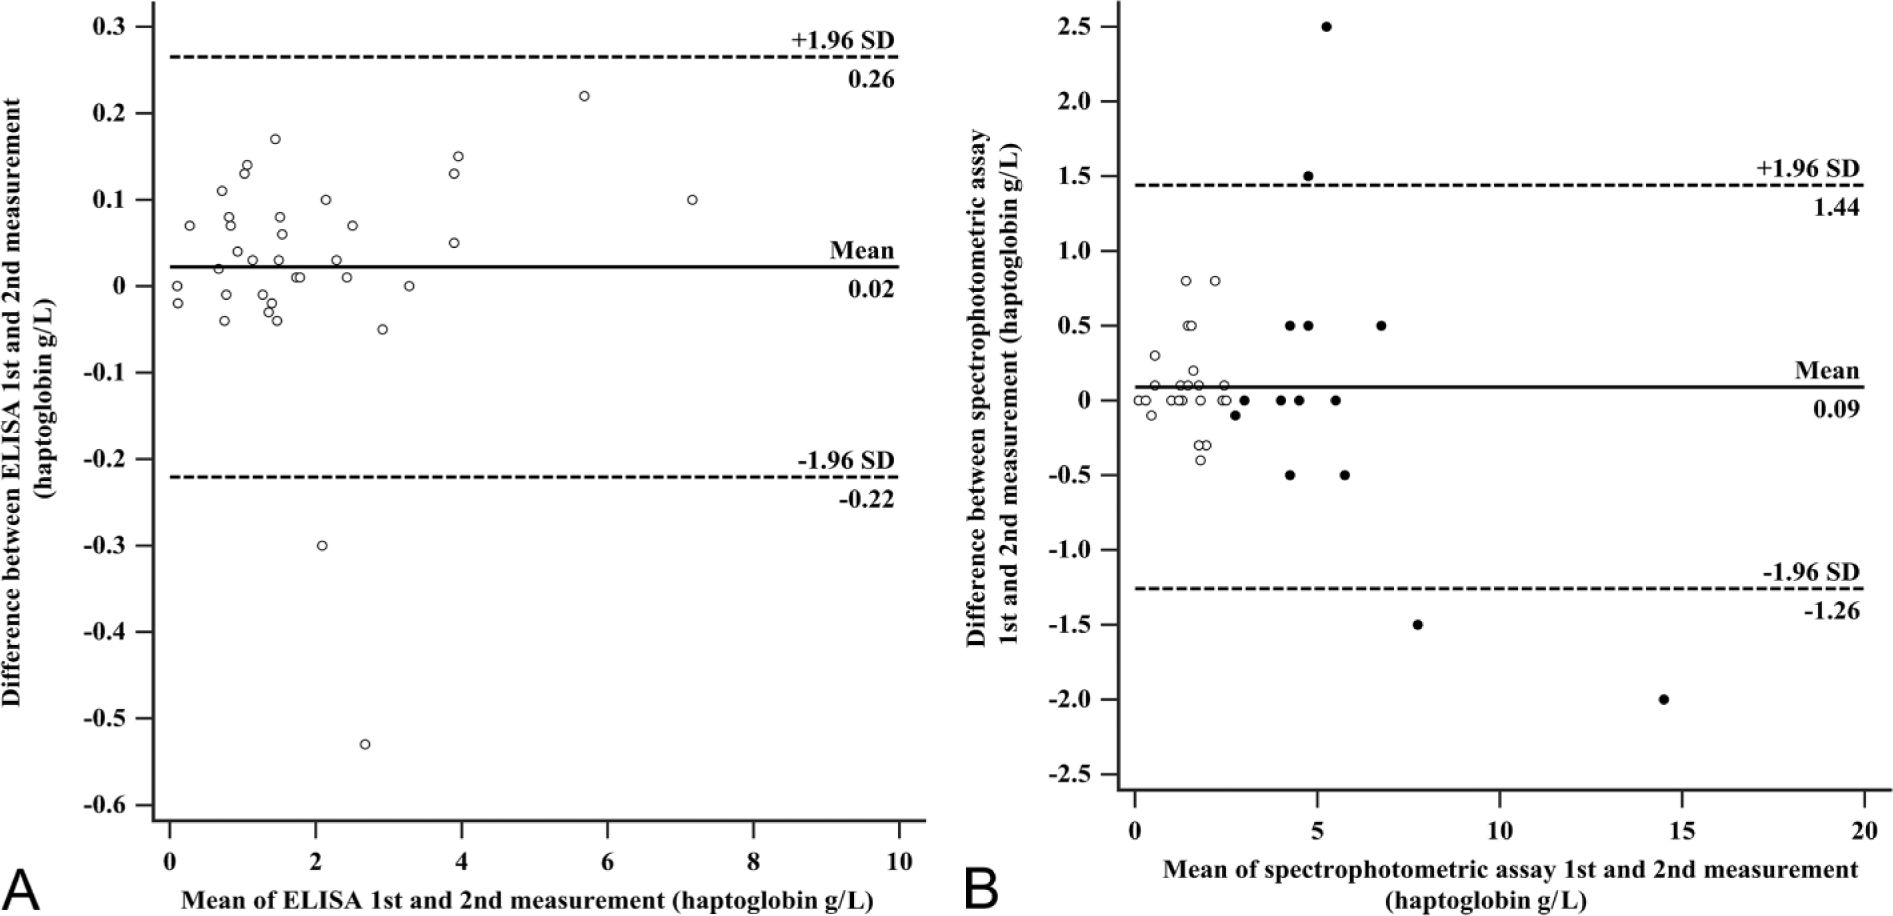
Repeatability according to Bland and Altman for 39 feline serum samples measured in duplicate in the enzyme-linked immunosorbent assay (ELISA) and the spectrophotometric assay. The solid black line represents mean of difference between duplicate measurements of the same serum sample; the 2 dashed lines indicate mean difference ± 1.96 × standard deviation (SD) of the mean difference.
Method comparison
The Spearman rank correlation coefficient (rs) of the method comparison was 0.949 (p < 0.0001), demonstrating a high degree of correlation between the ELISA and the spectrophotometric assay. The Passing–Bablok regression (Fig. 2) revealed a proportional error with slope 0.60 (95% CI: 0.50–0.70), but no constant error (intercept: 0.00 g/L; 95% CI: −0.17 to 0.20 g/L). For samples that were not diluted in the spectrophotometric assay (n = 25), there was a smaller proportional error, but again no constant error; the slope was 0.74 (95% CI: 0.62–0.88), and intercept was −0.14 g/L (95% CI: −0.34 to 0.00 g/L). Given the low number of diluted samples in the spectrophotometric assay (n = 14), no regression analysis was performed for this subgroup of samples, but there appeared to be a proportional bias between the methods. CUSUM test for linearity indicated no significant deviation from linearity for all samples and for the subgroup of undiluted samples in the spectrophotometric assay (p = 0.77 and p = 0.82, respectively).
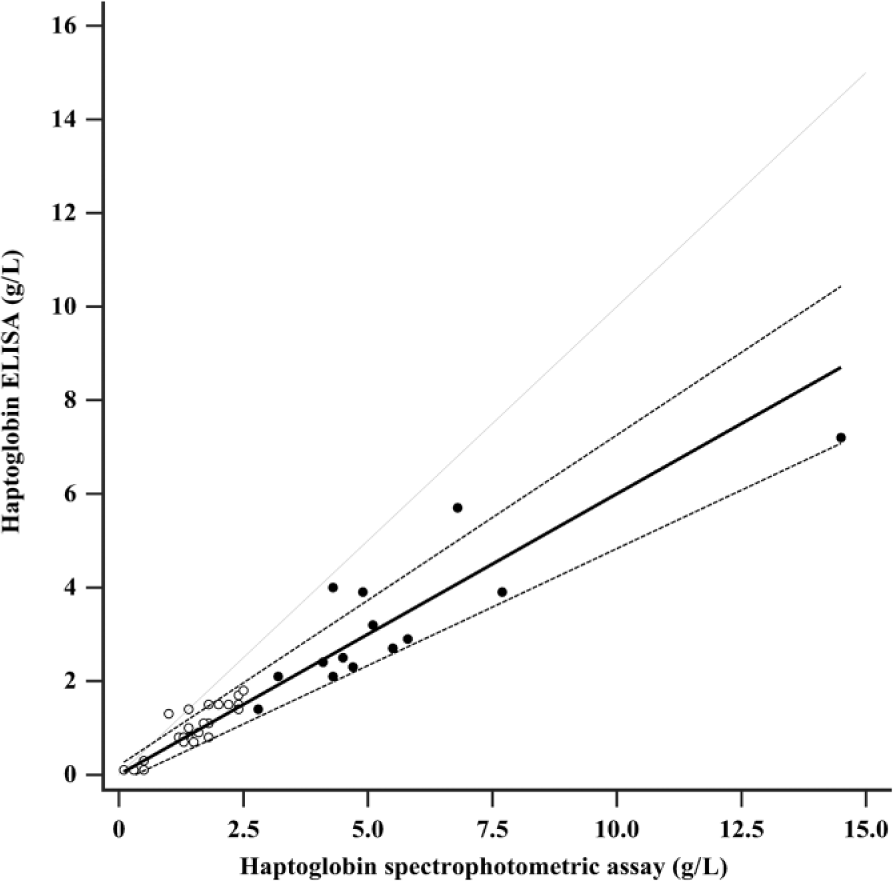
Passing–Bablok regression analysis for haptoglobin concentrations in feline serum using an enzyme-linked immunosorbent assay (ELISA) and a spectrophotometric assay (n = 39). The solid line represents the regression line: haptoglobin ELISA (g/L) = 0.00 g/L + haptoglobin spectrophotometric assay (g/L) × 0.60. The 2 dashed lines indicate confidence bands of the regression line (95% CI for intercept −0.17 to 0.20 g/L and for slope 0.50–0.71). The dotted line represents the line of identity (Y = X). The Spearman rank correlation coefficient (rs) was 0.949 (p < 0.0001). Filled symbols represent samples (n = 14) that were manually diluted (1:5) in the spetrophotometric assay because of a haptoglobin concentration >2.5 g/L.
The Bland–Altman difference plot (Fig. 3) revealed a mean difference of haptoglobin concentrations measured with both methods of 1.13 g/L or 51.0% (95% CI: 0.69–1.57 g/L or 40.5–61.5%). Ninety-five percent of the samples lay within the 2 limits of agreement (lower limit: −1.51 g/L or −12.2%; upper limit: 3.77 g/L or 114.2%), demonstrating good statistical agreement between the methods. The 2 limits of agreement were not included within the 2 limits of TEdes (±TEdes = ±20.63%), nor within the limits of TEmin (±TEmin = ±30.94%). Bias was calculated as −38.9%. Its absolute value did not meet the performance goals of biasdes (6.6%) or biasmin (9.9%), respectively. Therefore, the ELISA and the spectrophotometric assay did not demonstrate clinical agreement. The negative sign of the bias indicated that the concentrations measured in the ELISA were lower than those measured in the spectrophotometric assay.
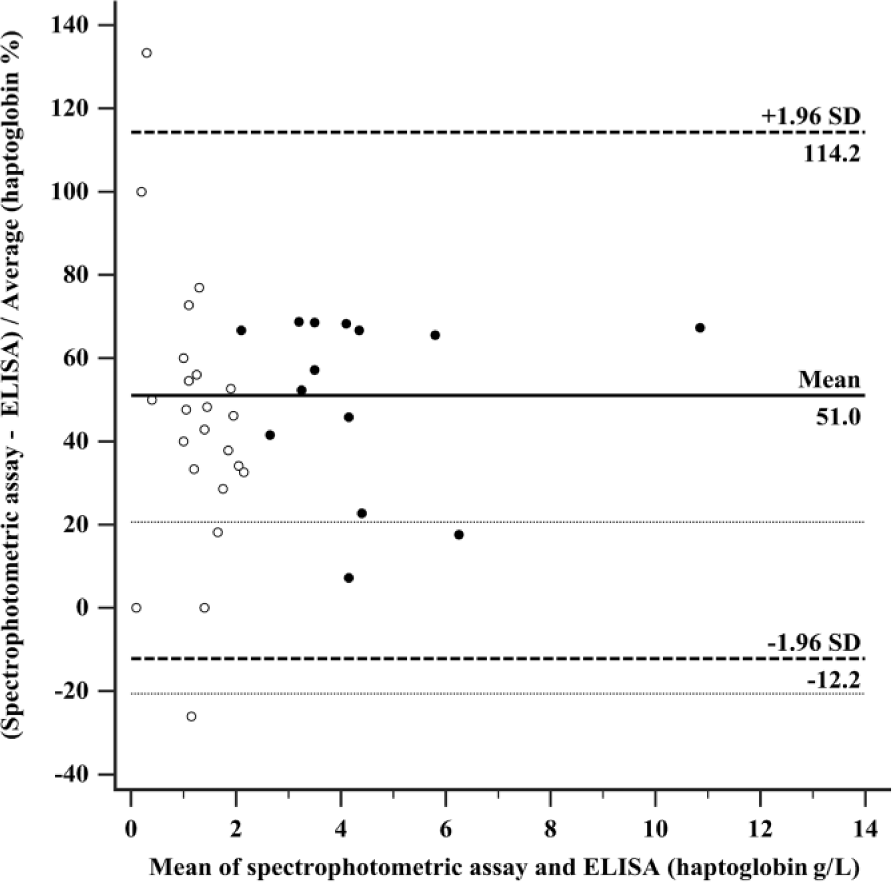
Bland–Altman difference plot for haptoglobin concentrations in feline serum using an enzyme-linked immunosorbent assay and a spectrophotometric assay (n = 39). The solid black line represents mean of difference (1.13 g/L or 51.0%; 95% CI: 0.69–1.57 g/L or 40.5–61.5%). The 2 dashed lines indicate the limits of agreement (i.e., mean difference ± 1.96 × standard deviation of the mean difference): lower limit −1.51 g/L or −12.2% (95% CI: −2.27 to −0.76 g/L or −30.3% to 5.8%), and upper limit 3.77 g/L or 114.2% (95% CI: 3.02–4.53 g/L or 96.2–132.3%). The dotted lines represent the limits for desirable total error (±TEdes = ±20.63%). Filled symbols represent samples (n = 14) that were manually diluted (1:5) in the spectrophotometric assay because of a haptoglobin concentration >2.5 g/L.
Overlap performance
The medians (range) of haptoglobin concentrations in the 3 groups of cats were as follows: clinically healthy cats, 0.38 (0–2.57) g/L; diseased cats without systemic inflammation, 1.10 (0–2.71) g/L; and cats with systemic inflammation, 5.67 (3.28–8.03) g/L. The results of the Kruskal–Wallis analysis indicated that the distribution of concentrations in the groups were significantly different (p < 0.0001). Dunn comparison revealed that the concentration of haptoglobin in the cats suffering from systemic inflammation was significantly higher than the other 2 groups (p < 0.005). The concentrations of haptoglobin in the clinically healthy cats and diseased cats without systemic inflammation did not differ significantly (p = 0.887; Fig. 4).
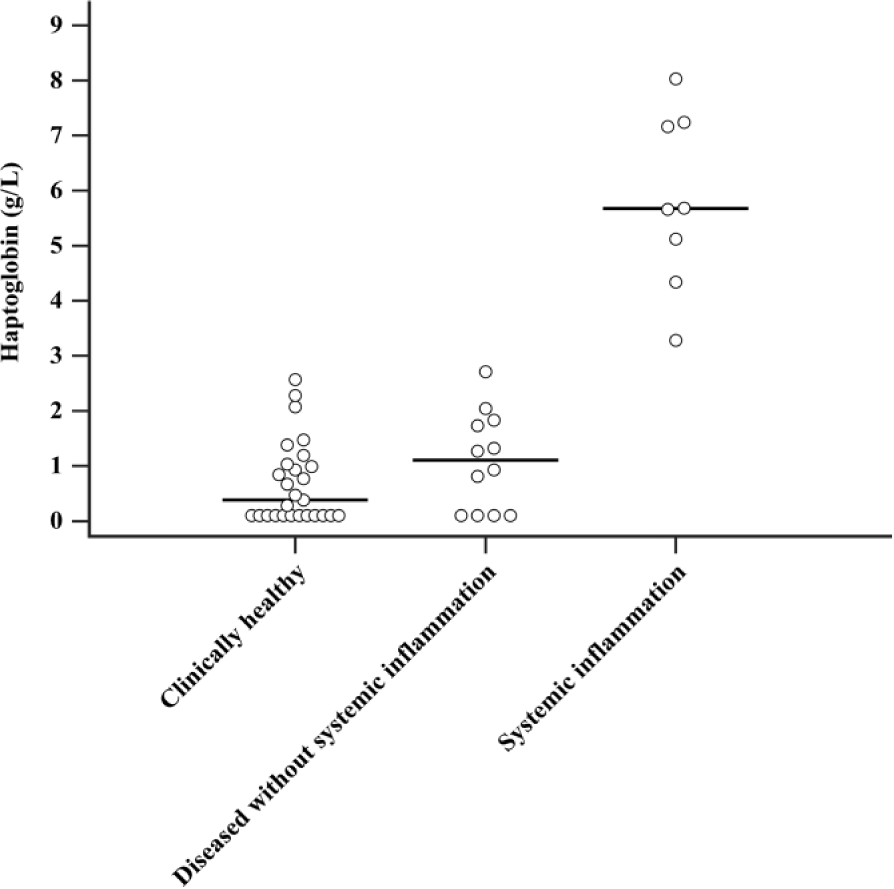
Haptoglobin concentrations in serum from healthy (n = 27) and diseased cats (n = 20) demonstrating the overlap performance of haptoglobin determined by an enzyme-linked immunosorbent assay in distinguishing disorders without (n = 12) and with (n = 8) systemic inflammation. Horizontal lines indicate median concentrations.
Discussion
Validation of a new method for measurement of diagnostic markers can be divided into 4 phases, listed in order: 1) assessment of analytical performance (analytical validation), 2) assessment of value in health and disease (overlap performance), 3) assessment of diagnostic sensitivity and specificity in clinical settings of interest, and 4) assessment of outcome performance. 25 In the present study, the first 2 phases were performed for a sandwich ELISA for measurement of feline haptoglobin.
A basic step for analytical validation is the setting of performance goals prior to validation. The hierarchy of analytical performance specifications defined by a consensus agreement consists of 3 models in the following sequence: 1) goals based on the effect on clinical outcome, 2) goals based on biological variation of the analyte, and 3) goals based on the state of the art. 38 To our knowledge, no data regarding those models has been published for haptoglobin in cats. Therefore, we defined our performance goals for imprecision, bias, and total error on the basis of reported data for biological variation in dogs, 15 because haptoglobin is a positive moderate APP in both species with similar concentrations in healthy dogs and cats3,23,32 and mainly because the recommendations for CVdes/min, biasdes/min, and TEdes/min are similar or even more strict than recommendations for method validation in human medicine6,29,40 or general recommendations in veterinary medicine. 20 By applying these goals derived from previous studies in dogs, we do not claim that the biological variation of haptoglobin in dogs and cats is the same. On the other hand, our performance goals for accuracy were derived from published recommendations for performance specifications in immunoassays 7 or in diagnostic tests for companion animals. 20 In general, we decided on quality goals with the intention that clinical decisions and thus patient care are not affected as long as the goals are achieved.
The results for imprecision performance of the ELISA were not as desired, but were considered acceptable because all 3 analytical CVtotal were less than the CVmin, with one CVtotal meeting the desirable criterion of CVdes. The CVdes and CVmin result from the idea that, for adequate monitoring, the analytical imprecision should be restricted to add only a certain percentage to the total variability (as a sum of biological and analytical variation). Thus the desirable analytical CVdes is defined as CVdes < 0.5 × CVI and the minimally acceptable analytical as CVmin < 0.75 × CVI, where CVI is intra-individual variation. 16 All 3 analytical CVtotal met the minimum quality specification criterion CVmin, meaning that, at most, 25% variability is added to test result variability. Haptoglobin concentrations are reported to be increased up to 2- to 10-fold after stimulation.3,10,23,35 Therefore, in relation to the magnitude of increase in concentration, the analytical CVtotal of <12.75% are acceptable for clinical purposes if a future clinical decision threshold is higher than the upper limit of haptoglobin concentration in healthy cats. Furthermore, the results from the present study are comparable with imprecision performance of previously validated immunoassays measuring major APPs, which have demonstrated acceptable analytical performance for clinical applicability in cats5,14,21 and in other companion animals.18,26,27
For logistic reasons, the 4 duplicate measurements of the interassay study had to be performed in equal parts in 2 different laboratories. Therefore, different instruments were used as described above. The other conditions of measurements (protocol of measurements, conditions of use, and the test operator) were the same. Under these conditions, a high interassay CV could be caused by poor repeatability (e.g., high plate-to-plate variability) and/or by poor reproducibility because of different instruments in the 2 laboratories or because of preanalytical error in sample preparation. The influence of different instruments on the interassay CV could not be assessed, but it appeared to be negligible because no tendency of constantly higher or lower concentrations could be detected under one or the other conditions of measurements. A preanalytical error in sample preparation cannot be excluded, because serum samples were manually diluted 1:10,000 before each measurement. Further investigation needs to be performed to elucidate if interassay CV can be reduced when the same prediluted samples are used.
The preset performance goals for linearity and spike recovery were fulfilled, indicating satisfactory accuracy for clinical diagnostic purposes. The LOD of 0.19 g/L lies within the lower range of serum haptoglobin concentrations in healthy cats observed in previous studies using other methods.8,13,22,23 Therefore, the LOD demonstrates sufficient analytical sensitivity for clinical use.
As a last step of analytical validation, the ELISA was compared with a spectrophotometric assay that is a multispecies-specific assay already established for diagnostic use in cats.13,23,24,28 Its automated method has been validated independently in canine serum indicating good precision, accuracy, and sensitivity.11,31 A necessary condition of method comparison is repeatability of both methods, because poor repeatability of one method would result in poor agreement. 30 Repeatability of the ELISA was demonstrated in the imprecision study and was confirmed by acceptable results in the repeatability study according to Bland and Altman. To our knowledge, repeatability of the spectrophotometric assay has not been assessed for feline haptoglobin. Therefore, it was evaluated according to Bland and Altman. Acceptable repeatability was demonstrated when haptoglobin concentrations of the diluted samples were not back-transformed, thus confirming results of previous studies in dogs.11,31
The method comparison revealed a high positive correlation between the ELISA and the spectrophotometric assay, but Passing–Bablok regression as well as Bland–Altman difference plot exposed a systematic error between the methods. The Passing–Bablok regression equation revealed a proportional bias for all 39 samples and for the subgroup of undiluted samples (n = 25). The latter approach should be interpreted with caution given the small sample size and mainly as a result of the small range of concentrations (<2.5 g/L), because continuously distributed measurements is an assumption for the Passing–Bablok regression. 36 Taking that into consideration, it still can be concluded that, for the subgroup of undiluted samples, a bias between the methods exists, even if its nature (constant or proportional bias) cannot be deduced with certainty. In case of diluted samples, this bias can be amplified by back-transformation of haptoglobin concentrations. The modified Bland–Altman plot demonstrates acceptable statistical agreement between the methods on the one hand. On the other hand, the 2 limits of agreement (mean difference ± 1.96 × SD) were not included within the limits of TEdes or TEmin, thus indicating clinical disagreement. The absolute value of the bias of −38.9% did not meet the performance goals.
True bias—the difference between values measured with the ELISA and the “true” value of haptoglobin—could not be assessed in our study because of the lack of a gold standard method or definitive method. Comparing 2 field methods, bias is expected and comprised of analytical error of both methods. 12 The origin of the unacceptable bias between the methods was not determined in the present study and requires further investigation. The existence of an analytical error resulting from dilution of the samples in the spectrophotometric assay is still not completely examined. A previous study demonstrated a linear relationship between the haptoglobin concentration and the absorbance up to a concentration of 8 g/L. 11 In higher concentrations, the graph seems to deviate from the linear model. Future studies should assess if back-transformation by multiplying with the dilution factor is valid for samples with concentrations >8 g/L.
The clinical implications of the bias are the following: 1) the ELISA and the spectrophotometric assay cannot be used interchangeably (e.g., in monitoring of a patient); 2) method-specific reference intervals must be determined for the ELISA (in case of a proportional bias, a regression equation is preferred for adjustment); and 3) different clinical decision thresholds must be assessed because results are higher for the spectrophotometric assay. 12 In the second phase of validation, acceptable diagnostic performance was indicated by the significantly higher concentrations of haptoglobin (P < 0.005) measured in the group of cats with systemic inflammation. Based on haptoglobin concentrations measured in the ELISA, cats with marked acute phase reactions could be differentiated from healthy cats and diseased cats without systemic inflammation as already demonstrated in dogs.11,41 As expected, the observed increases were of lesser magnitude than others reported in positive major APPs, such as serum amyloid A in cats.14,39 However, measuring haptoglobin as a positive moderate APP together with a major APP is recommended to create APP profiles.
Further investigations will now be possible to assess biological variation of haptoglobin in cats to determine species-specific performance goals and to examine importance in clinical settings. The observed bias in the present study further emphasizes the need to develop species-specific standards for harmonization of assays for APPs in veterinary medicine. Although the ELISA is more time consuming than the spectrophotometric assay, its increased working range of up to 20 g/L appears advantageous especially if used in critically ill cats for diagnostic, prognostic, and monitoring purposes.
Footnotes
Acknowledgements
We thank the veterinarians and technicians at the Clinic of Small Animals and the Institute of Veterinary Biochemistry, Freie Universität Berlin, for their help and technical support during the evaluation of the assay. Additional thanks to the employees at the TECOdevelopment Laboratory, Rheinbach, Germany, for valuable input during and after the test validation.
Authors’ contributions
J Stiller contributed to conception and design of the study; contributed to acquisition, analysis, and interpretation of data; and drafted the manuscript. AK Jasensky contributed to conception of the study and contributed to analysis and interpretation of data. M Hennies contributed to conception and design of the study. R Einspanier contributed to conception of the study and contributed to interpretation of data. B Kohn contributed to conception of the study and contributed to acquisition and interpretation of data. All authors critically revised the manuscript; gave final approval; and agreed to be accountable for all aspects of the work in ensuring that questions relating to the accuracy or integrity of any part of the work are appropriately investigated and resolved.
a.
Sarstedt, Nümbrecht, Germany.
b.
TECO feline & canine haptoglobin ELISA, TECOmedical Group, Sissach, Switzerland.
c.
Laboratory A: Titramax 100, Heidolph Instruments GmbH & Co. KG, Schwabach, Germany; Laboratory B: IKA shaker MTS 4, IKA-Werke GmbH & Co. KG, Staufen, Germany.
d.
Laboratory A: EMax Plus microplate reader, Molecular Devices LLC, Sunnyvale, CA; Laboratory B: iMark microplate absorbance reader, Bio-Rad Laboratories Inc., Hercules, CA.
e.
Laboratory A: SoftMax Pro software, Molecular Devices LLC, Sunnyvale, CA; Laboratory B: Microplate Manager 6, Bio-Rad Laboratories Inc., Hercules, CA.
f.
Tridelta PHASE haptoglobin assay, Tridelta Development Ltd., Maynooth, Ireland.
g.
Excel 2010, Microsoft Corp., Redmond, WA.
h.
SPSS Statistics 20, IBM, Armonk, NY.
i.
MedCalc Statistical Software version 15.2.2, MedCalc Software bvba, Ostend, Belgium.
Declaration of conflicting interests
The author(s) declared the following potential conflicts of interest with respect to the research, authorship, and/or publication of this article: M Hennies is an employee of TECOdevelopment, Rheinbach, Germany, which manufactures the ELISA investigated in the present study. The study was performed independently. M Hennies did not influence or bias data acquisition, measurements, results, or manuscript preparation, nor did any of the authors have any financial or personal relationships that could inappropriately influence the study design.
Funding
The author(s) received no financial support for the research, authorship, and/or publication of this article.