
Abstract
The continued spread of white-nose syndrome and its impacts on hibernating bat populations across North America has prompted nationwide surveillance efforts and the need for high-throughput, noninvasive diagnostic tools. Quantitative real-time polymerase chain reaction (qPCR) analysis has been increasingly used for detection of the causative fungus, Pseudogymnoascus destructans, in both bat- and environment-associated samples and provides a tool for quantification of fungal DNA useful for research and monitoring purposes. However, precise quantification of nucleic acid from P. destructans is dependent on effective and standardized methods for extracting nucleic acid from various relevant sample types. We describe optimized methodologies for extracting fungal nucleic acids from sediment, guano, and swab-based samples using commercial kits together with a combination of chemical, enzymatic, and mechanical modifications. Additionally, we define modifications to a previously published intergenic spacer–based qPCR test for P. destructans to refine quantification capabilities of this assay.
Introduction
White-nose syndrome (WNS) continues to advance across North America and impact the health and conservation of bats that obligately hibernate as a winter survival strategy. This emergent disease, caused by the fungus Pseudogymnoascus destructans, is definitively diagnosed by histologic examination of glabrous skin to identify characteristic cupping erosions associated with epidermal invasion of fungal hyphae,6,9 a diagnosis that often requires analysis of a whole bat carcass. Since 2013, quantitative polymerase chain reaction (qPCR) analysis 10 of bat wing skin and swab samples has been increasingly utilized for pathogen detection and surveillance. Real-time PCR–based analysis of environmental substrates for P. destructans within bat roost sites has also been implemented to facilitate high-throughput pathogen detection in the absence of bats or to minimize disturbance to hibernating bats. 7
In addition to facilitating high-throughput and noninvasive pathogen surveillance, qPCR techniques lend themselves to quantification analyses. However, successful implementation of qPCR for accurate quantification of P. destructans requires optimized and standardized methods to lyse fungal cells and purify extracted DNA from proteins and other potential PCR inhibitors in the sample matrix. Depending on the fungal species, efficient and consistent lysis of fungal cell walls can require a combination of chemical, enzymatic, and mechanical methods.2,4,21 Extraction of fungal nucleic acid from environmental sample matrices such as soil presents additional challenges because of the presence of humic acid, fulvic acid, and other contaminants that can inhibit PCR amplification.14,19
We describe optimized methodologies for extraction of nucleic acid from P. destructans in multiple sample types. We additionally define modifications to the previously described intergenic spacer (IGS)-based qPCR assay 10 to yield an improved, high-throughput, and accurate assay for the detection and quantification of P. destructans in various sample matrices. Together, these methodologies and refinements offer an important advance for WNS surveillance and research efforts.
Materials and methods
Preparation of fungal conidia and genomic DNA standards
Pure cultures of P. destructans type isolate (American Type Culture Collection MYA-4855) were grown on Sabouraud dextrose agar supplemented with chloramphenicol and gentamycin at 7°C for up to 3 months. Conidia were harvested by flooding the plate with 2 mL phosphate buffered saline containing 0.5% polysorbate 20 a (PBST) and gently rubbing the surface of the colony with a sterile inoculating loop until conidia were suspended in the liquid. The liquid was then collected and centrifuged at 6,000 × g for 5 min. The pellet was resuspended in PBST and homogenized by transfer through a 20-g needle using a 3-mL syringe. Conidia were enumerated using a hemocytometer and suspended in PBST to create 400 µL of stock suspensions containing 106 conidia/mL. The final stock concentration was verified using a hemocytometer. Stock suspensions were stored frozen at −80°C. Individual stock suspensions were thawed on day-of-use and used to create 10-fold serial dilutions of 106–102 conidia/mL for spiked extraction experiments.
Fungal genomic DNA (gDNA) for standard curves was prepared from the P. destructans type isolate as described previously. 10 Individual aliquots of gDNA at a concentration of 65 ng/µL were thawed and diluted to 6.5 ng/µL using 1× Tris–EDTA buffer b (10 mM Tris, 1 mM ethylenediamine tetra-acetic acid, pH 8.0) to serve as stock suspensions. Ten-fold serial dilutions were created on day-of-use from a stock suspension, and the following amounts of template (5 µL per PCR reaction) were used for generating standard curves: 3.3 × 10⁶, 3.3 × 10⁴, 3.3 × 10², and 3.3 fg gDNA (3.3 fg was previously reported as the lowest quantity of gDNA reliably detected by the IGS qPCR assay 10 ). The remaining stock suspension was stored at 4°C and used to create additional standard curves for up to 2 weeks; standard curves remained consistent when gDNA was stored in this manner.
Preparation of test samples
Sediment from a WNS-free bat hibernaculum in Wisconsin was collected in August 2012 and stored at −80°C. To create test samples for sediment-extraction experiments, 250 mg aliquots of sediment were transferred into 2-mL microcentrifuge tubes. To prepare samples for swab-extraction experiments, polyester swabs c pre-moistened with 100 µL of sterile nuclease-free water were rolled in a sterile petri dish containing sediment. Each tube was then spiked with 100 µL of 10-fold serial dilutions of P. destructans conidia (containing 101–105 conidia per sample) suspended in PBST. Conidia dilutions were tested in triplicate, and a negative control, similarly prepared but without addition of conidia, was also included in each extraction set.
Extraction of total nucleic acids from sediment
Extraction of total nucleic acids from fungi in sediment samples was performed using kit 1, d which has been used previously for extracting P. destructans gDNA from sediment,7,16 and kit 2, e which according to the manufacturer has enhanced lysis capabilities. Kit 1 uses zirconium shards for homogenization whereas kit 2 uses glass beads. Both kits were used according to the manufacturer’s protocol (Table 1, kit 1.0 and kit 2.0) and with modifications (see also Table 1 and Supplementary Table 1 [available online at http://vdi.sagepub.com/content/by/supplemental-data]). For the manufacturer’s protocol, sediment samples spiked with conidia of P. destructans were transferred using a wide-bore 200-µL pipette tip to the kit bead tube (containing either 0.1-mm glass beads or zirconium shards) and mechanically disrupted for 45 sec at 4,000 rpm (setting of 6.5) using a homogenizer. f Nucleic acids were purified according to the kit protocol and promptly assayed by real-time PCR or frozen at −80°C pending PCR analysis.
Descriptions of the extraction protocols tested and the relative efficiencies of those protocols.*
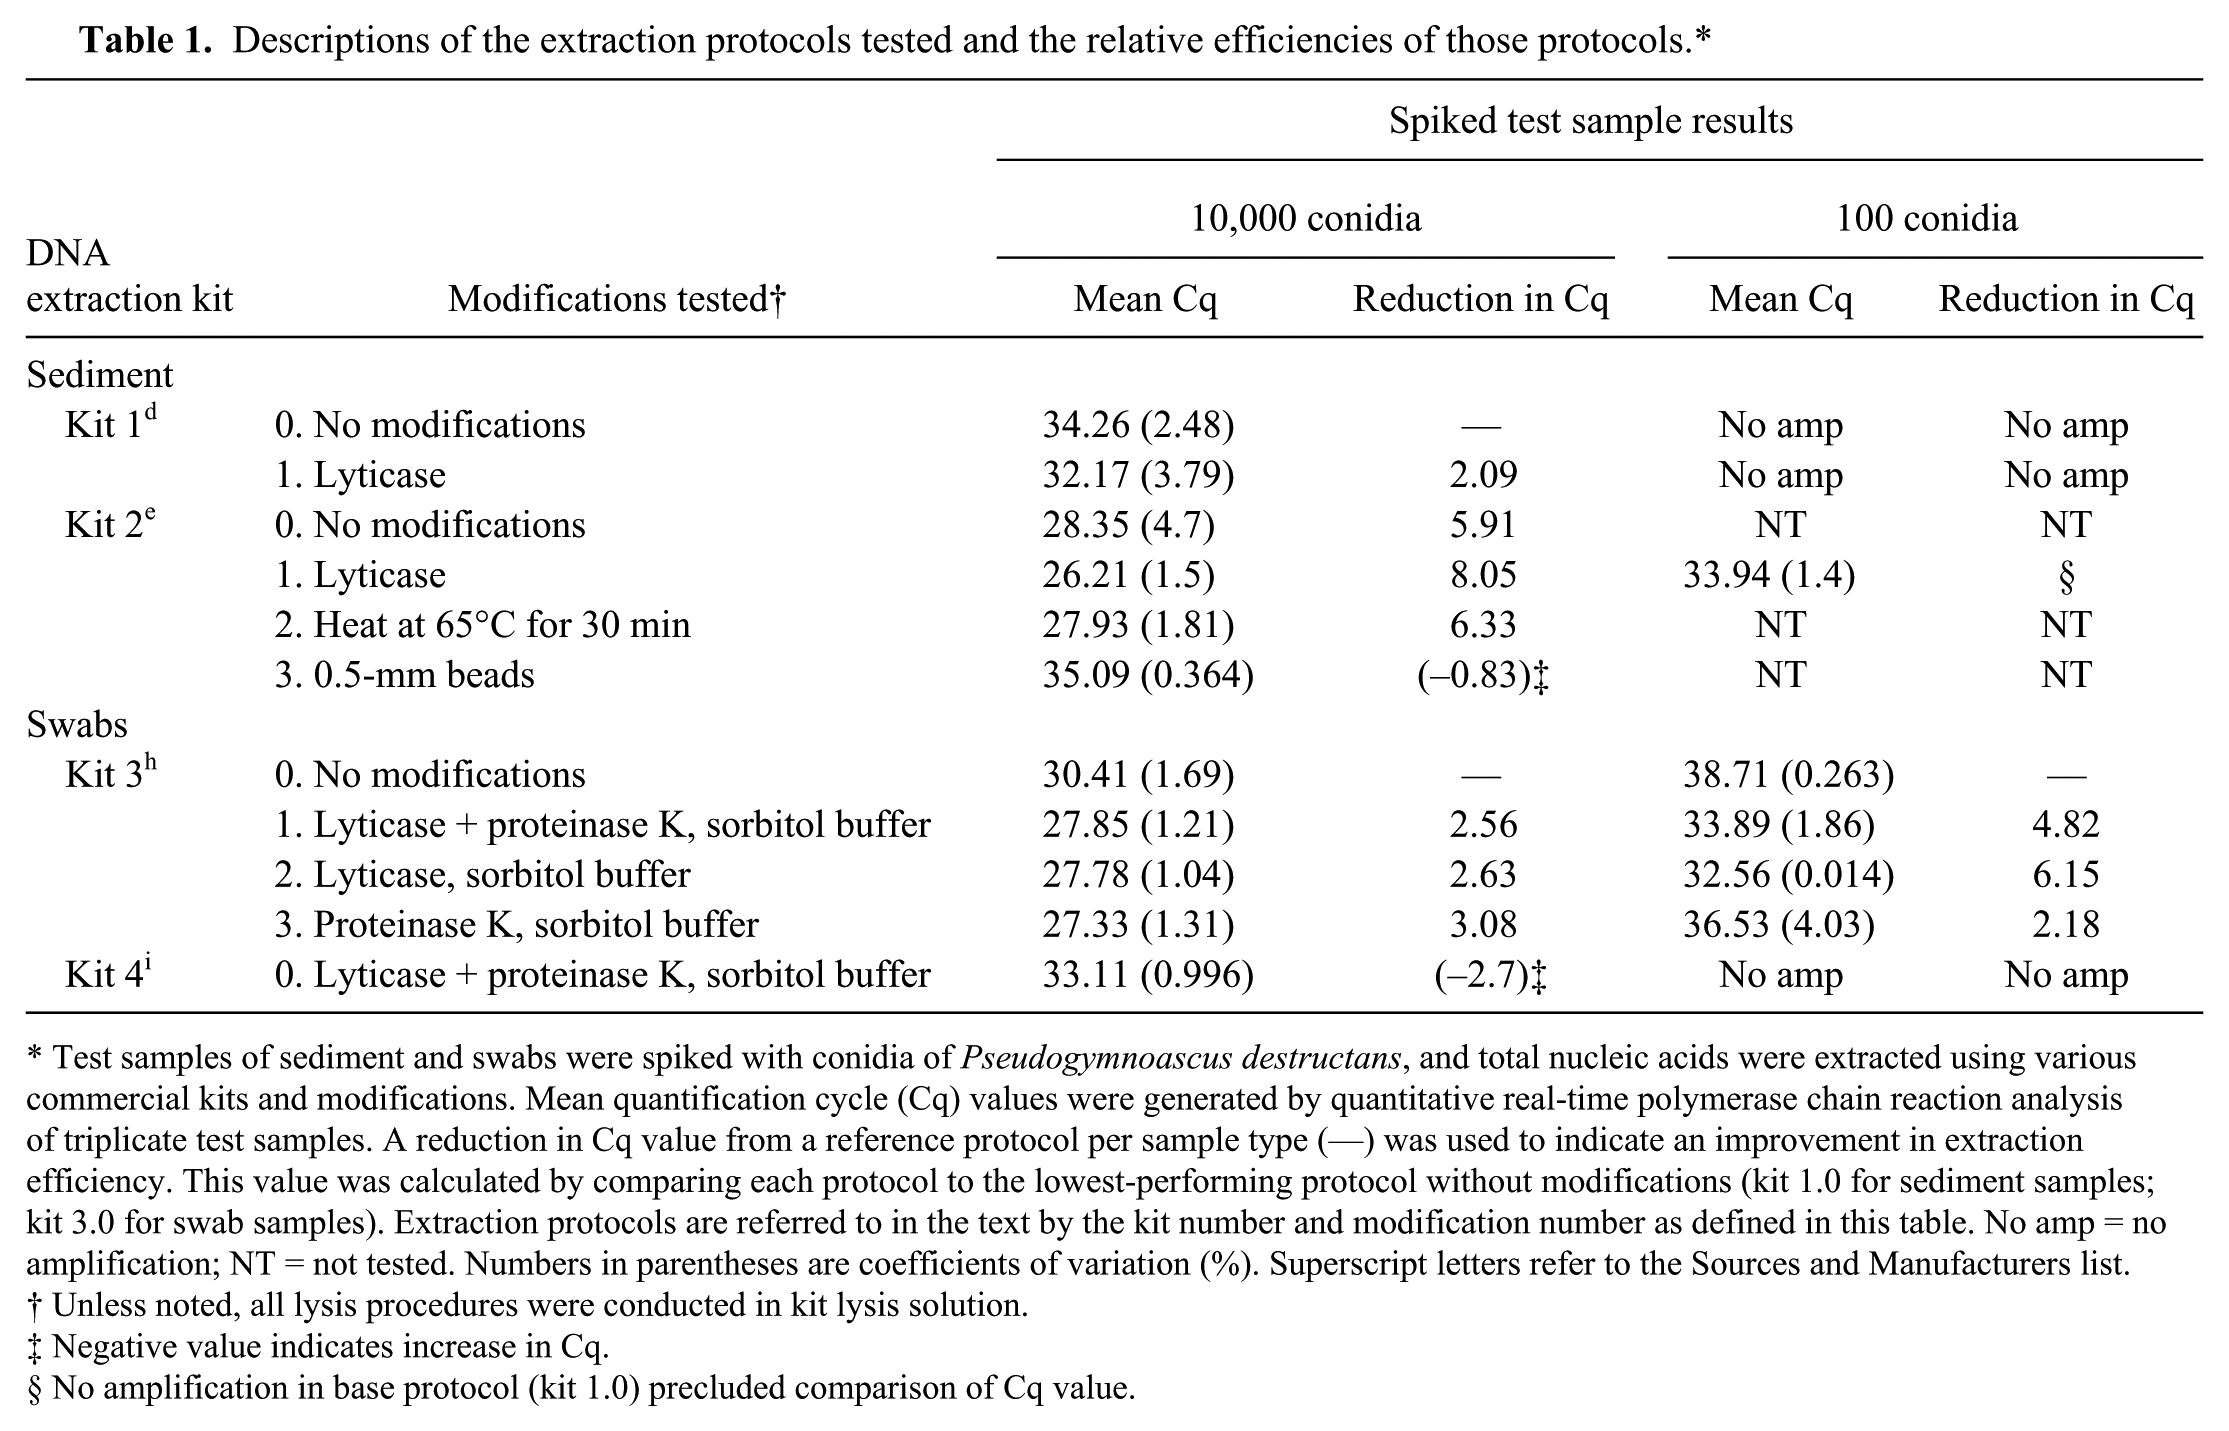
Test samples of sediment and swabs were spiked with conidia of Pseudogymnoascus destructans, and total nucleic acids were extracted using various commercial kits and modifications. Mean quantification cycle (Cq) values were generated by quantitative real-time polymerase chain reaction analysis of triplicate test samples. A reduction in Cq value from a reference protocol per sample type (—) was used to indicate an improvement in extraction efficiency. This value was calculated by comparing each protocol to the lowest-performing protocol without modifications (kit 1.0 for sediment samples; kit 3.0 for swab samples). Extraction protocols are referred to in the text by the kit number and modification number as defined in this table. No amp = no amplification; NT = not tested. Numbers in parentheses are coefficients of variation (%). Superscript letters refer to the Sources and Manufacturers list.
Unless noted, all lysis procedures were conducted in kit lysis solution.
Negative value indicates increase in Cq.
No amplification in base protocol (kit 1.0) precluded comparison of Cq value.
Modifications to these base protocols were tested following a stepwise approach as described below to determine the most efficient extraction method. First, kit 1 was modified with the addition of a lyticase digestion (kit 1.1) and compared with the manufacturer’s protocol (kit 1.0) using sediment samples spiked with 101–105 ten-fold serial dilutions of conidia of P. destructans. Subsequently, kit 2 was tested according to the manufacturer’s protocol and with modifications using sediment samples spiked with 104 conidia only. The most efficient method was then performed using the full dilution series to assess performance across a range of starting fungal quantities.
Kit 1.1. Sediment samples were suspended in kit lysis reagents with the addition of 300 U lyticase, g and samples were incubated in a heated shaker at 30°C and 85 rpm for 30 min. The suspensions were then transferred into kit 1 bead tubes for homogenization, and nucleic acids were purified according to the kit protocol.
Kit 2.1. Sediment samples were suspended in kit lysis reagents with the addition of 300 U lyticase, and samples were incubated in a heated shaker at 30°C and 85 rpm for 30 min. The suspensions were then transferred into kit 2 bead tubes for homogenization, and nucleic acids were purified according to the kit protocol.
Kit 2.2. Spiked sediment samples were suspended in the kit lysis reagents and heated to 65°C for 10 min. The suspensions were then transferred into kit 2 bead tubes for homogenization, and nucleic acids were purified according to the kit protocol.
Kit 2.3. The extraction was performed as per the manufacturer’s protocol except 0.5-mm glass beads were used for homogenization.
Extraction of total nucleic acids from swabs
Extractions of total nucleic acids from environmental swab samples spiked with 101–105 ten-fold serial dilutions of conidia of P. destructans were performed using kit 3 h and kit 4. i
Kit 3 included bead-based homogenization in a chemical lysis buffer followed by purification of nucleic acids using paramagnetic beads. For kit 4, the manufacturer’s supplementary protocol for purification of total DNA from yeast (Qiagen, 2006, Purification of total DNA from yeast using the DNeasy Blood & Tissue Kit (DY13 Aug-06), http://tinyurl.com/h8t3j2n) was used because it had previously been described for extraction of P. destructans DNA in various sample media. 16 This method adds enzymatic digestion steps with lyticase and proteinase K to the lysis phase of the extraction. Nucleic acids are then purified using silica-based filter columns.
Both kits were used according to the manufacturer’s protocol (Table 1, kit 3.0 and kit 4.0). In order to provide a direct comparison between the two kits, kit 3 was tested with equivalent enzymatic digestion steps (kit 3.1) as described in the supplementary protocol for kit 4. Based on this comparison, the best kit was then tested using each enzyme independently during lysis to determine the most efficient extraction method. A comparison of all methods tested is outlined in Table 1 and described further in Supplementary Table 1.
Kit 3.1. Spiked swab samples were incubated in 600 µL of sorbitol-based buffer (1 M sorbitol, 100 mM sodium EDTA) containing 200 U lyticase and 14 mM beta-mercaptoethanol g in a heated shaker at 30°C and 500 rpm for 30 min. The samples were then centrifuged at 300 × g for 10 min, and the supernatant was discarded. The pellet was re-suspended in 416 µL of lysis solution, prepared using 232 µL of kit lysis solution, j 3 µL of kit nucleic acid carrier solution, k 175 µL of 1× PBS, and 7 µL of proteinase K, g and incubated in a heated shaker at 56°C and 500 rpm overnight. The samples were mixed at high speed on a vortexer l (setting of 7) for 20 sec. The suspension was then transferred to a bead tube provided with the kit for homogenization, and the swab was discarded.
Kit 3.2. Spiked swab samples were incubated in 600 µL of sorbitol-based buffer (1 M sorbitol, 100 mM sodium EDTA) containing 200 U lyticase and 14 mM beta-mercaptoethanol in a heated shaker at 30°C and 500 rpm for 30 min. The samples were then centrifuged at 300 × g for 10 min, and the supernatant was discarded. The pellet was re-suspended in 416 µL of lysis solution, prepared using 232 µL of kit lysis solution, 3 µL of kit nucleic acid carrier solution, and 175 µL of 1× PBS, by vortexing at high speed (setting of 7) for 20 sec. The suspension was then transferred to a bead tube provided with the kit for homogenization, and the swab was discarded.
Kit 3.3. Spiked swab samples were incubated in 416 µL of lysis solution, prepared using 232 µL of kit lysis solution, 3 µL of kit nucleic acid carrier solution, 175 µL of 1× PBS, and 7 µL of proteinase K, in a heated shaker at 56°C and 500 rpm overnight. After vortexing at high speed (setting of 7) for 20 sec, the suspension was transferred to a bead tube provided with the kit for homogenization, and the swab was discarded.
Following enzymatic digestion, all samples tested using kit 3 were homogenized using an adapter m affixed to the vortexer and processed at high speed (setting of 7) for 15 min. Homogenates were then either frozen in the tubes at −80°C for subsequent extraction the following day or immediately transferred to the 96-well processing plate for DNA extraction according to the manufacturer’s protocol. Purified nucleic acids were either immediately used as template for real-time PCR or frozen at −80°C pending PCR analysis.
Optimization of qPCR
Real-time PCR was performed as previously described. 10 All reactions were conducted using a PCR system n and a commercial master mix. o Each 25-µL reaction contained 12.5 µL of 2× master mix, 0.5 µL of 50× reference dye solution, 0.5 µL of each 20 µM PCR primer solution, 0.25 µl of 20 µM dual-labeled BHQ probe, 0.02 µL (20 µg/µL) of bovine serum albumin g to reduce PCR inhibition, and 5 µL of template gDNA. Duplicate standard curves, prepared with 100-fold dilutions of P. destructans gDNA ranging from 3.3 × 10⁶ to 3.3 fg, were included on each reaction plate. The lowest standard (3.3 fg) was run in triplicate to account for higher variability caused by low amounts of template. A no-template control was also included on each 96-well reaction plate. The quantification cycle (Cq) value for each sample was determined by the cycle number at which the fluorescence crossed the threshold and is inversely proportional to the starting quantity of target nucleic acid in the sample. For standardization across reactions, master mixes, and sample types, the threshold for Cq determination was set at percentage of maximum fluorescence (% of ΔRnmax) of the standard curve after automatic baseline correction. Any reaction that crossed this threshold within 40 cycles and that exhibited an exponential amplification curve was considered positive.
To determine the optimal percent of maximum fluorescence threshold value for the IGS-based qPCR assay, amplification efficiencies were calculated for each sample well based on the average slope of the logarithmic amplification curve over all unique sets of 5 sequential cycles (e.g., 1–5, 2–6, etc.) up to 40 cycles. Efficiency calculations were performed as previously described 11 except that the slope was consistently evaluated over 5 cycles, rather than a varying number of cycles defined by a 10-fold amplification range. Based on initial comparisons of efficiencies along each sample amplification curve, the optimal percent of maximum fluorescence was determined and compared to 10% ΔRnmax. These calculations were completed using reactions from the optimal protocols for each sample type. The threshold value (set as a percent of maximum fluorescence) that produced amplification efficiencies averaged across all samples closest to 100% was then applied across all reactions to standardize the data for comparison.
Statistical analyses
Efficiencies of nucleic acid extraction methodologies for P. destructans in each sample type were compared based on Cq values following qPCR amplification of serially spiked test samples. Mean Cq and coefficient of variation (CV) were calculated for each nucleic acid quantity per sample type and extraction method. Differences in Cq values within and between extraction methods per sample type were tested for statistical significance using one-way repeated-measures analysis of variance (ANOVA).
Amplification consistencies of P. destructans gDNA dilutions used in standard curves were assessed by comparing the mean and CV of Cq values from replicate dilutions of gDNA within and between reactions. Standard curves from the 18 qPCR reactions used to generate data for our study were evaluated. Differences in Cq values were tested using one-way repeated-measures ANOVA. Standard curves for each reaction were estimated by simple linear regression of Cq values of gDNA standards versus the initial log quantity of gDNA in the template ranging from 3.3 × 10⁶ to 3.3 fg. The mean linear regression coefficient (r2), slope, and y-intercept for replicate curves included in each reaction were estimated, and the amplification efficiency of the reaction (E) was calculated from the mean slope based on the equation E = (101/slope – 1) × 100. Standard curve parameters for each reaction (r2, slope, y-intercept, and efficiency) were used to assess assay performance and were compared using one-way ANOVA to test for differences between reactions.
Initial amounts of P. destructans gDNA template (fg) for each qPCR reaction were quantified using the mean standard curve included with that reaction series (i.e., on the same 96-well plate). The Cq values determined at a threshold of 4% of ΔRnmax were converted to DNA quantities by the equation DNA (fg) = 10α + β(Cq), where α = y-intercept and β = slope of the standard curve. Means and CVs of DNA quantities were calculated for each sample dilution per sample type.
Results
Nucleic acid extraction
Highest extraction efficiencies for P. destructans gDNA in all sample matrices were achieved using commercially available kits modified to include a combination of chemical, enzymatic, and mechanical lysis methods (Table 1; kit 2 for sediment, kit 3 for swabs). Kit 2, which homogenizes samples using glass beads in a cell lysis solution, was more efficient at extracting P. destructans gDNA from sediment samples than kit 1, which uses zirconium shards for homogenization (Table 2). Kit 3, which homogenizes samples using zirconium beads in a cell lysis solution followed by capture of nucleic acids on paramagnetic beads, was more efficient at extracting P. destructans gDNA from environmental swab samples than kit 4; kit 4 uses silica filter columns for purification of nucleic acids and does not include mechanical lysis (Table 3).
Comparison of quantification cycle (Cq) values produced by different nucleic acid extraction methods for Pseudogymnoascus destructans in sediment.*
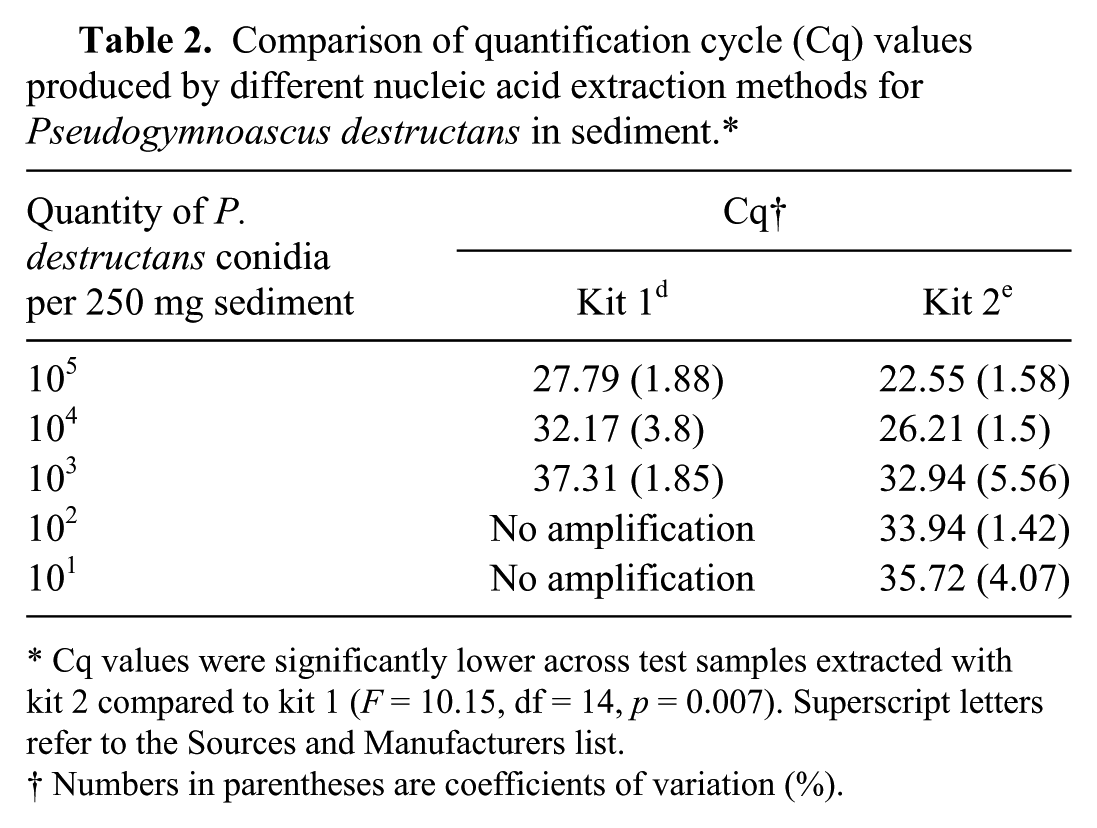
Cq values were significantly lower across test samples extracted with kit 2 compared to kit 1 (F = 10.15, df = 14, p = 0.007). Superscript letters refer to the Sources and Manufacturers list.
Numbers in parentheses are coefficients of variation (%).
Comparison of quantification cycle (Cq) values produced by different nucleic acid extraction methods for Pseudogymnoascus destructans on environmental swab samples.*
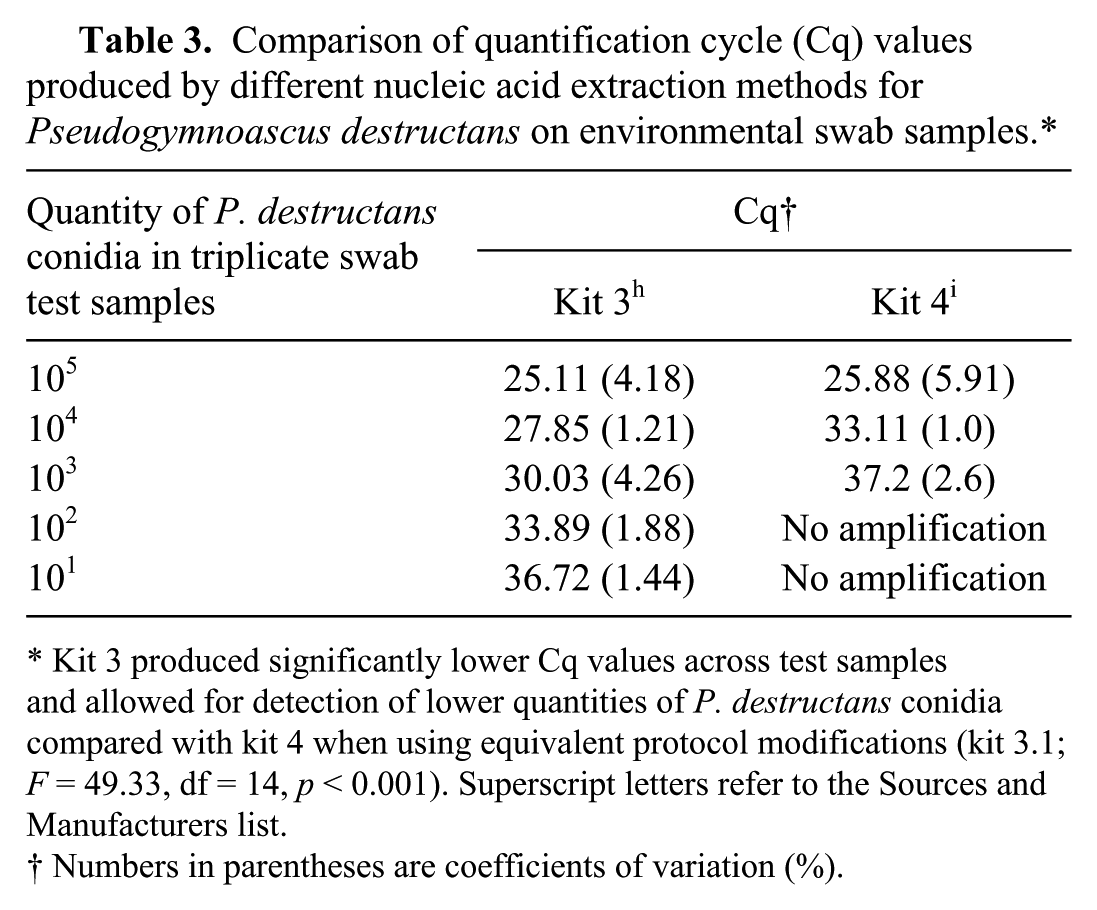
Kit 3 produced significantly lower Cq values across test samples and allowed for detection of lower quantities of P. destructans conidia compared with kit 4 when using equivalent protocol modifications (kit 3.1; F = 49.33, df = 14, p < 0.001). Superscript letters refer to the Sources and Manufacturers list.
Numbers in parentheses are coefficients of variation (%).
For extraction of P. destructans gDNA from sediment, the addition of lyticase digestion in lysis buffer prior to bead homogenization (Table 1; kit 1.1, kit 2.1) reduced Cq values by 2–8 cycles compared with standard kit protocols (Table 1; kit 1.0, kit 2.0, kit 2.3). Kit 2 had higher extraction efficiencies compared to kit 1 based on lower Cq values produced from nucleic acid templates of serially spiked sediment samples (Table 2). The lowest quantity of conidia reliably extracted from sediment and detected by the qPCR assay was 10 conidia using kit 2 with the addition of lyticase (Table 1; kit 2.1); this was substantially lower than the detection limit of 1,000 conidia using kit 1 with lyticase (Table 1; kit 1.1). Differences in Cq values between the extraction kits for samples in which P. destructans gDNA was detected were significant (F = 10.15, df = 14, p = 0.007).
For extraction of P. destructans gDNA from environmental swabs, the addition of enzymatic digestions with lyticase and/or proteinase K prior to bead homogenization using kit 3 (Table 1; kit 3.1, kit 3.2, kit 3.3) improved extraction efficiencies as indicated by lower Cq values compared to the standard kit protocol (Table 1; kit 3.0). All modified protocols for kit 3 had higher extraction efficiencies and sensitivities than kit 4 (Table 1; kit 4.0). When comparing the 2 kits with equivalent enzymatic digestions (kit 3.1 and kit 4.0), Cq values for the kit 3.1 protocol were significantly lower relative to the kit 4.0 protocol across all sample quantities for which gDNA amplification occurred (Table 3; F = 49.33, df = 14, p < 0.001). Kit 3.1 was also more sensitive compared to kit 4.0, with the ability to detect gDNA of P. destructans in samples spiked with 10 conidia; kit 4.0 had a minimum detection limit of 1,000 conidia (Table 3). Enzymatic digestion with lyticase alone (kit 3.2) was equivalent to proteinase K digestion alone (kit 3.3; F = 0.168, df = 18, p = 0.687) or both enzymes in series (kit 3.1; F = 0.123, df = 22, p = 0.729). This suggests that the overnight digestion step with proteinase K may be eliminated from the final protocol for time and cost savings.
PCR performance and reproducibility
A threshold of 4% of ΔRnmax was selected for determining Cq values because, at this threshold, amplification efficiencies across all reactions evaluated using the optimal protocols by sample type were closer to the ideal target of 100% (86 ± 9% for kit 2.1; 74 ± 12% for kit 3.1). In contrast, amplification efficiencies at a threshold of 10% of ΔRnmax (61 ± 7% for kit 2.1; 63 ± 10% for kit 3.1) had declined from peak efficiencies and were thus no longer representative of exponential amplification as necessary for accurately determining starting template quantities (Supplementary Table 2 available online at http://vdi.sagepub.com/content/by/supplemental-data).
As demonstrated previously, 10 the qPCR assay reliably detected 3.3 × 10⁶ to 3.3 fg of P. destructans gDNA. Dilutions of 33 ag were also detected, but with less accuracy and consistency, so this dilution was not included for quantification. The CV of Cq values produced by replicate standard dilutions within a reaction were low, ranging from 0.02% to 5.4%. Across reactions (n = 18), average CV values were also low (2.0–3.7%) indicating good intra- and interassay reproducibility. Differences in Cq values produced from replicate standard dilutions were compared between and within qPCR reactions and were all nonsignificant at α = 0.05 for all dilutions (one-way repeated-measures ANOVA, df = 35; 106, p = 0.695; 104, p = 0.286; 102 = 0.831; 100 = 0.781) indicating consistent amplification across reactions.
A standard curve was created for each reaction by regressing Cq values of replicate DNA standards on the initial log quantity of gDNA. A linear regression coefficient (r2), slope, and y-intercept were estimated for each reaction (n = 18), and the slope was used to calculate the amplification efficiency of that reaction (Table 4). All standard curve parameters (r2, slope, y-intercept, and efficiency) were within acceptable ranges, 5 and there were no significant differences between reactions (one-way ANOVA, df = 16; r2, p = 0.517; slope, p = 0.955; y-intercept, p = 0.776; efficiency, p = 0.932) indicating consistency in assay performance. A mean standard curve was calculated to demonstrate this reproducibility and low variation across reactions (Fig. 1).
Standard curve parameters.*
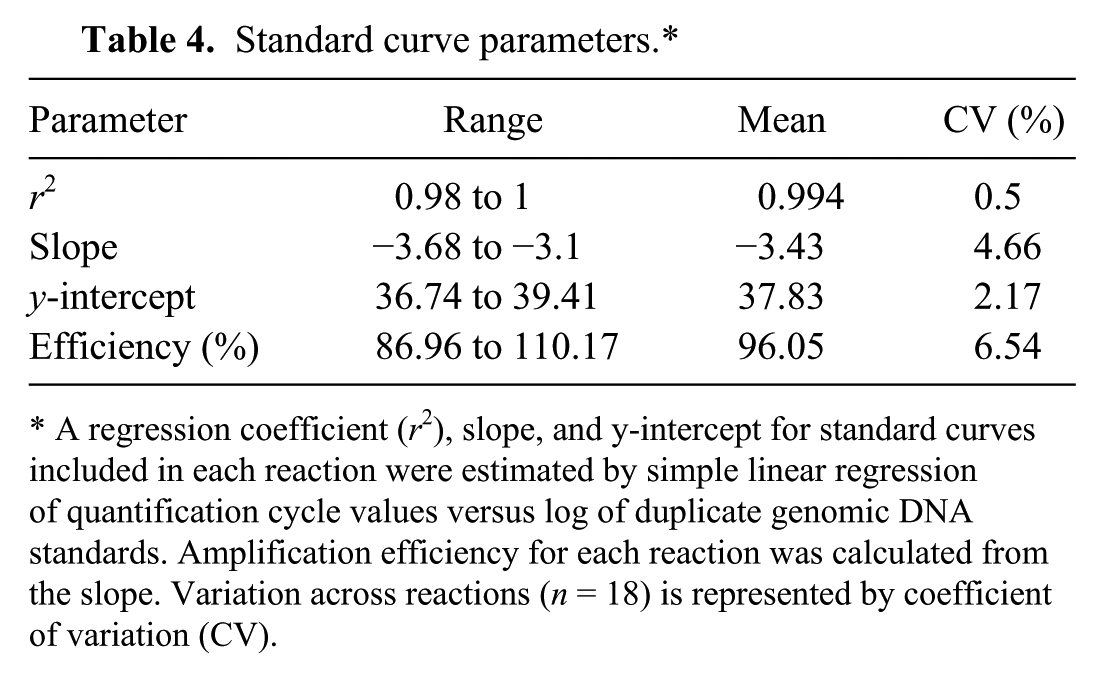
A regression coefficient (r2), slope, and y-intercept for standard curves included in each reaction were estimated by simple linear regression of quantification cycle values versus log of duplicate genomic DNA standards. Amplification efficiency for each reaction was calculated from the slope. Variation across reactions (n = 18) is represented by coefficient of variation (CV).
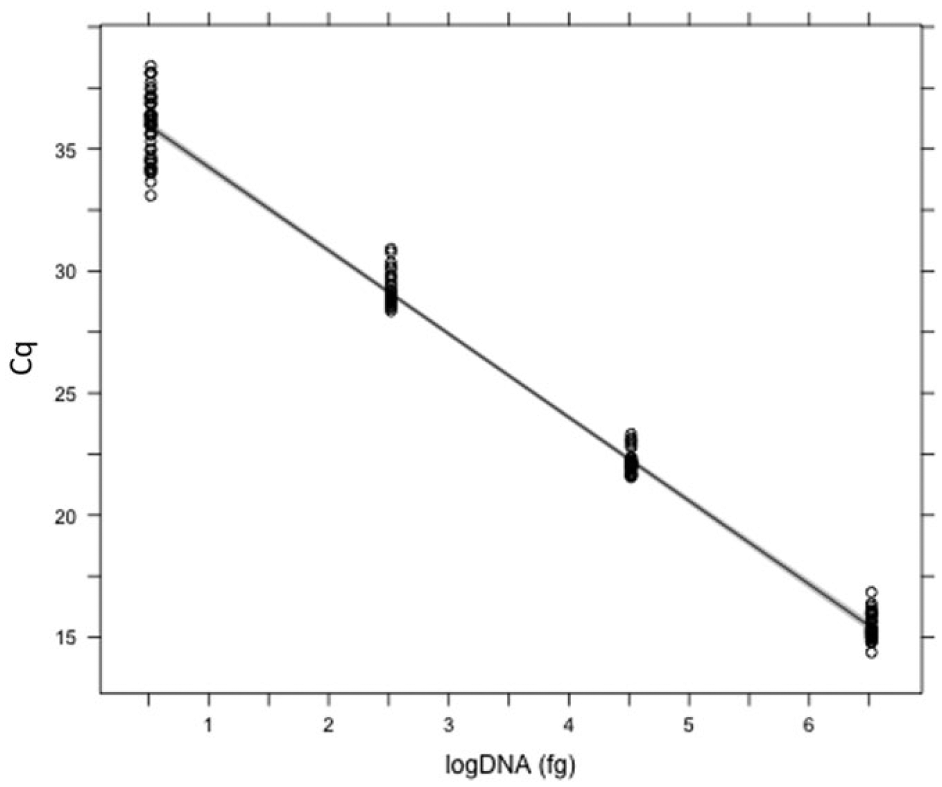
Standard curve. The average standard curve (line) and standard error (shaded bounds) demonstrate the performance and reproducibility of this assay across reactions (n = 18). Mean quantification cycle (Cq) values of genomic DNA standards used to create the standard curve for each reaction are shown (points).
PCR quantification
Absolute quantities of initial gDNA template in extracted test samples using the kit 2.1 protocol for sediment and the kit 3.1 protocol for swabs were determined by comparison to standard curves included on the reaction plate. Ranges of gDNA detected from test samples containing initial quantities of 10–105 conidia were ~4–26,000 fg for sediment samples and 1–5,000 fg for environmental swab samples (Table 5). The average CV of Cq values from triplicate extracted test samples within a reaction were low for all sample types, ranging from 1.2% to 5.6%. Conversion of individual Cq values to fg gDNA using standard curves introduced variation, increasing the CV within triplicates (range: 25–120%) as consistent with conversion from a logarithmic scale. Overall, lower mean Cq values indicated higher gDNA quantities in extracted sediment samples than in swab samples spiked with equivalent conidial suspensions. However, there was larger variation among replicates (high CV of Cq values) of spiked sediment samples, suggesting more variable extraction efficiencies compared with swab samples. Differences between sample types were not statistically evaluated due to the potential for confounding effects associated with different sample matrices and extraction methods. 17
Quantification of genomic DNA (gDNA) template in nucleic acid extractions of test samples spiked with conidia of Pseudogymnoascus destructans.*
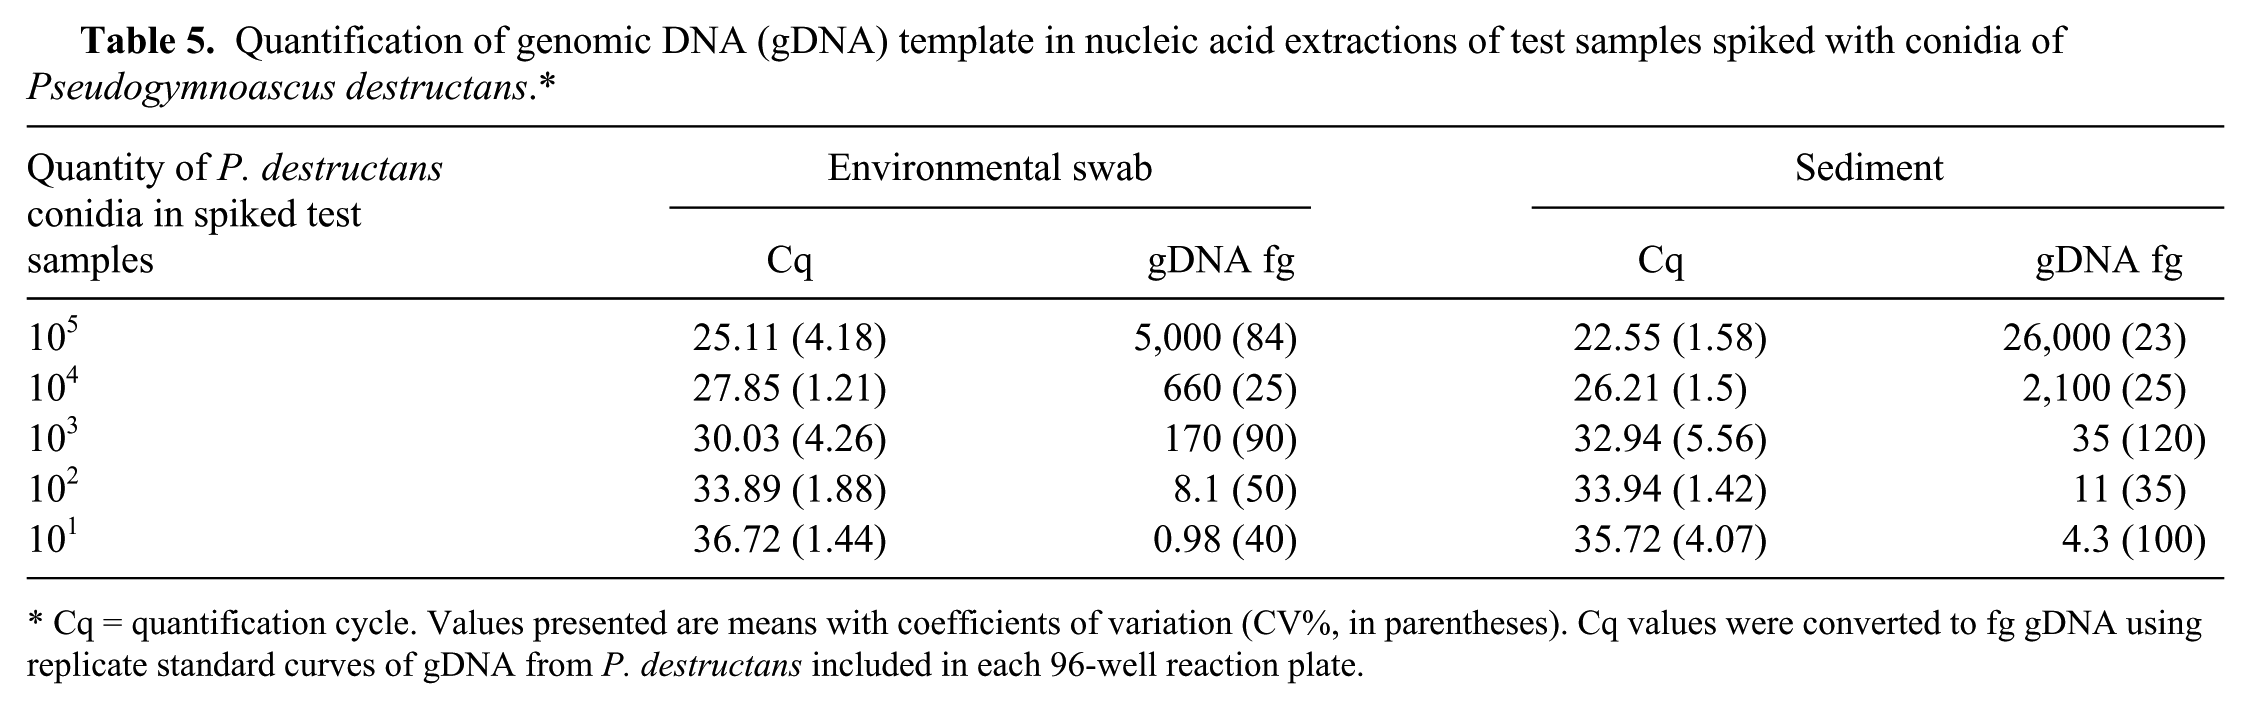
Cq = quantification cycle. Values presented are means with coefficients of variation (CV%, in parentheses). Cq values were converted to fg gDNA using replicate standard curves of gDNA from P. destructans included in each 96-well reaction plate.
Discussion
Real-time PCR techniques such as the IGS assay 10 have great utility for supporting nonlethal WNS surveillance and disease research. However, accurate and reliable quantification using qPCR requires efficient and consistent methods of nucleic acid extraction from multiple sample types.8,18 In this study, we describe extraction and purification methods for total nucleic acids from P. destructans in environmental samples that are efficient and scalable for applications that require high-throughput and quantification analyses.
Optimal lysis of fungal cell walls was accomplished using a combination of chemical, enzymatic, and mechanical methods. Cell lysis was improved over standard kit protocols when enzyme(s) were added prior to bead-based homogenization in cell lysis solution. An incubation step with lyticase was added for spiked sediment samples, and 2 incubation steps with lyticase and proteinase K were added for spiked swab samples. Subsequent purification of nucleic acids was achieved using silica-based spin columns (kit 2) for sediment samples and paramagnetic beads (kit 3) for swab samples. These methods reliably produced high-quality DNA suitable for qPCR analysis.
Our work demonstrated that setting the threshold of 4% of maximum fluorescence (ΔRnmax) for Cq determinations, rather than at 10% of ΔRnmax as previously reported,1,10 improved the accuracy of quantification. A 4% threshold more consistently captured the exponential phase of the reaction where amplification efficiencies were closest to 100%. Calculation of starting template based on proportional increases in fluorescence of the reaction assumes a doubling of DNA template with every cycle. This only occurs during exponential amplification when reagents are freely available and amplification efficiency is near 100% (Life Technologies, 2011, Real-time PCR: understanding Ct, http://tinyurl.com/hs7qwmy). Thus, while the 10% maximum fluorescence threshold may be suitable for qualitative applications, accurate quantification relies on the Cq value determined at a threshold above baseline representative of this exponential reaction phase, which we estimated at 4% of ΔRnmax.
The sensitivity of the IGS-based qPCR for detection of P. destructans gDNA has been demonstrated to be as low as 3.3 fg when using pure template. 11 When present in complex sample matrices, we have demonstrated a combined sensitivity of extraction and qPCR as low as 10 conidia on a swab or in 250 mg of sediment. The Cq values of these samples ranged from ~34 to 37, which is equivalent to ~14 to 1 fg gDNA, respectively, based on absolute quantification using standard curves of serially diluted DNA standards. This lower limit represents ~0.42 to 0.03 genome equivalents 10 ; a level of sensitivity that is possible because IGS is a multicopy gene. 3 Additionally, this assessment is based on North American isolates of P. destructans, which as clones of one another are likely to have equivalent copy numbers of IGS.12,13 In regions where genetic diversity, including variation in IGS copy number, of P. destructans is higher (i.e., Europe), quantification techniques may require further validation. 5
Although smaller quantities of conidia were not tested, 3.3 fg gDNA likely represents the lowest quantity that can be reliably detected in samples following extraction and qPCR analysis given the sensitivity and standard curve limitations of the assay. At these lower limits, low quantities of gDNA template can produce variable amplification results in replicates due to the allocation of template copies following a Poisson distribution, where some samples will receive multiple copies and some will receive none. Thus, large sample sizes or multiple replicates are necessary to confidently determine presence or absence of gDNA from P. destructans in a sampled population or area. In addition, interpretation of qPCR results from samples with low quantities of gDNA (Cq >36 or <3.3 fg) must take into account the potential for false negatives or for possible amplification of contaminating nucleic acid template unintentionally introduced during sample processing.
Standard curves produced by this assay were highly reproducible both within and between reactions, making them suitable measures for quantification comparisons. The average CV of Cq values from standard dilutions across reactions were low (<4%), which is consistent with previous reports for qPCR standards. 15 Intra-assay variability in Cq values from triplicate spiked test samples was similarly low, but conversion of Cq values to fg gDNA using the standard curves introduced additional variation. This effect has been reported previously in other molecular assays and results from small differences in Cq values or standard curves being amplified by the logarithmic nature of the reaction curve.16,20 Given the high reproducibility of standard curves and consistency in qPCR protocols used in our experiments, the variation we observed most likely reflects differences in nucleic acid quantities extracted from test samples due to inherently variable allocation of conidia through serial dilutions and pipette transfers. The presence of PCR inhibitors in DNA templates can also affect amplification of target DNA template, especially in environmental sample matrices. 19 However, because all samples contained equivalent amounts of sediment from the same source, the potential for amplification differences due to variable PCR inhibitors is less likely.
Quantification of fungal nucleic acid is highly useful for research applications and for the assessment of management strategies for WNS aimed at pathogen reduction. The methods described herein are applicable for monitoring loads of P. destructans on bats or in environmental reservoirs, and comparison of qPCR results to a standard curve of gDNA from P. destructans allows for absolute quantification of gDNA from the fungus. However, caution must be taken in comparing quantification results produced using different extraction techniques, assays, personnel, and laboratories as all of these factors can influence template variability and assay performance. 17 The standardized methodologies described are designed to address these challenges and provide valuable tools for pathogen surveillance, research, and evaluation of adaptive management in support of national WNS response efforts.
Footnotes
Acknowledgements
We thank K. Drees and J. Foster (University of New Hampshire) for consultation and discussion of extraction and PCR methods.
Authors’ note
ML Verant and EA Bohuski contributed equally to this study.
Authors’ contributions
ML Verant contributed to conception and design of the study; contributed to acquisition, analysis, and interpretation of data; and drafted the manuscript. EA Bohuski contributed to conception and design of the study, and contributed to acquisition, analysis, and interpretation of data. JM Lorch and DS Blehert contributed to conception and design of the study, and contributed to interpretation of data. All authors critically revised the manuscript; gave final approval; and agreed to be accountable for all aspects of the work in ensuring that questions relating to the accuracy or integrity of any part of the work are appropriately investigated and resolved.
a.
Tween 20, Sigma-Aldrich, St. Louis, MO.
b.
Fisher Scientific, Pittsburgh, PA.
c.
Dacron swabs, Puritan, Guilford, ME.
d.
Kit 1; PowerSoil DNA isolation kit, Mo Bio Laboratories Inc., Carlsbad, CA.
e.
Kit 2; Powerlyzer PowerSoil DNA isolation kit, Mo Bio Laboratories Inc., Carlsbad, CA.
f.
FastPrep, Precellys, Bertin Technologies, Siège, France.
g.
Sigma-Aldrich, St. Louis, MO.
h.
Kit 3; MagMax total nucleic acid isolation kit, Life Technologies Inc., Madison, WI.
i.
Kit 4; DNeasy blood and tissue kit, Qiagen GmbH, Hilden, Germany.
j.
MagMax lysis/binding solution concentrate buffer, Life Technologies Inc., Madison, WI.
k.
Carrier NA, MagMax total nucleic acid isolation kit; Life Technologies Inc., Madison, WI.
l.
Daigger Vortex Genie 2, Scientific Industries Inc., Bohemia, NY.
m.
Mo Bio Vortex adapter, Mo Bio Laboratories Inc., Carlsbad, CA.
n.
ABI 7500 Fast real-time, Applied Biosystems, Foster City, CA.
o.
Quantifast probe PCR + ROX vial kit, Life Technologies Inc., Madison, WI.
Declaration of conflicting interests
The author(s) declared no potential conflicts of interest with respect to the research, authorship, and/or publication of this article.
Funding
The author(s) disclosed receipt of the following financial support for the research, authorship, and/or publication of this article: This project was funded by the U.S. Fish and Wildlife Service (agreement 4500036150) and the U.S. Geological Survey through a research work order with the University of Wisconsin–Madison. Use of trade, product, or firm names is for descriptive purposes only and does not imply endorsement by the U.S. Government.