
Abstract
Culture of Mycobacterium avium subsp. paratuberculosis (MAP) from feces has been considered the gold standard for the diagnosis of paratuberculosis for many years. However, direct fecal polymerase chain reaction (PCR) is becoming more widely used, demonstrating similar sensitivity and specificity to culture. To ensure efficient and reproducible PCR results from a difficult sample matrix such as feces, there are many obstacles that a DNA extraction method must overcome, including the presence of inhibitors and the thick waxy cell wall of MAP. In the current study, 6 commercial DNA extraction kits were evaluated using fecal samples from naturally infected cattle shedding various amounts of MAP. Upon extraction, DNA purity and yield were measured, and real-time PCR was performed for detection of the insertion sequence (IS)900 and ISMAP02 targets. The kits evaluated showed significant differences in the purity and yield of DNA obtained. The best results were observed with kits E and A, having identified 94% (16/17) and 76% (13/17) of the positive samples by IS900 PCR, respectively. Both of these kits utilized bead beating in a lysis solution for cell disruption, followed by spin column technology (kit E) or magnetic bead–based technology (kit A) for nucleic acid isolation and purification. Two kits (A and F) demonstrated improved performance when used in conjunction with the respective manufacturer’s PCR test. The present study demonstrates the importance of choosing the correct methodology for the most accurate diagnosis of paratuberculosis through fecal PCR.
Keywords
Introduction
Paratuberculosis (Johne’s disease) is a chronic enteric progressive disease, characterized clinically by chronic or intermittent diarrhea, emaciation, and death. The disease has worldwide distribution and economic impact on ruminant livestock production. 17 The 2007 National Animal Health Monitoring System demonstrated the presence of Mycobacterium avium subsp. paratuberculosis (MAP) infection in 68.1% of U.S. dairy farms, further highlighting the importance of this disease (USDA-APHIS, Veterinary Services, Centers for Epidemiology and Animal Health: 2008, Johne’s disease on US dairies, 1991–2007. Available at: http://www.aphis.usda.gov/animal_health/nahms/dairy/downloads/dairy07/Dairy07_is_Johnes.pdf). Economic loss due to Johne’s disease in dairy cattle is mainly due to reduced milk production, reduced production life, and higher incidence of infertility and mastitis.7,12 The impact of paratuberculosis on production in other ruminants such as beef cattle, sheep, and goats is not as well defined in the United States but remains a concern for the livestock industry. 16
The diagnosis of paratuberculosis is hampered by several factors. The slow progression of the disease, with intermittent and low shedding of MAP in feces by subclinical animals, makes isolation of the organism difficult. In addition, a predominant cellular immune response in the early stages of the disease lowers the sensitivity of serologic diagnostic assays.15,17,18 Therefore, feces are considered to be one of the most important materials for the diagnosis of paratuberculosis because it is possible to identify subclinical and clinical animals by the shedding of MAP.
While the gold standard for the diagnosis of Johne’s disease is fecal culture, this method is labor intensive and can take up to 16 weeks. 3 Polymerase chain reaction (PCR) has gained popularity for the diagnosis of paratuberculosis, with sensitivity and specificity comparable to fecal culture.1,5 The main advantage of PCR is a reduction in time needed to perform the assay, averaging around 3 days, thereby providing a more rapid response when screening animals. However, according to the U.S. Department of Agriculture National Veterinary Services Laboratories (NVSL) fecal proficiency panel results, the performance of laboratories using direct PCR varies considerably (USDA-APHIS, NVSL: 2010, 2010 Johne’s disease fecal proficiency panel: general summary. Available at: http://www.aphis.usda.gov/animal_health/lab_info_services/downloads/PTReport2010Johnes.pdf). A critical step in any direct PCR is the extraction method, but with a matrix such as feces and an organism such as MAP, efficient extraction is particularly challenging. Reasons for this include the presence of inhibitors in the feces and a thick waxy MAP cell wall that makes the extraction of DNA difficult. Inhibitors present in feces include phytic acid and polysaccharides that can lead to false-negative results by inhibiting the amplification of DNA in PCR.10,14,20 Another cause for reduced sensitivity and increased false-negative results is the inadequate cell lysis of MAP, due to the characteristics of the MAP cell wall. 11 The objective of the current study was to evaluate the ability of 6 different commercial fecal DNA extraction kits to extract DNA from MAP present in feces.
Materials and methods
Samples and kits tested
Six commercial fecal DNA extraction kits were evaluated in the present study: kit A, a kit B, b kit C, c kit D, d kit E, e and kit F. f The manufacturers’ protocol was used for each kit, and any recommendations for application to hard-to-lyse organisms were incorporated. Any additional modifications by the authors’ laboratory are noted in the individual kit summaries that follow. Preliminary extractions were performed with a panel of 10 fecal samples obtained from cows housed at the National Animal Disease Center (Ames, Iowa) to allow familiarization with each kit, adapt protocols (if needed), and standardize results for consistency throughout the study. The preliminary panel consisted of samples from animals shedding high and low amounts of MAP as well as noninfected control cows. After consistent results were confirmed with each kit by analysis of DNA yield and purity, extractions were performed on a more rigorous panel of samples. The second panel consisted of a set of 25 samples obtained from the NVSL (Ames, IA) and was composed of 7 negative samples obtained from known negative cows, 10 samples from high shedders (>100 colony forming units [CFU] per media tube), 1 sample from a moderate shedder (10–100 CFU per media tube), and 7 samples from low shedders (<10 CFU per media tube). These samples were selected and blinded by NVSL. All samples in the panel had previously been evaluated by NVSL, classified according to their shedding status, and most had been included in the 2008–2010 proficiency test panels that were used for certification of diagnostic laboratories for culture and PCR detection of MAP. Six sample sets were prepared by subdividing each of the 25 samples to provide replicate samples of each within each kit. The subdivided samples were randomly given a test number (1–50) so that all samples were unknown throughout the testing process. By replicating each sample, the sample-to-sample variation of the extraction procedure within each kit could be analyzed. The 6 sample kits containing 50 samples each were placed in separate containers and stored at −70°C until extracted. The sample code was revealed and results were tabulated after completion of all extractions and PCR evaluation.
Extraction kit protocols and modifications for each kit
Kit A a employed mechanical disruption of cells with bead beating and DNA binding to paramagnetic beads. Briefly, 1 ml of phosphate buffered saline was added to 300 mg of feces; the mixture was vortexed and then centrifuged. The supernatant was then added to a tube containing zirconia beads and a lysis-binding solution. Following bead-beating disruption for 15 min using a vortex g with a multitube adapter h at maximum speed, the lysate was clarified by centrifugation and added to a plate along with isopropanol, magnetic nucleic acid–binding beads, and binding-lysis enhancer. Binding, washing, and elution of the DNA were performed on an automated system i yielding DNA in a 90-µl elution volume.
For kit B, b modifications were incorporated to better adapt the kit to fecal samples, as performed in the Human Microbiome Project (McInnes P, Cutting M: 2010, Manual of procedures for Human Microbiome Project: core microbiome sampling, protocol A, HMP protocol no. 07-001, version 11.0. Available at: http://www.hmpdacc.org/doc/sops_2/manual_of_procedures_v11.pdf). These alterations included heating the sample for 10 min at 65°C, then for 10 min at 95°C, and increasing the centrifugation time after incubation at 4°C from 1 min to 2 min. The volume of the sample suggested in the protocol is 250 mg. However, this was increased to 300 mg for ease of use. Briefly, the procedure consisted of heating the sample with the aforementioned conditions, followed by bead beating the sample in a lysis solution to disrupt cells. Bead beating was performed using a vortex g with a multitube adapter h for 10 min at full speed. After centrifugation, the supernatant was transferred to another tube and incubated at 4°C with a solution to precipitate potential inhibitors. The precipitated material was then pelleted by centrifugation, and the supernatant was transferred to a spin filter containing a silica membrane. Finally, the bound DNA was washed and eluted in a 100-µl volume.
Kit C c provided an option of increasing the amount of feces in the extraction protocol to improve recovery for targets that may not be distributed homogeneously throughout the fecal sample or may be present in low numbers. Therefore, the sample size was adjusted to 1 g. The protocol consisted of adding 1 g of sample to 10 ml of buffer and vortexing the sample vigorously for 1 min or until homogenization was achieved. Next, 2 ml of sample was transferred to another tube and heated at 95°C in buffer. After centrifugation, 1.2 ml of supernatant was added to a tube containing a tablet to absorb inhibitors present in feces. After incubation for 1 min, the sample was centrifuged, and the supernatant was transferred to another tube and incubated with proteinase K at 70°C for 10 min. This was followed by the addition of ethanol and then transfer of the sample to a spin column, followed by elution of DNA in a 200-µl volume.
Kit D d used a chemical process and heat for cell lysis. Briefly, 50 mg of feces was added to a DNA extraction buffer with proteinase K and then incubated for 10 min at 37°C with shaking. Following this, a lysis buffer was added, and the sample was incubated at 65°C for 10 min. A protein precipitation solution was then added, and the sample was incubated for 8 min on ice. The resulting supernatant was then transferred to a spin column with an inhibitor removal resin. After centrifugation, a DNA precipitation solution was added to the eluent, and the sample was incubated at room temperature and then centrifuged. The pellet was washed 2 times and then resuspended in TE (10 mM of Tris–HCl [pH 7.5], 1 mM of ethylenediamine tetra-acetic acid) buffer. Due to low yields of DNA in the preliminary evaluation of this kit, samples were resuspended in 100 µl of TE buffer instead of 300 µl as suggested by the protocol.
Kit E e utilized bead beating for physical lysis to extract the DNA. The protocol consisted of bead-beating 150 mg of fecal sample in lysis solution for 5 min at maximum speed using a vortex g with a multitube adaptor. h The lysed sample was centrifuged, and the supernatant was then added to a spin filter. After centrifugation, binding buffer was added to the filtrate, and the suspension was transferred to another spin column. Using centrifugation, DNA prewash and fecal DNA wash buffers were added to the spin column to clean the bound DNA. The final step of the protocol, after eluting the DNA in 100 µl, was filtration through a spin column into a new tube.
Kit F f was used with the option given in the supplied protocol of using 2 g of sample for maximum sensitivity. Briefly, this protocol consisted of rocking 2 g of feces in 35 ml of DNase-free water for 30 min in a conical tube, followed by 30-min incubation without shaking at room temperature. Twenty milliliters of supernatant was transferred to a new tube and centrifuged. The pellet at the bottom of the tube was resuspended with 1 ml of TE and added to a bead-beating tube. After bead beating for 5 min with a bead beater, j the supernatant of the lysed sample was then mixed with a precipitation buffer and pelleted by centrifugation. DNA binding buffer and 100% ethanol were mixed with the pellet, and the sample was added to a spin column in a collection tube to perform 2 washes and elute the DNA in a 50-µl volume.
A spectrophotometer k was used to measure the purity and yield of nucleic acids. Each extracted sample was analyzed at 2 wavelengths (260 nm and 280 nm). The samples were also subjected to DNA quantification by fluorescence using the PicoGreen assay. l
PCR analysis
Polymerase chain reaction was performed on all extracted samples to detect 2 MAP-specific target genes, insertion sequence (IS)900 and ISMAP02. The IS900 sequence was amplified based upon a method previously described. 9 Real-time PCR was performed on a sequence detection system m as follows: 1 cycle at 50°C for 1 min and 95°C for 10 min, followed by 40 cycles of denaturation at 94°C for 25 sec and annealing-extension at 60°C for 1 min. The total reaction volume was 25 µl, with 5 µl of sample, 12.5 µl of master mix, n 6.88 µl of ultrapure distilled water (DNase- and RNase-free), 200 nM of each primer, and 100 nM of probe. The primer sequences used were 5′-CCGCTAATTGAGAGAT GCGATTGG-3′ for the forward primer, and 5′-AATCAA CTCCAGCAGCGCGGCCTCG-3′ for the reverse primer. The fluorescent probe sequence was 5′-FAM-TCCACGC CCGCCCAGACAGG-TAMRA-3′. Each individual sample was run in duplicate. A sample was considered positive if both of the duplicate samples had a threshold cycle (Ct) value below 40.
For the detection of the ISMAP02 sequence, a nested PCR procedure was performed as previously described. 19 The first reaction was performed by conventional PCR and consisted of 1 cycle at 94°C for 5 min and 20 cycles at 94°C for 45 sec, 58°C for 1 min, and 72°C for 2 min, and a final extension cycle at 72°C for 7 min. The initial amplification was performed with the primer sequences 5′-GCACGGTTTT TCGGATAACGAG-3 (forward primer) and 5′-TCAACT GCGTCACGGTGTCCT G-3′ (reverse primer). The reaction master mix was composed of ultrapure distilled water (DNase- and RNase-free), buffer, o 2.5 mM of MgCl2, 0.25 mM of deoxyribonucleotide triphosphates, 0.3 µM of primers, and 2 U of DNA polymerase. p The second amplification reaction was performed with real-time PCR using 1 µl of amplicon from the first reaction. The sequences of the nested primers and probe were 5′-GGATAACGAGACCGTGG ATGC-3′ (forward primer), 5′-AACCGACGCCGCCAA TACG-3′ (reverse primer), and 5′-FAM-CAACCCGCACG CTG-TAMRA-3′ (probe). The reaction volume was 25 µl, with 1.25 µl of each primer and probe, 12.5 µl of master mix, n and 7.75 µl of ultrapure distilled water (DNase- and RNase-free). The reaction began with 1 cycle of 50°C for 1 min and 95°C for 10 min, and consisted of 40 cycles of denaturation at 95°C for 15 sec and annealing-extension at 60°C for 1 min. A sample was considered positive if both of the duplicate samples had a Ct value below 40.
In addition, 2 other PCR tests were also performed on samples extracted with selected kits. The manufacturer’s protocol for DNA extraction using kit F suggests using a PCR kit provided by the same company, herein designated as PCR kit F. q The manufacturer of kit A also commercializes PCR reagents for the detection of MAP (reagents herein designated as PCR kit A r ) so this PCR test was performed on the extracted samples of kit A. The purpose of using the commercial PCR reagents was to gain more information on the sensitivity of these 2 extraction methods when used with the PCR reagents recommended by the manufacturers. However, these commercial PCR kits were only used for the company’s respective DNA extraction kits and were not used for comparison across all DNA extraction kits tested in the current study, as not all manufacturers sell PCR reagents for the specific amplification of MAP DNA.
Statistical analysis
Data was analyzed by one-way analysis of variance. s When significant effects (P < 0.05) due to kit were detected, means separation was conducted by Tukey–Kramer honestly significant difference test. For each sample tested, the coefficient of variation (CV) among both replicate samples on PCR results (Ct) was calculated.
Results
Table 1 details the method of cell lysis, the volume of feces used, the average DNA yield after extraction, the average estimated DNA concentration, and the estimated purity of DNA for each of the 6 commercial kits. Significant differences were observed between the commercial kits when comparing these parameters. The sample size used for extraction of MAP DNA from feces was highly variable, ranging from 50 mg to 2,000 mg for kits D and F, respectively. The average estimated DNA yield varied from 23 ng to 520 ng per 100 mg of sample (Table 1). The 260 nm/280 nm absorbance ratio was used to estimate the purity of the extracted DNA, with ratios approaching 1.8–2.0 considered the highest quality DNA. In the present study, kits A and F resulted in the best ratios (P < 0.05; 2.26 and 2.03, respectively) compared to the other kits. Interestingly, kit E recorded the lowest DNA purity (ratio of 1.05), yet one of the highest yields.
Comparison of DNA extraction kits for method of cell lysis, quantity of sample used, average DNA yield, average estimated DNA concentration obtained, and average estimated DNA purity.*
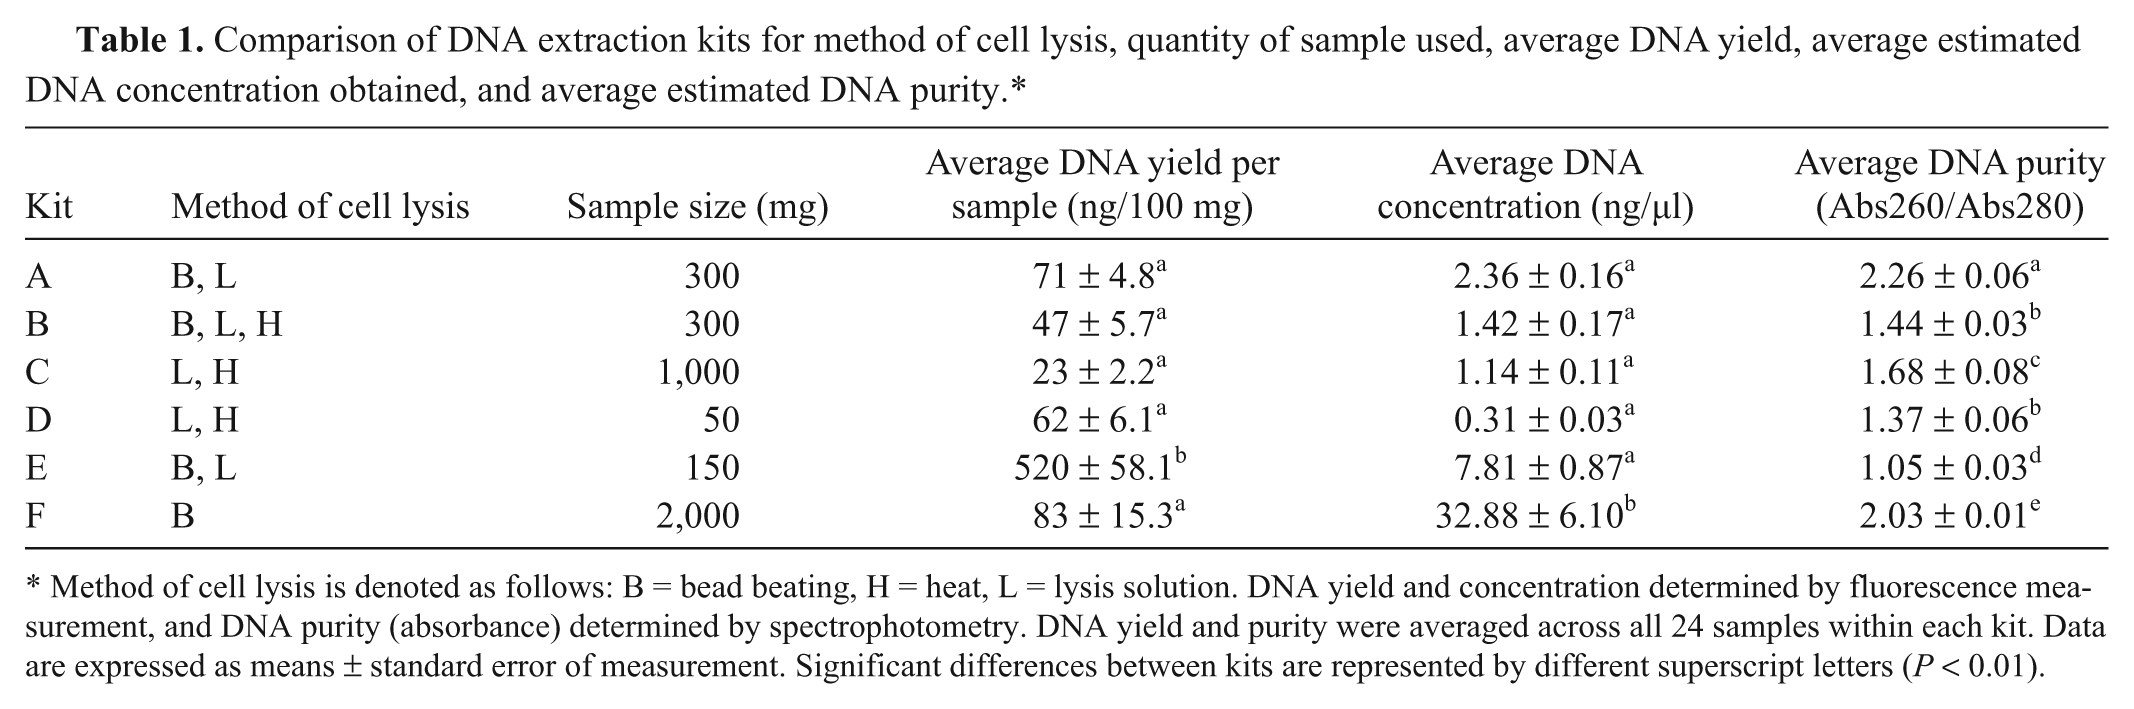
Method of cell lysis is denoted as follows: B = bead beating, H = heat, L = lysis solution. DNA yield and concentration determined by fluorescence measurement, and DNA purity (absorbance) determined by spectrophotometry. DNA yield and purity were averaged across all 24 samples within each kit. Data are expressed as means ± standard error of measurement. Significant differences between kits are represented by different superscript letters (P < 0.01).
The performance of each of the 6 commercial extraction kits in the correct identification of positive and negative fecal samples using IS900 and ISMAP02 PCR is shown in Table 2. There was marked variability among the kits used and the ability to identify positive samples upon PCR, with sensitivities ranging from 17.6% with kit D to 94.1% with kit E. The kit that performed the best overall was kit E, which detected 16 of 17 known positive samples for a sensitivity of 94.1% by IS900 PCR. Kit A followed with a sensitivity of 76.5% (13/17 positive samples). The sensitivity of detection of ISMAP02 target gene was similar to IS900 for kits A, C, and D (Table 2). However, detection of positive fecal samples was lower (P < 0.05) for kits B and E using ISMAP02 PCR. Interestingly, ISMAP02 PCR detected more (P < 0.01) positive fecal samples than IS900 PCR when samples were extracted with kit F. The specificity was extremely high across the 6 extraction kits, with all negative samples correctly identified using IS900 PCR, regardless of extraction kit used. The specificity was relatively high with the ISMAP02 PCR target as well, but false-positive reactions were obtained for 2 negative samples extracted with kit A and 1 negative fecal sample extracted with kit C.
Identification of positive and negative Mycobacterium avium subsp. paratuberculosis DNA fecal samples using insertion sequence (IS)900 and ISMAP02 polymerase chain reaction (PCR) after extraction with 6 commercial kits.*
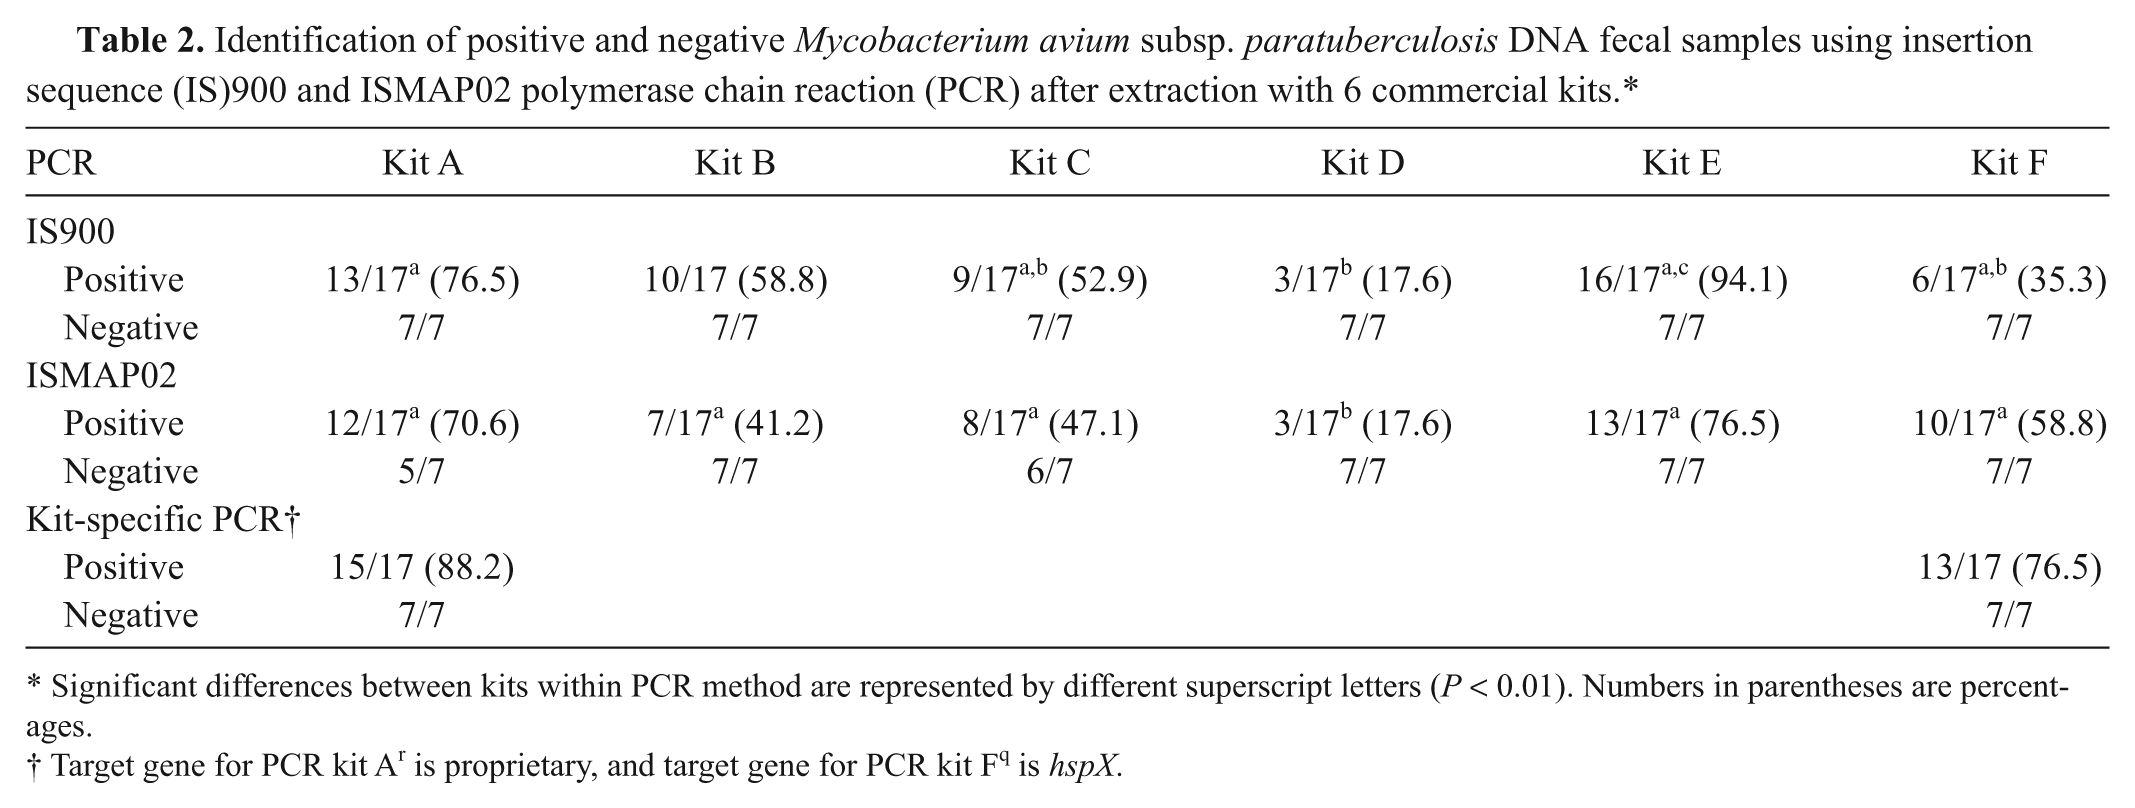
Significant differences between kits within PCR method are represented by different superscript letters (P < 0.01). Numbers in parentheses are percentages.
The average Ct values for IS900 PCR results obtained for the fecal panel after DNA extraction using the 6 commercial kits is demonstrated in Table 3. Average Ct values were significantly (P < 0.01) lower for samples extracted with kits A and E compared to the other kits. Results for sample replicates in the panel were averaged, and the CV is displayed in parentheses. The panel was composed of 7 low shedders (<10 CFU per media tube), 1 moderate shedder (10–100 CFU per media tube), 9 high shedders (>100 CFU per media tube), and 7 negative samples. One heavy shedder sample was excluded because it was found to be a bison strain as determined by IS1311 restriction endonuclease assay. For the most part, reproducibility across sample replicates was very high, suggesting the methods will yield comparable efficiency within a sample set. Although the lowest CV shown is 0.01, many samples actually had a CV value much less than that, as designated by an asterisk within the table. Kit F had the highest CV for the sample replicates in this panel, whereas all other extraction kits performed similarly. IS900 PCR was more reproducible than ISMAP02 PCR and thus was the primary reaction used to compare the kits. Average Ct values for ISMAP02 PCR results were significantly (P < 0.05) lower when compared to IS900 results within each kit; however, CV values between replicate samples were more variable than for IS900 PCR results (data not shown).
Mean threshold cycle values for insertion sequence (IS)900 polymerase chain reaction on fecal DNA extracted with 6 commercial kits.*
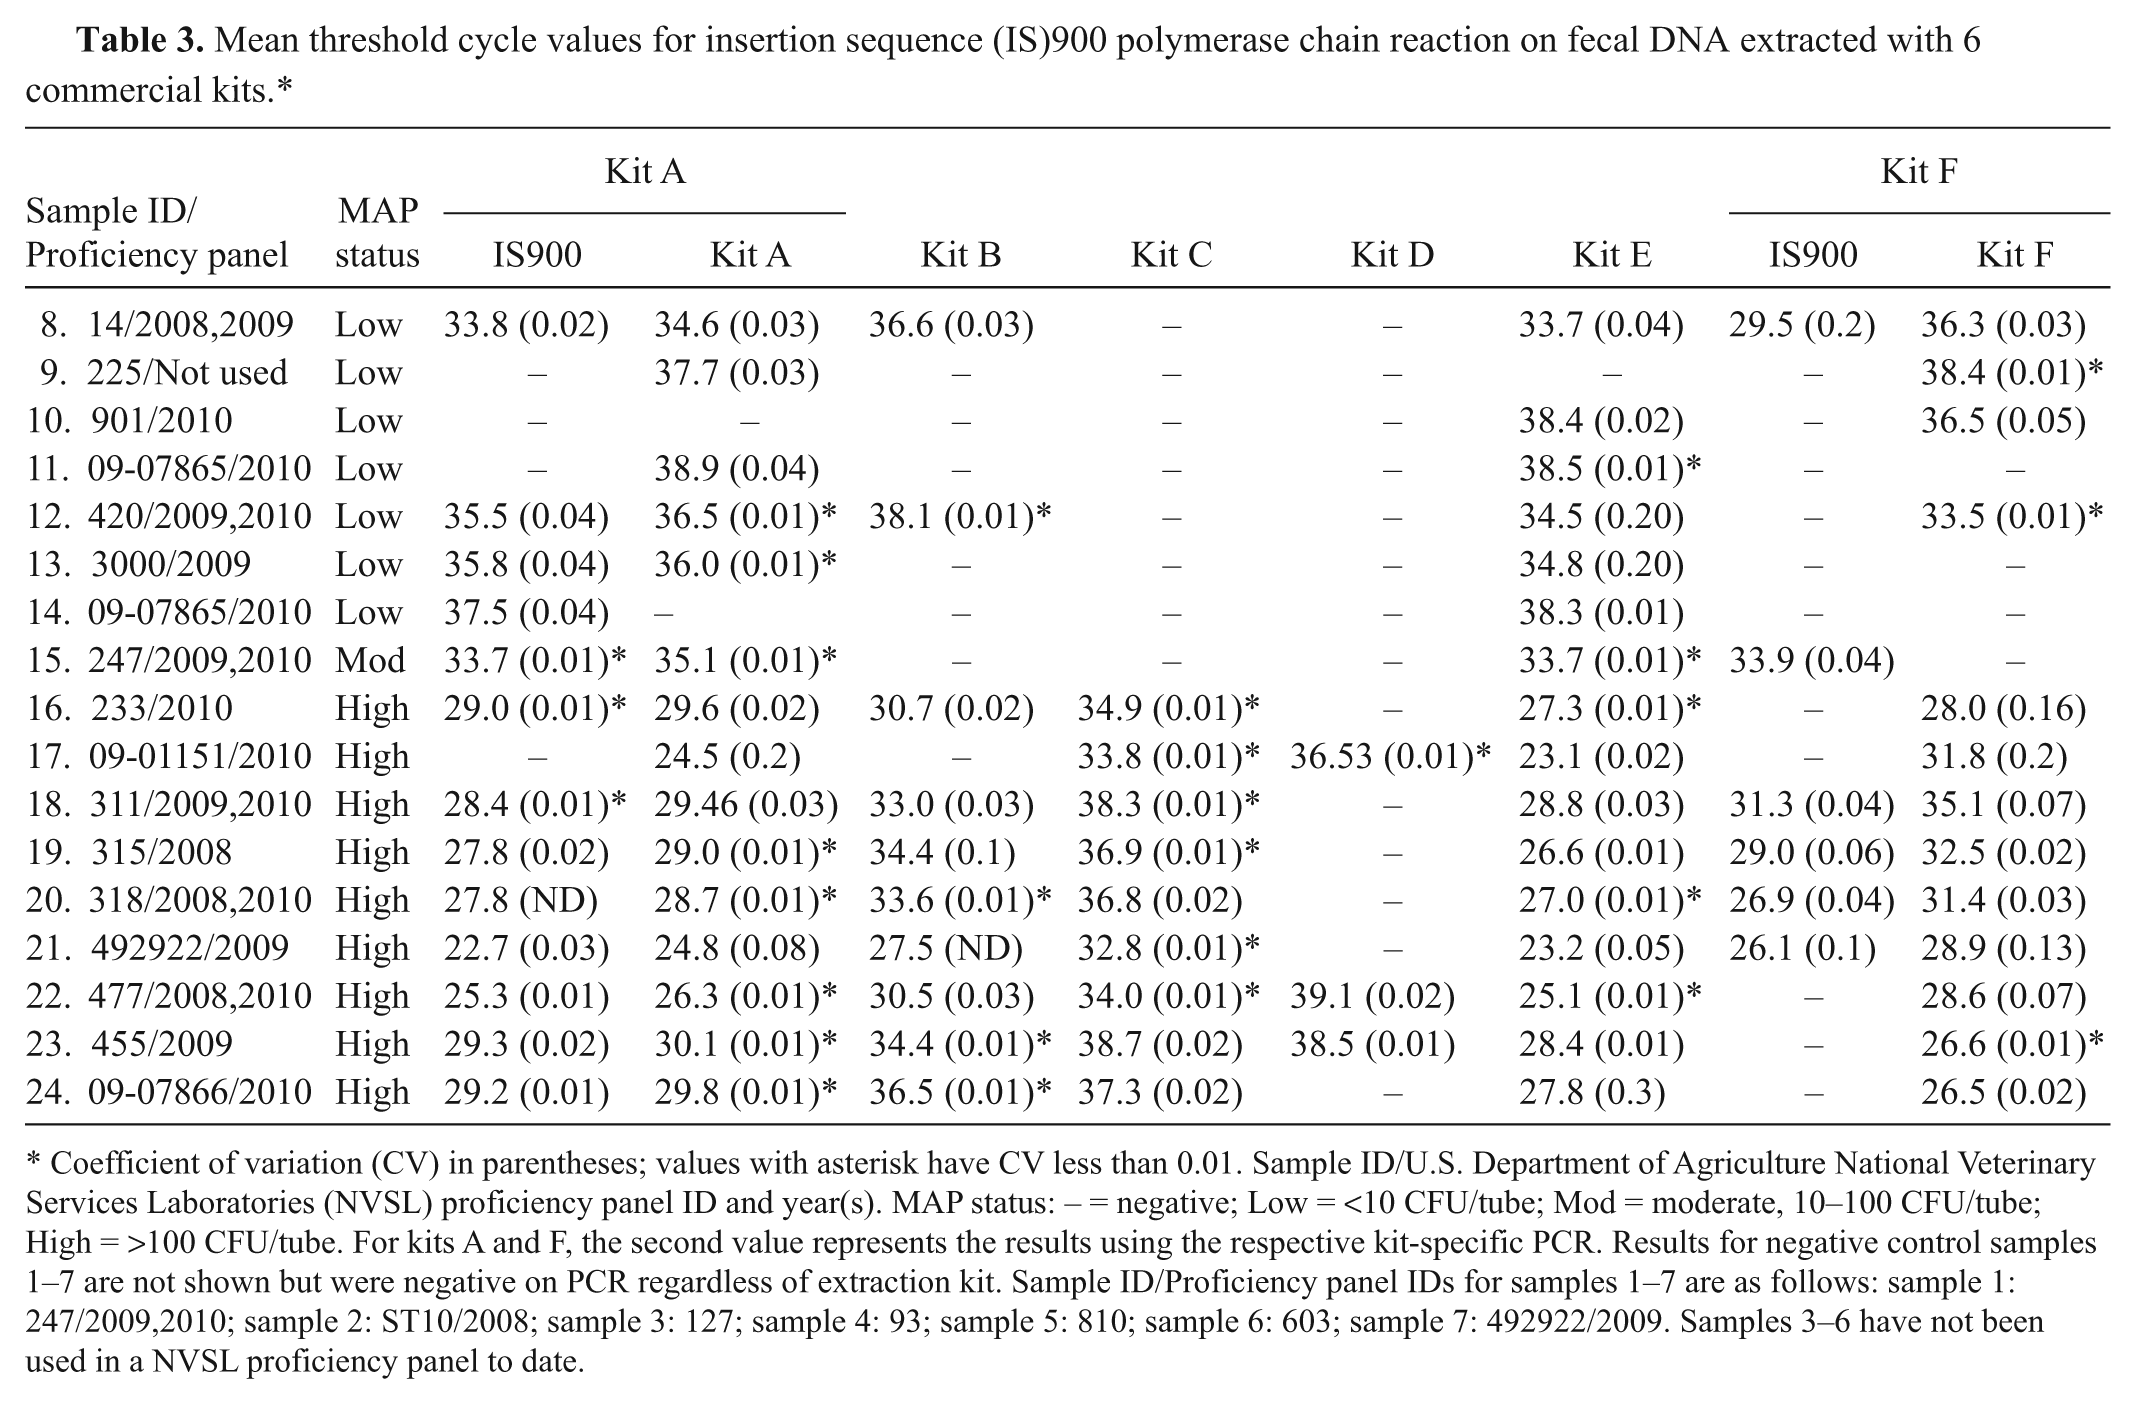
Coefficient of variation (CV) in parentheses; values with asterisk have CV less than 0.01. Sample ID/U.S. Department of Agriculture National Veterinary Services Laboratories (NVSL) proficiency panel ID and year(s). MAP status: − = negative; Low = <10 CFU/tube; Mod = moderate, 10–100 CFU/tube; High = >100 CFU/tube. For kits A and F, the second value represents the results using the respective kit-specific PCR. Results for negative control samples 1–7 are not shown but were negative on PCR regardless of extraction kit. Sample ID/Proficiency panel IDs for samples 1–7 are as follows: sample 1: 247/2009,2010; sample 2: ST10/2008; sample 3: 127; sample 4: 93; sample 5: 810; sample 6: 603; sample 7: 492922/2009. Samples 3–6 have not been used in a NVSL proficiency panel to date.
Performing PCR with the corresponding commercial kits for DNA extraction kits A and F resulted in improved sensitivity compared to in-house PCR tests. PCR kit A resulted in the identification of only 2 additional positive samples; however, using PCR kit F on the respective kit F extracted samples resulted in an increase in sensitivity of detection from 35.3% (6/17) to 76.5% (13/17; Tables 2 and 3). Specificity values did not change with use of the commercial PCR kits. The target gene for kit A is unknown but the target gene for PCR kit F is hspX, a single copy gene in the MAP genome. 6
Discussion
DNA purity is of great concern in fecal DNA extraction, as there are many inhibitors for the PCR reaction in feces.10,14,20 In the present study, a spectrophotometer k was used to measure absorbance at 260nm and 280nm to determine DNA purity of all samples. Interestingly, the purity observed for samples after extraction did not correlate with sensitivity of the PCR reactions. Kit F had one of the best average purities yet yielded the lowest PCR sensitivity among the kits when using IS900 PCR. Conversely, kit E had the lowest average purity but had the greatest sensitivity in PCR. These conflicting results may be due to the inaccuracy of measuring DNA purity in fecal samples by spectrophotometry due to confounding substances. Higher 260nm/280nm ratios (above 2.0) can be indicative of contamination with RNA that also absorbs light at 260 nm (Thermo Scientific, 2010, T042-Technical Bulletin NanoDrop spectrophotometers 260/280 and 260/230 ratios. Available at: http://www.nanodrop.com/Library/T009-NanoDrop%201000-&-NanoDrop%208000-Nucleic-Acid-Purity-Ratios.pdf). Also, humic acid, a compound found in soils and feces, can influence measurements because it also absorbs light at 260 nm and is a factor in PCR inhibition.8,10 Spectrophotometry was initially used to quantify the amount of DNA recovered by each extraction method (data not shown). The use of fluorescence with the PicoGreen assay to quantify DNA has the advantage of being a more sensitive technique and is less susceptible to misinterpretation due to sample contaminants. Results obtained using the PicoGreen assay were significantly lower than those found with spectrophotometry (average yield of 134 ng/100 mg vs. 961 ng/100 mg), which may indicate that spectrophotometry was unable to discriminate confounding substances in samples that have similar absorption properties to DNA. Interestingly, the same pattern of yield and concentration was found among the kits with either DNA quantification method. When analyzing the IS900 reaction results, DNA concentration and sensitivity of PCR were highly correlated for all kits except for kit F. Kit E had the greatest concentration and sensitivity followed by kit A and so on. This indicates that final DNA concentration in the elution volume is a key factor to identifying MAP with PCR. Kit E demonstrated a sensitivity of 94.1%, having only 1 positive sample (sample 9) that was not accurately identified by IS900 PCR. The sample was not identified by any of the other kits tested in the current study using IS900 PCR and was from an animal that was a low shedder. To be considered positive, both duplicate samples were required to yield positive Ct values (<40). Yet for this particular sample, 1 duplicate had a Ct value of 38.3, suggesting a potential positive result. If this sample were included as a positive, kit E would have attained 100% sensitivity. Of interest, samples from 2 low shedding animals were identified only with this extraction method with the IS900 reaction (samples 10 and 11). These 2 samples were correctly identified by less than 70% of participating laboratories in the 2010 Johne’s Disease National Program Fecal Proficiency Panel (USDA-APHIS, NVSL: 2010), and as a result, NVSL decided to remove them from the panel for official grading purposes. However, in the current study, the 2 samples were still considered because 1 of the 6 kits tested identified both samples.
Kit A also exhibited efficient extraction of DNA from fecal samples, as it identified all but 1 of the high shedders in the sample panel. Sample number 17 was positive on only 1 reaction of 1 of the duplicate samples, and thus was considered negative. This sample was part of the 2010 NVSL Fecal Proficiency Panel sent to diagnostic laboratories in the United States and internationally and proved to be problematic for PCR results. The sample was reported to have inhibitors for PCR, possibly indicating the reason for only one IS900 PCR reaction having a positive result for kit A in this study (USDA-APHIS, NVSL: 2010). Kits D, E, and C were also able to correctly identify this sample.
The other kits tested were capable of successfully identifying the majority of the samples from high shedders, but samples from the low shedders were identified with much less frequency. Kit B missed 1 out of 9 high shedders and identified 2 out of 7 low shedders. Kit C identified all high shedders and no low shedders. Kit D only identified 3 out of all 17 positive samples and had the lowest sensitivity. Interestingly, the only kit tested that was developed solely for the purpose of MAP diagnosis by fecal PCR, kit F, was among the kits that performed the most poorly. Upon initial IS900 PCR, only 1 sample was positive (sample 18), and it was from a high shedder. In order to further evaluate these results, another extraction with this kit was performed with the same 24 samples in another laboratory using the same PCR assay, and only 6 out of 17 positive samples were identified.
A comparison of PCR results with the 2 target genes IS900 and ISMAP02 demonstrated a higher number of positive samples identified using IS900. A possible explanation for this is the higher number of copies of IS900 (17) relative to ISMAP02 (6) in the MAP genome. 19 The only kit that yielded more samples identified with the ISMAP02 target gene was kit F. This may be due to a dilution effect of inhibitors during the PCR assay. The first amplification of ISMAP02 was performed in a 50-µl reaction volume with 5 µl of extracted sample. However, the second amplification (inside reaction) only contained 1 µl of the first amplification, perhaps resulting in a decreased concentration of inhibitors. A study that evaluated DNA extraction kits for human feces observed a decrease in PCR inhibition when performing a nested PCR assay as compared to a single amplification PCR, suggesting that reduced PCR inhibition may be due to further dilution of the extracted sample. 13 A disadvantage of using the ISMAP02 assay in the present study was a higher number of false-positive samples observed for 2 of the extraction kits. This is likely due to the nature of the nested PCR reaction, where amplicons from the first reaction are added to the second reaction, increasing the likelihood of cross contamination.
When using the PCR reagents suggested by the manufacturers of kits A and F, an increase in sensitivity was observed. Kit A, when using respective PCR kit A, identified 2 more positive samples compared to the IS900 PCR. These were sample 17 (high shedder) and sample 9 (low shedder), both of which had only 1 positive replicate sample before and were considered negative. The sensitivity of detection after extraction of fecal samples using kit A was improved from 76.5% detection with IS900 PCR to 88.2% (15/17) using the respective PCR kit A. Additionally, 7 more positive samples were identified using PCR kit F recommended by the manufacturer with the respective kit F DNA samples, resulting in a sensitivity of 76.5% (13/17) compared to 35.3% (6/17) for IS900 PCR. These results suggest that the use of companion PCR tests for extracted samples may influence the sensitivity of detection, as manufacturers have optimized these tests by adding components to achieve best performance. These may include additives such as bovine serum albumin to limit the effect of inhibitors in the PCR reaction. 10 However, it should be noted that despite the use of the respective PCR tests along with their associated DNA extraction kits, the maximal sensitivity and specificity of detection was achieved with kit E and IS900 PCR.
It is also important to note that sample size does not seem to be a determining factor for the sensitivity of the different extraction kits used in the current study. Kit E only used 150 mg of sample as compared to other kits that used higher volumes of feces and yet demonstrated lower sensitivities of detection by PCR than kit E. On all kits, the option of increasing sample size in the extraction method was followed if it was suggested by the manufacturer to improve the detection of samples that might contain low numbers of MAP.
The results presented herein suggest that physical disruption (bead beating) of the sample in a lysis solution is a good technique to isolate MAP DNA because the best performing kits included this method in their protocols. Previously, it was demonstrated that lysis by bead beating was preferable to cell extraction buffers when extracting MAP DNA from manure-contaminated soil samples. 4 After lysing of the cells, the rest of the extraction methods varied greatly between the kits that presented the greatest sensitivity, indicating that more than 1 procedure can be successfully used after the initial lysis step. Kit E utilizes column technology with a total of 3 columns within its protocol, to filter as well as bind and wash DNA. Kit A utilizes magnetic bead–based nucleic acid isolation and purification technology. Comparing 4 extraction methods for the identification of MAP DNA in fecal samples, another study 2 also found magnetic particle–based extraction and silica-based extraction to be among the best 2 methods. A study published in 2011 described a modified guanidine-lysis method for the extraction of MAP DNA from fecal samples. 21 The method has a reported sensitivity of 98.46% and utilizes bead beating for disruption, along with silica membranes and ethanol for extraction. It can be concluded that, after sample lysis, different methodologies can be utilized for the successful extraction and amplification of MAP DNA from bovine fecal samples.
The current study demonstrates how choosing different kits for extraction of DNA from fecal samples can impact the accuracy of identifying animals shedding MAP, and that not all kits currently being used by diagnostic laboratories perform with the same accuracy. The results of this comparison study indicated that extraction using kit E yielded PCR reactions with the highest sensitivity and specificity. Further examination of the kits that had the best performance would provide insight into further improvement of extraction protocols for the lowest detection threshold in PCR.
Footnotes
a.
MagMax Total Nucleic Acid Isolation Kit, Applied Biosystems, Foster City, CA.
b.
PowerSoil DNA Isolation Kit, MO BIO Laboratories Inc., Carlsbad, CA.
c.
QIAamp Stool DNA Mini Kit, Qiagen Inc., Valencia, CA.
d.
ExtractMaster Fecal DNA Extraction Kit, Epicenter Biotechnologies, Madison, WI.
e.
ZR Fecal DNA MiniPrep, Zymo Research Corp., Irvine, CA.
f.
MAP Extraction System, Tetracore Inc., Rockville, MD.
g.
Vortex Genie 2, A. Daigger & Co., Vernon Hills, IL.
h.
Vortex Adapter 13000-V1-24, MO BIO Laboratories Inc., Carlsbad, CA.
i.
MagMAX Express Magnetic Particle Processor, Applied Biosystems, Foster City, CA.
j.
Mini Bead Beater 96, Biospec Products Inc., Bartlesville, OK.
k.
NanoDrop 1000 Spectrophotometer, Thermo Fisher Scientific Inc., Wilmington, DE.
l.
Quant-iT PicoGreen dsDNA Assay Kit, Invitrogen Corp., Carlsbad, CA.
m.
7500 Fast Sequence Detection System, Applied Biosystems, Foster City, CA.
n.
TaqMan Universal PCR Master Mix, Applied Biosystems, Foster City, CA.
o.
GeneAmp 10X PCR Buffer II, Applied Biosystems, Foster City, CA.
p.
AmpliTaq Gold DNA Polymerase, Applied Biosystems, Foster City, CA.
q.
Vet Alert Johne’s Real-Time PCR, Tetracore Inc., Rockville, MD.
r.
TaqMan MAP (Johne’s) Reagents, Applied Biosystems, Foster City, CA.
s.
JMP 8, SAS Institute Inc., Cary, NC.
Declaration of conflicting interests
The author(s) declared no potential conflicts of interest with respect to the research, authorship, and/or publication of this article.
Funding
The author(s) received no financial support for the research, authorship and/or publication of this article.