
Abstract
The cell count and differential of cerebrospinal fluid (CSF) cytologic examination classify CSF as inflammatory or not. The cytospin cell yield is related to cell count, but to our knowledge a relationship has not been characterized and cytospin precision is undocumented in any species. The objective of our study was to calculate intra-assay precision of cellular yield and differential on cytocentrifuged canine CSF, determine the factors that may affect precision, and predict the number of cytospins necessary to confirm mild neutrophilic pleocytosis. Ten concurrent replicate cytospins were created from nonhemorrhagic CSF, obtained from 60 dogs in other terminal studies, with either a manual or calibrated pipetting technique. Up to 500 cells per cytospin were counted and classified on each slide. Coefficient of variation (CV), multiple regression, and probabilities were calculated for relationships between cell yield and independent factors including technique, total nucleated cell count, cell differential, and total protein. Manual and calibrated pipetting had similar CVs (average 31%) for total cell yield, but the calibrated technique had fewer foamy macrophages. CV for neutrophil percentage among low cellularity samples with any neutrophils was 146%. Probability based on linear regression showed that 1 cytospin is sufficient to identify samples with >3% neutrophils. Occasional neutrophils, eosinophils, mitotic figures, phagocytic cells, and ependymal cells were seen in many low cellularity canine CSF samples. Canine CSF cytospin cell yield and differential evaluations are imprecise. Calibrated rather than manual pipetting is recommended.
Cerebrospinal fluid (CSF) analysis is a critical tool in the evaluation of central nervous system disease in dogs with signs of neurologic disease.9,26 CSF analysis includes evaluation of total nucleated cell (TNC) count, total protein, and red blood cell (RBC) count as well as cytospin preparation for a microscopic cell differential. Microscopy is critical, as abnormalities in cell types, structures, and organisms can be present even when the TNC count is normal.6,8,9 In conjunction with fluid analysis, the results of cytospin evaluation are used to determine if the sample is inflammatory or noninflammatory. Mild increases in neutrophils, eosinophils, and mononuclear cells (lymphocytes and monocytes) or the presence of unusual cells (e.g., plasma cells, neoplastic cells) will result in the classification of a sample as abnormal even if the total cell count is normal. 9 Misclassification of CSF as inflammatory when it deviates from normal but is not inflammatory can have profound, adverse, long-term consequences for patients if inappropriate therapy is implemented. 21 Therefore, the reliability of CSF cytospin results is critical in a clinical setting.
Ongoing research to improve the accuracy of canine CSF analysis is directed at several factors including initial composition, storage time, protein concentration, or exogenous preservatives such as bovine serum albumin, autologous serum, and hetastarch. Though refrigeration for up to 8 hr does not have significant impact on cell differentials, the addition of autologous serum and hetastarch improves cell preservation at 24 and 48 hr.4,12 Inflammatory CSF samples that are higher in protein also show increased cellular preservation, similar to that seen with the addition of bovine serum albumin. 12 Current research in human CSF analysis using automated instrumentation techniques has shown poor to moderate correlation with cytospin cell differential, especially with poorly cellular samples.3,22,25 A study using an automated assay to evaluate canine CSF disclosed marked discrepancies between differential results on cytological preparations and the automated analyzer, confirming the importance of microscopic evaluation of concentrated CSF. 22 However, in that study, only 1 or 2 cytospins were evaluated, and the precision of cytospin preparations was not investigated. A laboratory test cannot be accurate if it is not precise.14,19,23
Typically, 1 or 2 cytospins are prepared for microscopic evaluation. Clinical experience when evaluating CSF cytospins suggests that typically there is variability in the total number of cells on each cytospin (cell yield) and the types of cells present (cell differential) from any given sample, even when slides are prepared using the same technique at the same time on the same centrifuge. The relationship between cell count on a hemocytometer and the total cell yield on cytospin has been investigated with human CSF, with a poor correlation between the two. 27 However, the precision (repeatability) of cytospin preparations of CSF has not been quantified in humans or veterinary species, to our knowledge. At present, evidence is lacking that demonstrates the precision of cytospin preparations despite its routine use as the primary method for cytologic evaluation of CSF in the clinical setting. In addition, without understanding the precision of cytospins, any investigative correlations between cytospins and the effects of various factors on cell preservation or the results of manual or automated CSF analysis are suspect. We hypothesized that cytospin preparation of CSF is not a precise test and has a high coefficient of variation (CV >10%) on cellular yield and differentials. The objective was to document the intra-assay precision (repeatability) of cellular yield and cell differential on cytocentrifuged CSF samples in multiple concurrently prepared replicate cytospins. A secondary objective was to determine what, if any, factors impacted the intra-assay precision, and finally to determine the number of cytospins necessary to accurately confirm a mild neutrophilic pleocytosis.
A total of 60 CSF samples were collected between September 2008 and July 2009 in and around Athens, Georgia. Most samples (n = 59) were collected immediately postmortem from research dogs previously scheduled for euthanasia from a variety of other terminal studies. These other studies included ectoparasite control at a local private research institution, Lyme disease vaccination evaluation, pharmacokinetics of an intranasal antifungal medication, and advanced training laboratories in medical techniques for military and civilian veterinarians held on the campus of the University of Georgia at the College of Veterinary Medicine (UGA-CVM; Athens, GA). An animal use protocol for the postmortem collection of CSF was approved by the Institute Animal Care and Use Committee (IACUC) at UGA. Separate protocols were approved by each institution’s IACUC committee for all of the original research studies. One additional sample of excess CSF beyond that which was utilized in the routine diagnostic analysis for a patient that presented to the neurology service at UGA-CVM Veterinary Teaching Hospital also was included in our study with the owner’s consent.
Cerebrospinal fluid was collected from the cerebellomedullary cistern <10 min following euthanasia. The dorsal cervical area was shaved and aseptically prepared immediately prior to euthanasia. After euthanasia, CSF was collected routinely using a 22-ga, 3.8-cm spinal needle a and stored in 1.0-mL sterile cryogenic vials. b A minimum of 1.5 mL was collected per dog. Samples were placed on ice for transportation to the UGA-CVM clinical pathology laboratory, and all samples were processed within 4 hr, most within 1 hr. The CSF analysis included a red blood cell (RBC) count, total nucleated cell (TNC) count, total protein (TP), and 10 cytospin evaluations (see below). The RBC and TNC counts were performed manually on a Neubauer hemocytometer. c Briefly, the hemocytometer was cleaned with methanol, coverslipped with a glass slide, both sides of the chamber were filled with CSF, and the sample was allowed to sit for 1–2 min before counting. Nine squares were counted for each side of the chamber separately for RBCs and leukocytes, and the average multiplied by 1.1. Counts were reported in units of cells/µL. Protein was measured using Coomassie blue on a commercial analyzer. d
Ten cytospins were prepared concurrently for each CSF sample. All slides were stained with a Romanowsky type stain e and stored at room temperature until cytologic evaluation was performed. For the manual technique (phase I), cytospin samples were processed using the standard technique in the clinical pathology diagnostic laboratory. The technologist would gently agitate the CSF sample with a general purpose disposable nonsterile #202 transfer pipette, f then place 3 drops (~30–50 μL each) into a disposable single cytofunnel chamber with white filter cards g attached to a glass slide, along with 1 drop of 22% bovine albumin. h The chambers were placed in a cytocentrifuge, i and all 10 were spun at 1,000 rpm for 5 min. After analysis of the initial data, a change in technique was attempted to increase precision. Rather than 3 imprecise CSF drops using a manual transfer pipette, samples prepared in phase II were pipetted with a calibrated 100-µL fixed volume pipette, j with 100 μL of CSF per cytospin chamber and 1 drop of albumin using the transfer pipette as previously described.
All cytospin slides were examined by the same clinical pathologist (PM Krimer). All cells per cytospin were counted and a differential performed, up to 500 cells on each slide 7 ; the number was chosen to exceed the common 100-, 200-, and 400-cell differential counts used in veterinary and human leukocyte differentials in a variety of transcellular fluids and blood.11,13,16,17,24 The slides were examined in a standard format: with the frosted edge of the slide on the left hand of the stage moving first left to right at the top-most field, then down one field, right to left, down one field, and repeated until all cells were counted or the maximum 500 cells were reached. Cells were classified as small-to-medium mononuclear cell, large mononuclear cell, vacuolated macrophage (>50% vacuolated cytoplasm), neutrophil, eosinophil, plasmacytoid cell, ependymal cell, metarubricyte, mitotic figure, and other. Any unusual findings such as erythrophagia were noted. Samples found to have significant blood contamination (>1.5 × 10⁹/L; >1,500 RBC/μL) 18 were excluded from analysis. All statistical analyses were performed using commercial software.k,l The CV was calculated to quantify the precision of total cell yield and percentage differential counts for each cell type. A Student t-test was used to evaluate for differences in mean cell yield, CV, and cell percentages between manual and calibrated pipetting techniques, with the Satterthwaite analysis used if variances were unequal. Some analyses were repeated in only low cellularity CSF samples; for the purposes of our study, a low cellularity CSF sample had a total nucleated cell count of <5 × 10⁶ cells/L (<5 cells/µL) and total protein <0.25 g/L (25 mg/dL). 6 Linear regression was used to examine correlations between independent variables of TNC count, RBC count, and protein on the total cell yield and percentage of abnormal cells, particularly neutrophils and foamy macrophages. Using the linear regression equations, simple probabilities were calculated to determine the number of expected slides required for identification of various levels of neutrophilic pleocytosis.
In total, 60 CSF samples were collected; 54 dogs were research Beagles, 5 were mixed-breed dogs, and 1 was a Newfoundland. The average age was 1.2 years of age, with a range of 6 months to 12 years. There were 31 males and 29 females. Thirty-two samples were processed using the manual technique (phase I), and 28 with the calibrated technique (phase II). One sample using the calibrated technique was excluded from analysis because of poor sample quality. The average WBC count in the manual technique (phase I) samples was 4.2 ± 5.1 × 10⁶ cells/L (4.2 ± 5.1 cells/µL) with a range of 0–25 × 106 cells/L (0–25 cells/µL), which was not statistically different ( p < 0.05) from calibrated technique (phase II) samples that had an average WBC count of 5.6 ± 6.3 × 10⁶ cells/L (5.6 ± 6.3 cells/µL) with a range of 1–26 × 106 cells/L (1–26 cells/µL). Similarly, there was no statistical difference ( p < 0.05) in the average total protein measurement between samples using the 2 techniques; the average protein for the manual technique was 0.15 ± 0.04 g/L (15 ± 4 mg/dL) with a range of 0.11–0.24 g/L (11–24 mg/dL), whereas the calibrated technique had an average protein of 0.18 ± 0.10 g/L (18 ± 10 mg/dL) with a range of 0.09–0.62 g/L (9–62 mg/dL).
Multiple linear regression showed that only technique and TNC count were independently correlated with total cell yield; therefore, calculations were performed separately for the 2 techniques. The choice of manual versus calibrated technique impacted the average total cell yield per cytospin ( p < 0.03). The manual technique had an average cytospin cell yield of 250 (±160) cells per cytospin with a range of 67–500 cells, whereas the calibrated technique slides had an average cell yield of 170 (±120) with a range of 14–490 cells per cytospin (Fig. 1).
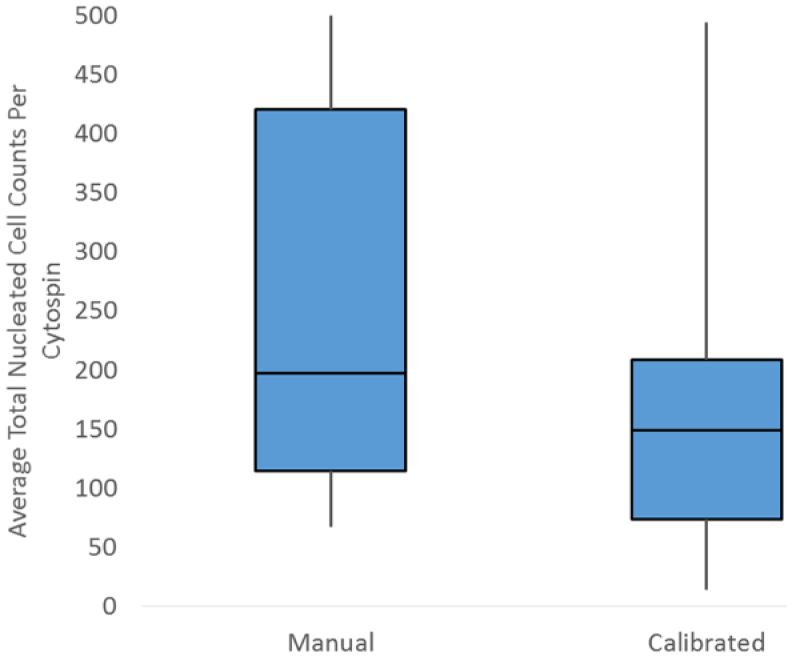
Average total nucleated cell count per cytospin in manual and calibrated pipetting techniques in 59 canine cerebrospinal fluid samples.
For evaluation of test variability in total cell yield, both average standard deviation (SD) and CV were evaluated, with 4 samples in the manual technique excluded because all of the slides had >500 cells (the maximum counted). The average SD of total cell yield was different between the 2 groups ( p < 0.001). The manual technique had an average SD of 54 (±22) with a range of 25–98, whereas the calibrated technique had an average SD of 35 (±17) with a range of 4–72. However, the CV for total cell yield on a cytospin was 31% (±18%) overall and was not statistically different between manual and pipetted techniques ( p > 0.05), with individual CV of 33% (±17%) and 28% (±19%) respectively.
Interestingly, techniques had a significant difference in the percentage of foamy macrophages ( p < 0.0007) but not the percentage of neutrophils, small lymphocytes, or larger mononuclear cells ( p < 0.05). The average percentage of foamy macrophages in the manual technique (phase I) was 1.7%, whereas that of calibrated pipetting (phase II) was 0.1%, over a 10-fold difference (Fig. 2). Linear regression showed that the WBC count was significantly ( p < 0.001) associated with total cell yield for both manual (R = 0.32; Fig. 3) and calibrated pipette (R = 0.51; Fig. 4) techniques, although neither association is considered strong and is not useful for predicting the number of cells expected on a cytospin. The WBC count was not ( p > 0.05) correlated to either the CV of total cell yield or percentage neutrophils. Protein was correlated with the total cell yield ( p < 0.01), but the association was weak (R2 = 0.11) and disappeared with multiple regression. The total protein was also correlated with the percentage of neutrophils ( p < 0.003), although the strength of this association was also weak (R2 = 0.14). The RBC count did not correlate with any parameters.
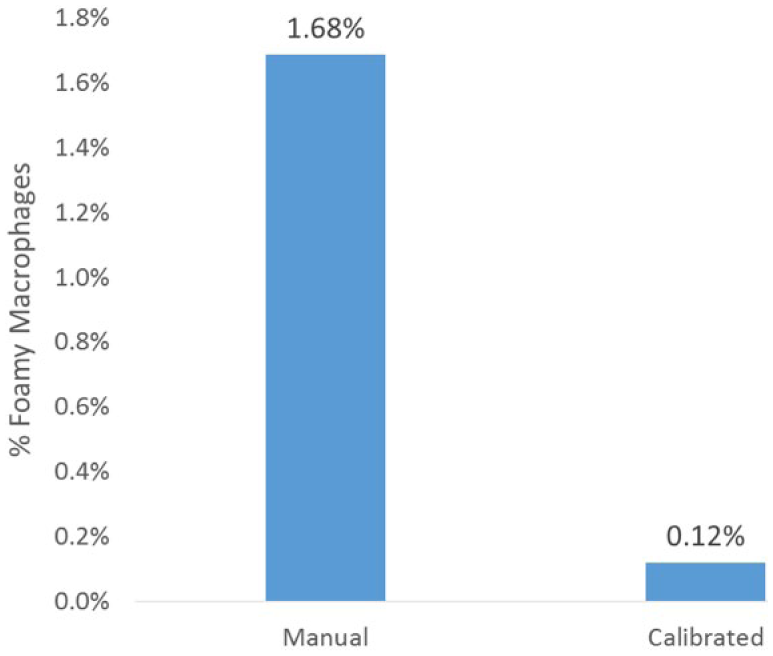
Percentage of foamy macrophages in cytospins created using a manual or calibrated pipetting technique in 59 canine cerebrospinal fluid samples.
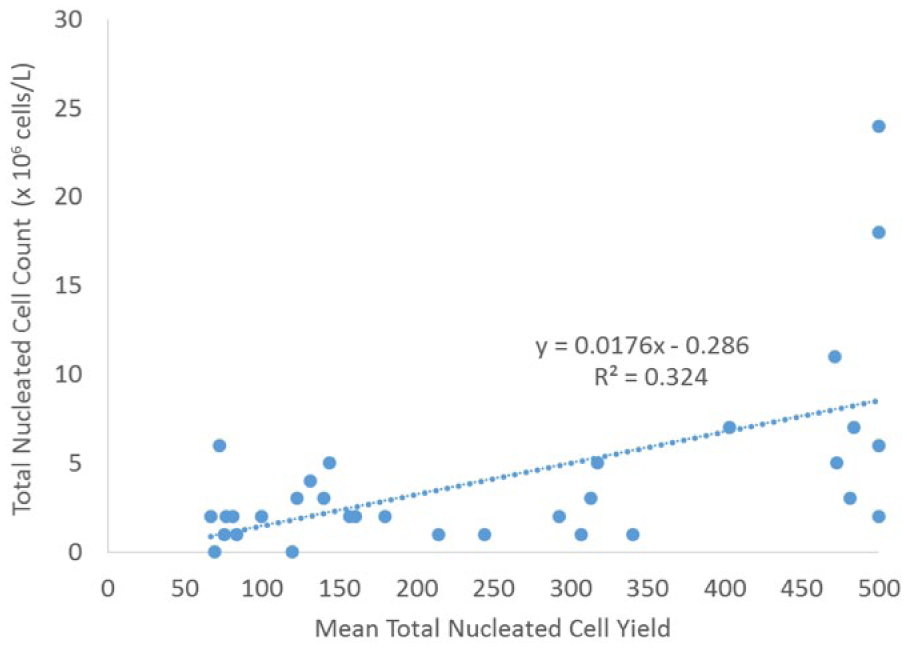
Linear regression of cytospin cell yield relative to total nucleated cell count using a manual pipetting technique in 32 canine cerebrospinal fluid samples.
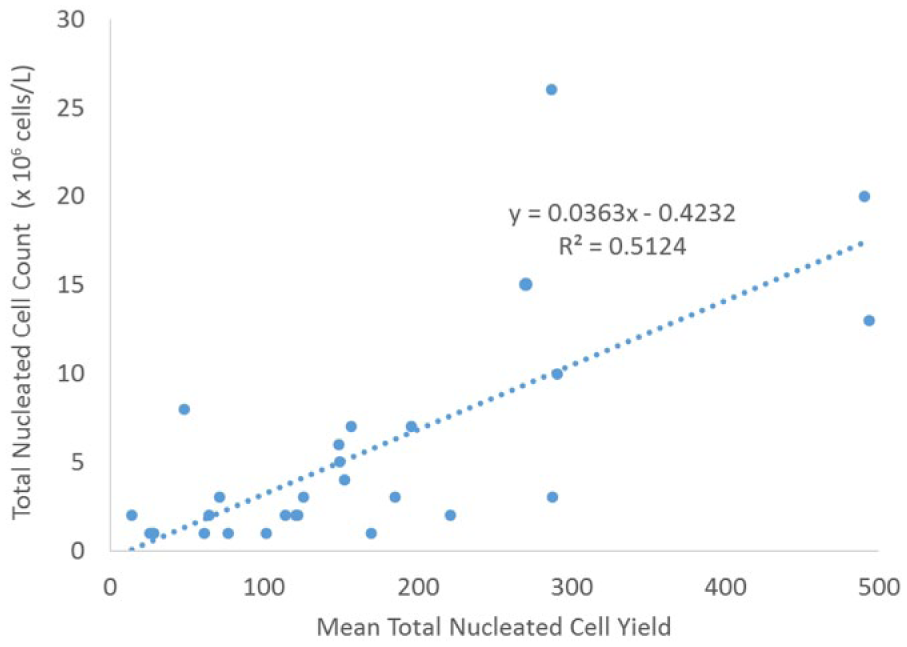
Linear regression of cytospin cell yield relative to total nucleated cell count using a calibrated pipetting technique in 27 canine cerebrospinal fluid samples.
In 39 low cellularity samples (those with a WBC count of <5 × 10⁶ cells/L [<5 cells/µL]), the average percentage of neutrophils was 1.4% (±3.7%) with a range of 0–23%, and a median of 0.4%. In the low cellularity samples, the average SD for the percentage of neutrophils was 0.80% (±1.0%) with a range of 0 to 5.4%. One of the low cellularity samples had 22.9% neutrophils; this CSF sample came from a dog without clinical signs, and the sample had a TNC count of 1 × 10⁶ cells/L (1 cell/µL), RBC count of 7 × 10⁶ cells/L (7 cells/µL), and protein of 0.15 g/L (15 mg/dL). Excluding this dog, the average percentage of neutrophils was 0.9% (±1.2%), a maximum of 4.1%, median of 0.53%, and average SD of 0.7% (±0.6%).
Overall, 31 of 39 (79%) low cellularity samples had at least 1 cytospin with a neutrophil, and 7 of 39 (18%) samples had average >2% neutrophils throughout all 10 cytospins. Among the 31 samples with at least 1 cytospin that had a neutrophil, the CV for the percentage of neutrophils was 150% (±96%). Similar to the CV in total cell yield, there was no statistical difference in the CV in percentage of neutrophils between the 2 techniques ( p < 0.05) and both numbers were very similar at 140% for the manual and 132% for the calibrated technique.
The number of cytospins that had >0% neutrophils, eosinophils, mitotic figures, phagocytic cells, and ependymal cells in the low cellularity CSF samples are represented in Table 1, with details of the number of slides that had neutrophils and eosinophils illustrated in Figures 5 and 6. Of the low cellularity CSF samples, 31 of 39 (79%) had at least 1 slide with a neutrophil and 12 of 39 (31%) had at least 1 slide with an eosinophil. All samples that had <5% neutrophils (n = 53) were analyzed to determine a relationship between the number of cytospins that contained neutrophils and the neutrophil percentage. Linear regression indicated a strong relationship (R2 = 0.66) with an equation of y = 0.0022x (Fig. 7). All samples with >5% neutrophils had neutrophils present on every slide. None of the low cellularity samples had nucleated erythrocytes (0/39, 0%). Four (4/39, 10%) CSF samples had at least 1 slide with a phagocytic cell, 5 of 59 (13%) CSF samples had at least 1 slide with ependymal cells, and 10 of 39 (26%) low cellularity samples had at least 1 slide with a mitotic figure. Using the regression equation generated from the data in Figure 6 for dogs with ≤5% neutrophils, we predicted the predicted probability of finding at least 1 neutrophil after 1, 2, or 3 cytospins in Table 2.
Percentage of samples divided by the number of cytospins containing each cell type in 39 low cellularity canine cerebrospinal fluid samples.*
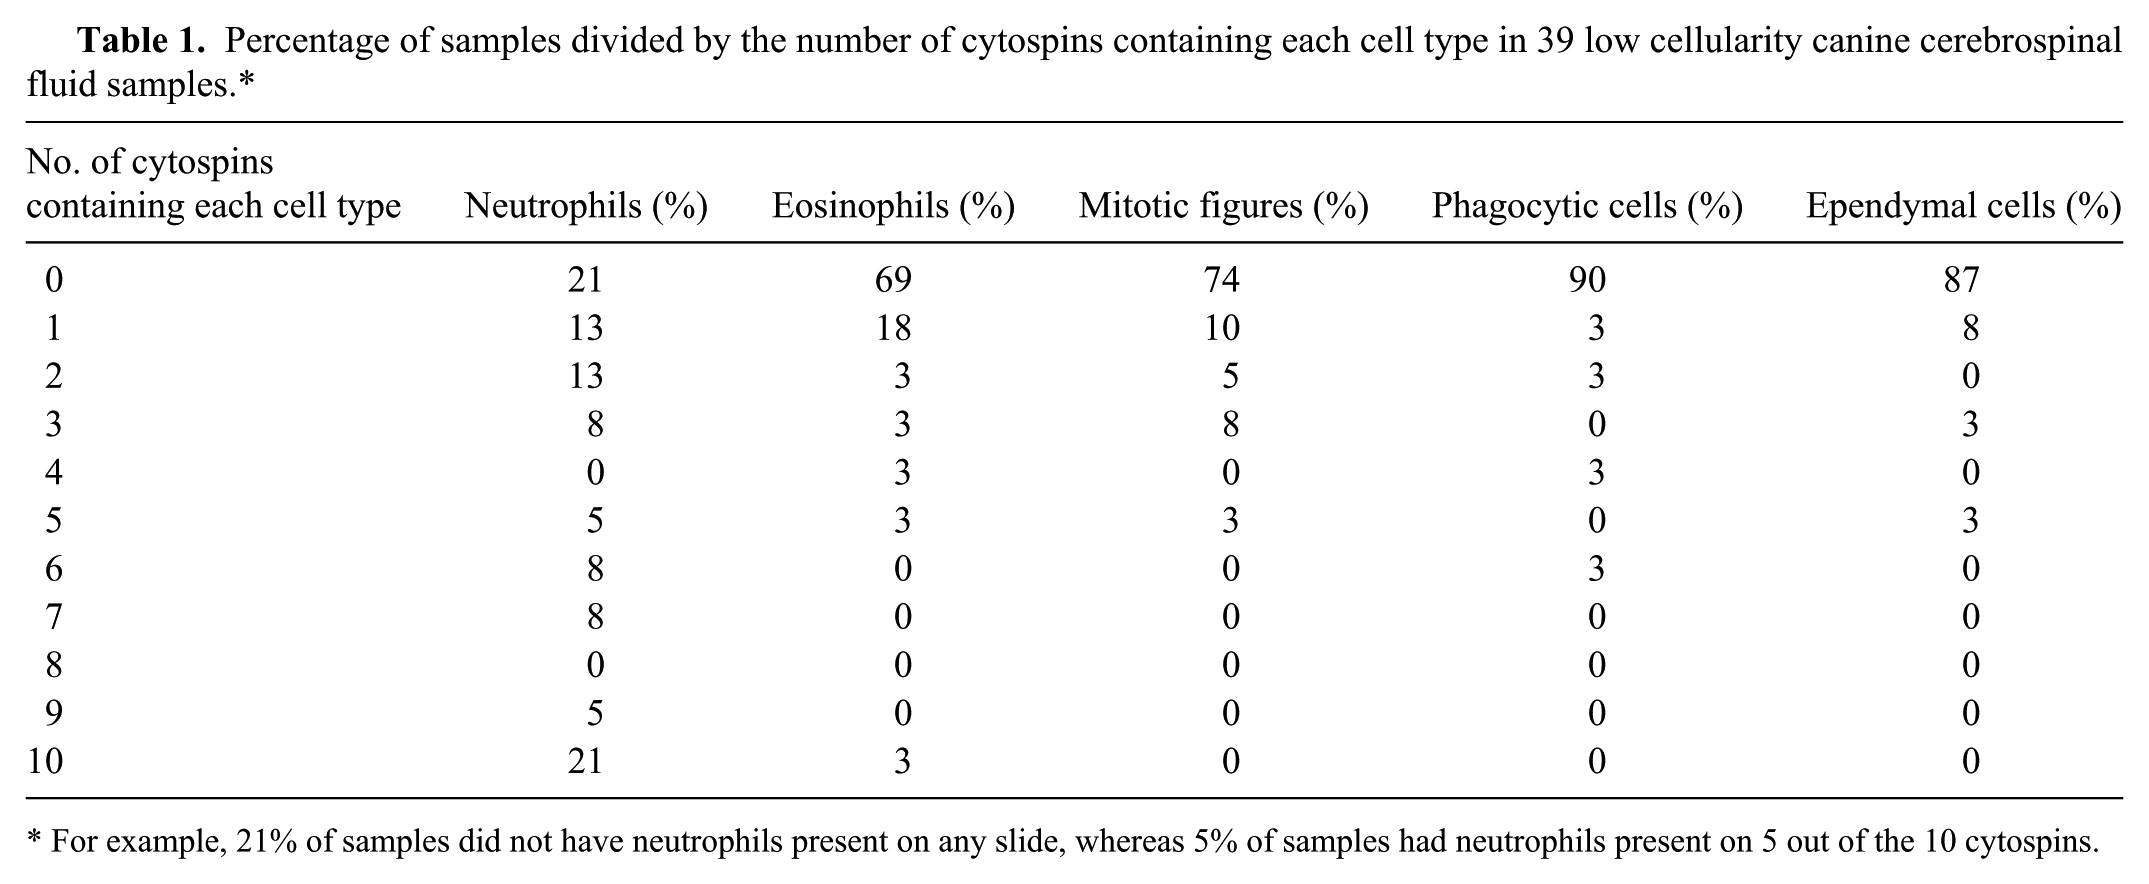
For example, 21% of samples did not have neutrophils present on any slide, whereas 5% of samples had neutrophils present on 5 out of the 10 cytospins.
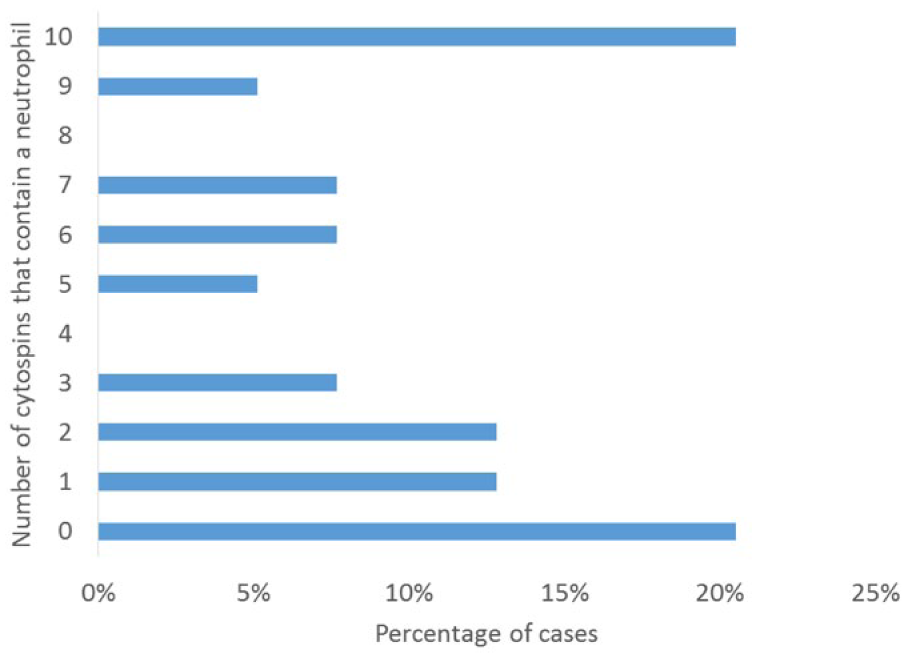
Number of cytospins that contain neutrophils in 39 low cellularity canine cerebrospinal fluid samples.
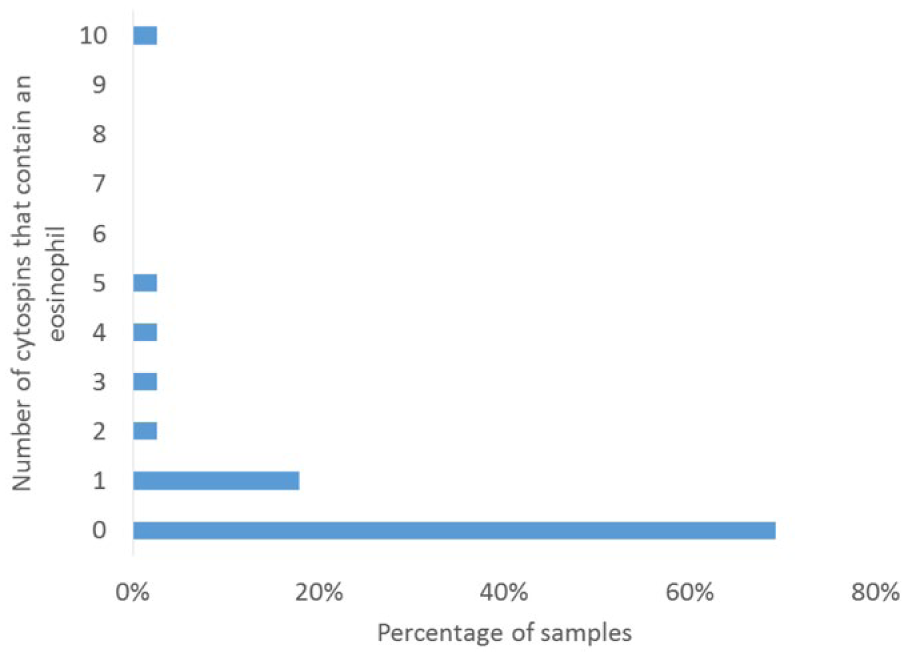
Number of cytospins that contain eosinophils in 39 low cellularity canine cerebrospinal fluid samples.
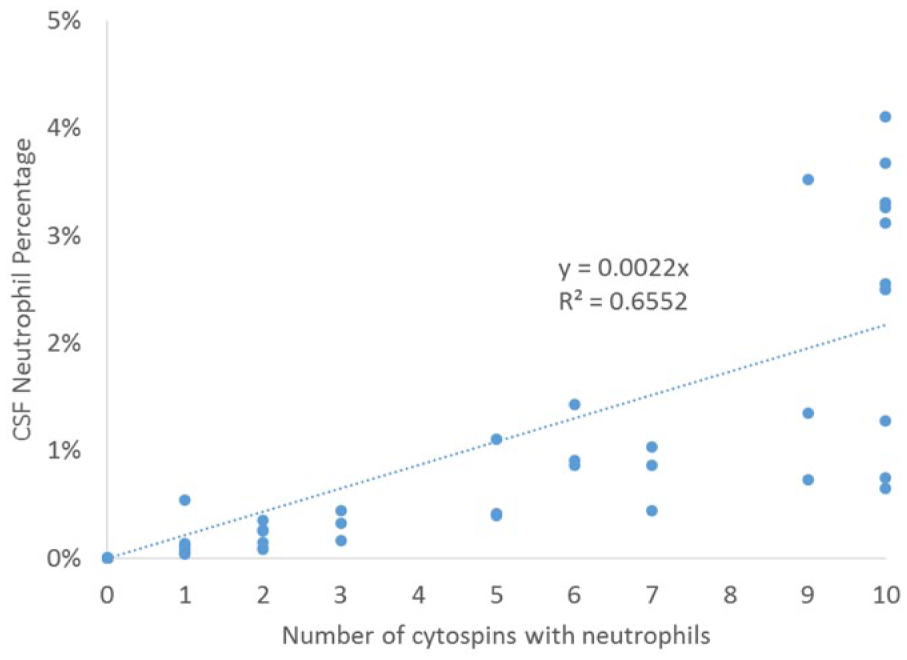
Linear regression of number of cytospins that contain neutrophils relative to the percentage of neutrophils in 53 canine cerebrospinal fluid samples.
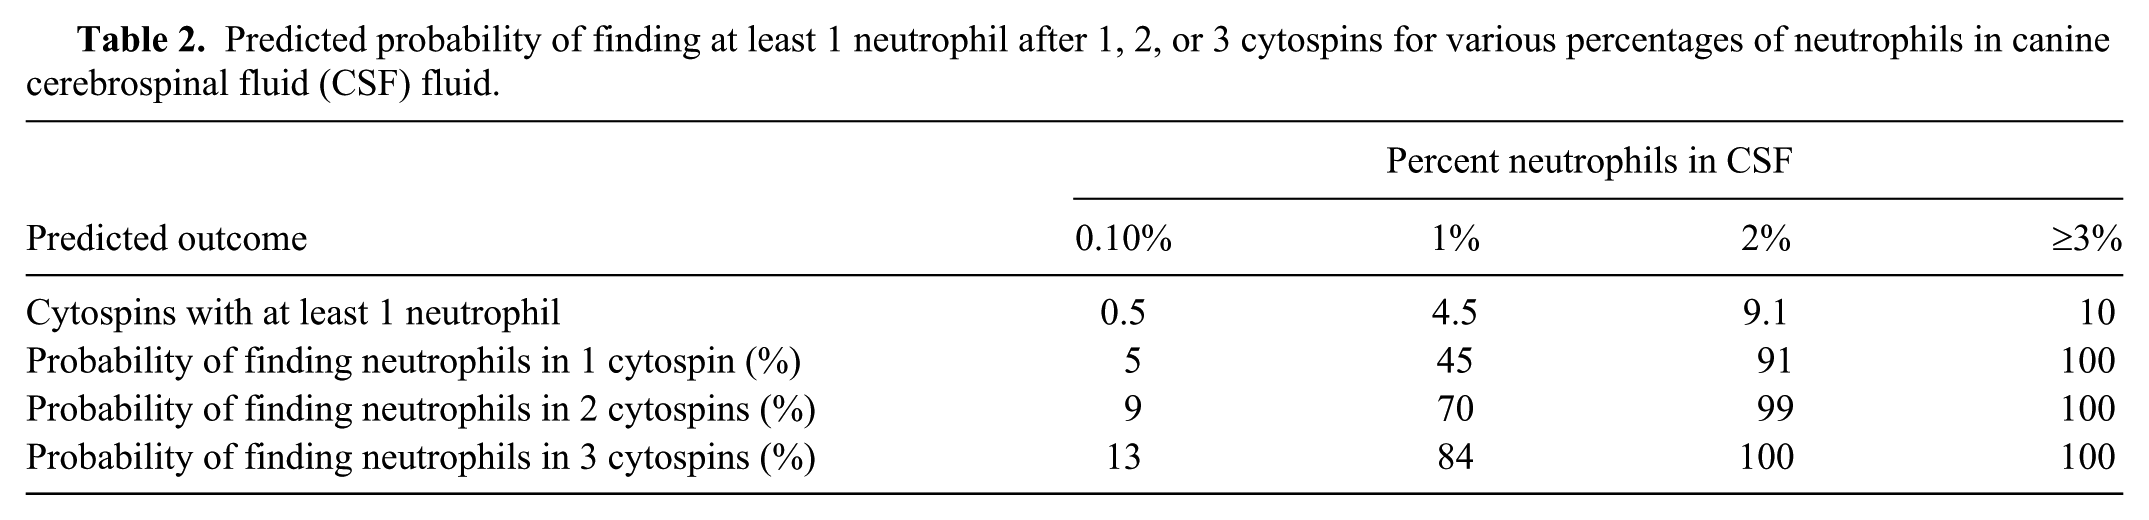
Predicted probability of finding at least 1 neutrophil after 1, 2, or 3 cytospins for various percentages of neutrophils in canine cerebrospinal fluid (CSF) fluid.
There were understandable differences found between the manual and calibrated pipetting techniques. The manual technique had an almost 10-fold increase in the number of foamy macrophages, which implies that foamy macrophages can be created during handling and are not necessarily inherent to the sample. Studies have shown that mononuclear cells deteriorate most quickly, and therefore may also be more susceptible to differences in technique. 12 The manual technique uses a larger uncalibrated drop and resulted in more cells per cytospin. It also had a greater SD. The CV for the total number of cells on a slide did not vary between techniques, which implies that both methods are similarly imprecise, averaging 31% (±18%). This is surprising because the manual technique would be expected to be less precise, as an equal volume of sample would not be applied to each cytochamber for centrifugation.
A clinically acceptable CV varies by test and, to our knowledge, has not been established for cytospins. Total allowable error recommendations were made for biochemical analytes by the American Society for Veterinary Clinical Pathology. 15 Total error (TE) is based on both test bias and CV using the formula TE = %bias + 2CV. 15 Assuming the bias is zero, the total error for canine CSF cytospins is at minimum 61%. This is far greater than the 30% total error for bilirubin, which is the maximum recommended for any biochemical test. 15 A relationship between the TNC count, total protein, and the total number of cells on a slide was present, but weak, and concurs with other studies.6,10,27 Although manual cell counts may be less accurate than those determined by automated analyzers, as is more common in human medicine,1,5 manual counts are representative of current veterinary clinical practice. Realistic economic restraints imposed by the cost and labor in determining automated CSF cell counts makes their routine use in clinical practice unlikely in the near future.3,22 The calibrated technique did have a stronger correlation (R2) with total cell yield than the manual technique. It would be reasonable to expect that the lower the count, the fewer cells that exist in the sample to potentially appear on a slide. However, this is not a strong relationship for either technique, and the number of cells that are present on a cytospin should not be used as an indicator of the accuracy of the leukocyte count. As hemorrhagic samples were excluded from this analysis, it is not unexpected that the RBC count did not correlate with any parameters.
The significance of some neutrophils in a CSF sample is debatable, especially when the sample has a low TNC count (<5 × 10⁶ cells/L; <5 cells/µL) and normal protein. In our study, the percentage of neutrophils in these low cellularity samples was higher than is sometimes reported as normal. 2 Even with the outlier (23% neutrophils) removed, 6 of 38 (16%) had >2% neutrophils on every cytospin. Overall, our study would suggest that the presence of some neutrophils in the absence of a pleocytosis may be a variation of normal.
The decision was made to include the outlier (23% neutrophils) in some analyses, as there was no justifiable reason to exclude it. The dog was a young research Beagle so it is possible that the dog had early neurologic disease such as steroid-responsive meningitis or granulomatous meningoencephalitis, which has been described in research Beagles.2,20 In a clinical setting, 23% neutrophils would be considered abnormal despite other normal findings, and further investigations into a neurologic condition would occur but would, however, remain difficult to interpret in a clinically normal patient. This highlights a weakness of this study in that dogs were not autopsied to confirm the absence of central nervous system disease. Although all of the dogs except 1 clinically affected dog were reported to be normal and healthy, with no clinical signs consistent with central nervous system (CNS) disease reported, there is the possibility that some of these dogs had occult CNS disease. Autopsies of the dogs would have allowed confirmation of a disease-free CNS, but the goal of our report was not to establish normal reference intervals but rather to focus on the inherent precision of a cytospin evaluation.
Interestingly, there was great variation in the number of neutrophils that were found on cytospins in samples that had any neutrophils. Table 1 details the variation in the number of cytospins that might have a neutrophil, and Figure 5 illustrates this. Of 31 samples where are least 1 cytospin had neutrophils, in 48% of the cases neutrophils were present in 5 or fewer of the 10 slides; in half of the cases with any neutrophils, half of the slides did not have any neutrophils on them. This raises the question of how many cytospins are necessary to accurately represent the percentage of neutrophils, or other infrequently present cells, although practical limitations on the quantity of CSF available in most patients is a limiting factor. All samples with 5% neutrophils had neutrophils on all 10 cytospins. Using the regression equation generated from the data in Figure 6 for dogs with ≤5% neutrophils, we predicted the probability of finding at least 1 neutrophil after 1, 2, or 3 cytospins in Table 2. If a patient has >3% neutrophils, even 1 cytospin should suffice to identify their presence, and the absence of any neutrophil on 1 cytospin suggests the neutrophil percentage is <3%. However, as the CV of the % neutrophils is calculated to be 146% (±96%), the unknowable true percentage is still quite variable; a sample that appears to have 3% neutrophils may have anywhere from 1% to 7%.
Occasional eosinophils, ependymal cells, and mitotic figures were also found in the low cellularity samples, although less frequently than neutrophils. The number of low cellularity samples with eosinophils, and percentage of eosinophils in those samples, is also higher than previously reported. 9 Prior studies of CSF do not quantify the number of mitotic figures that can be seen in a normal sample, and their significance is unknown, 9 but our study suggests that occasional mitotic figures can be found in low cellularity samples from clinically normal patients.
Footnotes
Authors’ contributions
PM Krimer contributed to conception and design of the study; contributed to analysis and interpretation of data; and drafted the manuscript. AC Haley and SB Harvey contributed to acquisition, analysis, and interpretation of data. SJ Schatzberg contributed to conception and design of the study, and contributed to analysis and interpretation of data. All authors critically revised the manuscript; gave final approval; and agreed to be accountable for all aspects of the work in ensuring that questions relating to the accuracy or integrity of any part of the work are appropriately investigated and resolved.
a.
BD Medical, Franklin Lakes, NJ.
b.
Nalgene Cryoware, Nalge Nunc International, Rochester, NY.
c.
Reichert improved Neubauer Bright Line, Thomas Scientific, Swedesboro, NJ.
d.
Hitachi 912, Roche Diagnostics, Indianapolis, IN.
e.
Aerospray hematology slide stainer, Wescor Inc., Logan, UT.
f.
Samco Scientific, Rochester, NY.
g.
Shandon single cytofunnel, Thermo Scientific, Pittsburgh, PA.
h.
Sigma Scientific, St. Louis, MO.
i.
Shandon cytospin 3 centrifuge, Thermo Scientific, Kalamazoo, MI.
j.
Acura 815, Socorex, Millville, NJ.
k.
Excel, Microsoft Corp., Redmond, WA.
l.
SAS, SAS Institute Inc., Cary, NC.
Declaration of conflicting interests
The author(s) declared no potential conflicts of interest with respect to the research, authorship, and/or publication of this article.
Funding
The author(s) disclosed receipt of the following financial support for the research, authorship, and/or publication of this article: Funding was received from University of Georgia College of Veterinary Medicine Clinical Research Grant 10-21-RR208-083.