
Abstract
In this study, we evaluated and compared the performance of transmission and attenuated total reflectance (ATR) infrared (IR) spectroscopic methods (in combination with quantification algorithms previously developed using partial least squares regression) for the rapid measurement of bovine serum immunoglobulin G (IgG) concentration, and detection of failure of transfer of passive immunity (FTPI) in dairy calves. Serum samples (n = 200) were collected from Holstein calves 1–11 days of age. Serum IgG concentrations were measured by the reference method of radial immunodiffusion (RID) assay, transmission IR (TIR) and ATR-IR spectroscopy-based assays. The mean IgG concentration measured by RID was 17.22 g/L (SD ±9.60). The mean IgG concentrations predicted by TIR and ATR-IR spectroscopy methods were 15.60 g/L (SD ±8.15) and 15.94 g/L (SD ±8.66), respectively. RID IgG concentrations were positively correlated with IgG levels predicted by TIR (r = 0.94) and ATR-IR (r = 0.92). The correlation between 2 IR spectroscopic methods was 0.94. Using an IgG concentration <10 g/L as the cut-point for FTPI cases, the overall agreement between TIR and ATR-IR methods was 94%, with a corresponding kappa value of 0.84. The sensitivity, specificity, positive predictive value, negative predictive value, and accuracy for identifying FTPI by TIR were 0.87, 0.97, 0.91, 0.95, and 0.94, respectively. Corresponding values for ATR-IR were 0.87, 0.95, 0.86, 0.95, and 0.93, respectively. Both TIR and ATR-IR spectroscopic approaches can be used for rapid quantification of IgG level in neonatal bovine serum and for diagnosis of FTPI in dairy calves.
Introduction
Adequate passive transfer of maternal immunoglobulin (Ig) via colostrum is critical for the optimal health and performance of dairy calves. 6 Failure of calves to ingest and/or absorb sufficient amounts of colostral Ig (<10 g/L) results in a condition known as failure of transfer of passive immunity (FTPI). 17 There is a recognized association between FTPI and calf morbidity, mortality, and reduced daily gain in the first few months of life.12,34,50 Moreover, FTPI reduces long-term productivity, decreases milk yield, and increases culling rates during the first lactation of dairy heifers.10,19 As a consequence of FTPI in affected calves, dairy producers experience increased production costs and reduced profitability. It is vitally important for dairy producers and veterinarians to ensure that dairy calves receive and absorb a sufficient quantity of good-quality colostrum within the first hours of life.22,27
Passive transfer of immunity in calves may be identified by several methods. The radial immunodiffusion (RID) assay, enzyme-linked immunosorbent assay (ELISA), and automated turbidimetric immunoassay directly measure serum IgG concentrations.1,16 Refractometry, the sodium sulfite turbidity test, zinc sulfate turbidity test, serum gamma-glutamyl transferase activity, and whole blood glutaraldehyde coagulation can all be used to estimate serum IgG concentration indirectly.4,26,51 RID is currently considered the reference method for measuring IgG concentration and assessing FTPI in dairy calves. 25 The method is laboratory-based, relatively expensive, and requires a minimum of 18–24 hr to obtain results. Thus, RID is not practical for routine, on-farm monitoring of the adequacy of transfer of passive immunity.2,32
Infrared (IR) spectroscopy in combination with multivariate data analysis has emerged as an alternative technique for assessing FTPI in several species and has the following advantages: small sample volume requirement, rapid turnaround time, minimal disposable materials, low cost, and robust predictions.41–43 Methods employing IR spectroscopy have been successfully used to determine nutrient contents of milk,36,37 colostrum IgG concentration, 33 feed composition, and the kinetics of nutrient degradation in the rumen.20,31 It has also been utilized in screening for metabolic diseases such as ketosis 18 and foodborne pathogens. 7 However, there are a number of IR spectroscopic sampling techniques. Two of the most common techniques are transmission IR (TIR) spectroscopy and attenuated total reflectance IR (ATR-IR) spectroscopy. TIR spectroscopy has been used for decades in different fields, including chemistry, medicine, biology, and geology. 45 TIR is based on the absorption of IR radiation at specific wavelengths as it passes through a sample. 46 ATR-IR spectroscopy measures the changes that occur in a totally internally reflected IR beam when the beam comes into contact with a sample. 44 ATR-IR has the advantage of reduced sample preparation time, and is relatively impervious to variations in sample thickness compared to TIR, making collection of high-quality spectra easier.30,44,46 The objective of our study was to investigate the utility of previously built partial least squares (PLS) models for quantifying IgG for a new set of samples and to compare the performance of TIR and ATR-IR spectroscopic approaches (in combination with multivariate analysis) as the basis to predict IgG levels in bovine serum, and to identify FTPI in dairy calves.
Materials and methods
Serum samples
Blood samples were collected from 203 Holstein calves 1–11 days of age. Calf samples came from 5 different commercial dairy farms in Prince Edward Island and 1 in Nova Scotia between June and October 2013. Whole blood was collected by jugular venipuncture, using a 20-gauge, 1-inch (2.54-cm) hypodermic needle, a into a sterile, plastic, evacuated tube without anticoagulant. a Samples were transported in a cooler at 4°C to the Maritime Quality Milk Laboratory, University of Prince Edward Island (UPEI, Canada). Serum was separated by centrifugation at 1,500 × g for 10 min within 5 hr of collection. Serum from Nova Scotia samples was separated by similar centrifugation methods at a local veterinary clinic and then frozen at −20°C for batch transport to UPEI. Serum samples were divided into 3 aliquots and stored at −80°C. This study was conducted in accordance with the Canadian Council on Animal Care (CCAC) guidelines 5 under a protocol approved by the Animal Care Committee at UPEI.
Transmission infrared spectroscopy
The sampling and data acquisition protocols matched those used previously for developing the TIR spectroscopy bovine IgG assay. 14 Serum samples were thawed at room temperature (20–24°C) and then vortexed for 10 sec. Samples were then diluted (1:1) with deionized sterile water and vortexed at a maximum of 2,700 rpm for 10 sec. After dilution, 6 replicates were made for each serum sample by evenly spreading 10-μL aliquots of diluted sample onto 5 mm in diameter wells within an adhesive-masked, 96-well silicon microplate. 32 An empty well served as the background reference for each microplate. The loaded microplates were allowed to dry at room temperature (20–24°C) for 2 hr, resulting in thin dried films. For collection of TIR spectra, the microplates were inserted into a multisampler b interfaced with an IR spectrometer c equipped with a deuterium tryglycine sulfate detector and controlled by proprietary software. d A total of 1,218 (203 × 6) spectra were collected over the wave number range between 4,000 and 400 cm−1 with a nominal resolution of 4 cm−1, with 512 scans collected for data acquisition.
Attenuated total reflectance infrared spectroscopy
The sampling and data acquisition protocols matched those used previously for developing the ATR-IR spectroscopy bovine IgG assay. 13 The ATR-IR spectra of serum samples were acquired using a customized 3-bounce ATR mid-infrared spectrometer. e Prior to applying each sample, a background spectrum was collected over the wave number range of 4,000–650 cm−1 with a resolution of 8 cm−1, and 32 scans were coadded for each spectrum. Thawed serum samples were diluted (1:1) with deionized sterile water and vortexed at a maximum of 2,700 rpm for 10 sec to homogenize the samples. Following dilution, 5 replicates were made for each sample by evenly spreading 5-µL aliquots of diluted sample onto the sample stage and air-drying using a domestic hair dryer. Samples were completely dried within 3–4 min, forming a thin film on the stage. Before each successive test, the stage of the optics module of the spectrometer was cleaned with 100% ethanol, and a new background spectrum was collected. A total of 1,015 (203 × 5) ATR-IR spectra were collected and saved in spectrum (SPC) format.
Spectral preprocessing
Spectra were collected and converted into printable format (PRN) using manufacturer’s software. f The PRN format spectral data was imported into a commercial program, g and further data analysis was performed using scripts written by the authors. Spectra collected from both spectroscopies were preprocessed using the same techniques used for PLS model building.13,14 Spectra were preprocessed using the Savitzky–Golay method (second order polynomial function with 9 point smoothing) to generate first and second order derivative spectra for TIR and ATR-IR spectroscopic methods, respectively. 39 The derivative spectra then were normalized using a vector normalization procedure to reduce the effect of light scattering, followed by spectral subregion selection at 3,700–2,600 cm−1 and 1,800–1,300 cm−1 wave number regions, which exhibited the strongest absorptions in the original spectra. Subsequently, spectrum outlier detection was performed using Dixon Q-test8,35 at each wave number. Spectra were designated as outliers if >50% of absorbance values were outside the 95% confidence level, and excluded from further analysis. The remaining spectrum of each sample (after removal of outlier spectra if applicable) was used for subsequent analysis.
Prediction of IgG
Previously developed PLS models built for prediction of IgG concentration from TIR spectra 14 and ATR-IR spectra 13 were used to predict serum IgG concentrations in the 203 calf samples. These PLS models were built using 200 serum samples collected from calves and adult cows. 13 The IgG concentration was predicted from each spectrum, and subsequently the IgG concentration for each calf serum sample was calculated as the average of replicate IgG values.
Radial immunodiffusion assay
A commercial RID assay h was used as the reference method for determining calf IgG serum concentrations. The RID assay was performed according to manufacturer’s instructions, using 5 µl of undiluted serum in each well. Diameters of precipitated rings were measured after 18–24 hr of incubation at room temperature, using a handheld caliper. Each of the samples and assay standards were tested in replicates of 5. The average IgG values of the replicates of the assay standards were used to build a calibration curve that was subsequently used to determine IgG concentrations for the serum samples. The final IgG concentration for each sample was determined by calculating the average of the 5 replicates. Serum samples with IgG concentrations greater than the manufacturer’s stated performance range for the assay (>30 g/L) were diluted (1:1) with deionized sterile water and retested. Diluted serum samples with IgG concentrations outside the performance range for the assays, as determined by the manufacturer, were excluded from further analysis (n = 3).
Statistical analysis
Descriptive statistics for the results of RID, TIR, and ATR-IR spectroscopic approaches were calculated. The IgG concentrations for each sample as predicted by TIR and ATR-IR spectroscopy were plotted against each other, and against the IgG concentrations measured by the reference RID method. From these plots, Pearson correlation coefficients (r) and concordance correlation coefficients were determined. A Bland–Altman plot was used to assess the interchangeability of the 2 IR spectroscopic methods and the RID assay by testing the difference between values as determined by these methods. The level of agreement between the IgG values for TIR and ATR-IR spectroscopic methods was assessed using the McNemar test 23 for paired data to check for bias, followed by calculation of the kappa statistic. The precision of the RID–, TIR–, and ATR-IR–based analytical methods was investigated. The mean and standard deviation (SD) were calculated for the replicates of each serum sample, and from these a modified coefficient of variation (CV* = CV[1 + (1/4n)]; n = 5 for RID and ATR-IR assays, n = 6 for TIR assay) was determined. 38 For comparison, the CV* of each sample tested by RID, TIR, and ATR-IR spectroscopic methods was calculated and plotted against the mean IgG concentration. The diagnostic test characteristics (sensitivity, specificity, predictive values, and accuracy) were calculated to evaluate the clinical applicability of TIR and ATR-IR methods for the diagnosis of FTPI, using IgG concentrations of <10 g/L (as measured by RID test) as FTPI cases. i
Results
Descriptive statistics
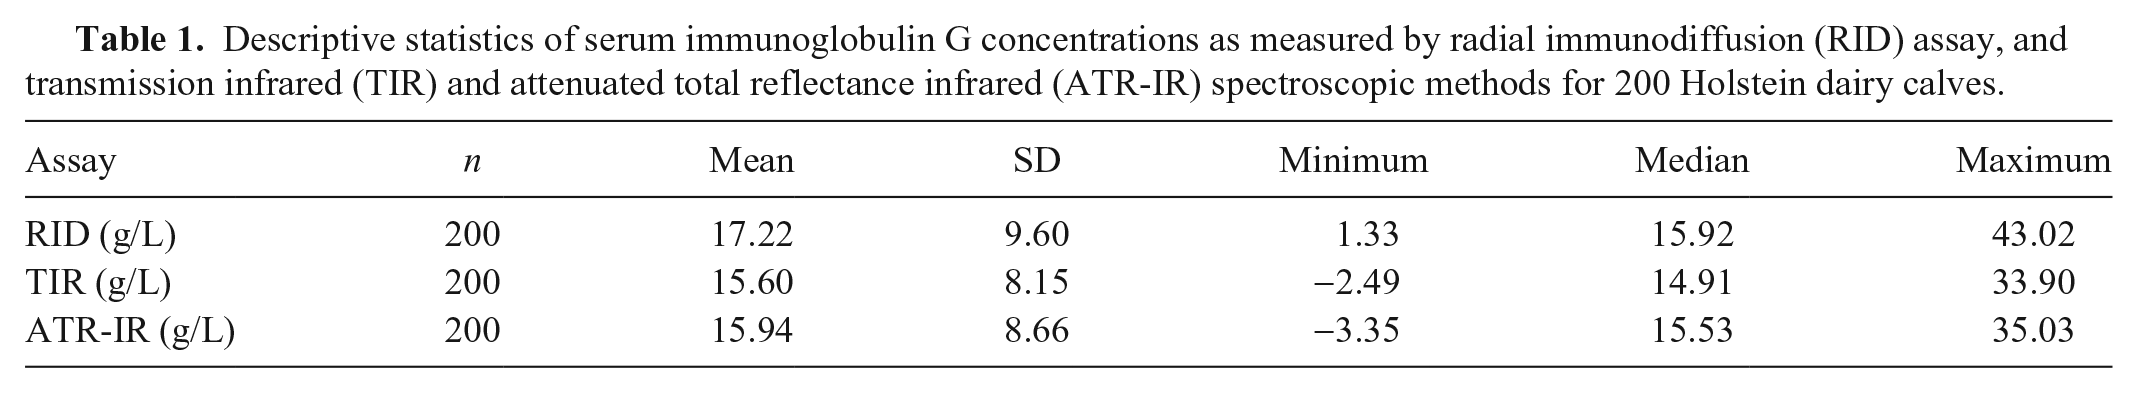
Descriptive statistics (mean, standard deviation, minimum, median and maximum) for IgG concentrations measured by the reference RID assay and predicted by TIR and ATR-IR spectroscopy-based assays for samples within the RID reference range (n = 200) are shown in Table 1. The frequency distribution of the RID IgG concentrations was skewed to the right (Fig. 1). However, distribution of IgG concentrations predicted by TIR and ATR-IR spectroscopy-based assays were approximately normally distributed (Fig. 1).
Descriptive statistics of serum immunoglobulin G concentrations as measured by radial immunodiffusion (RID) assay, and transmission infrared (TIR) and attenuated total reflectance infrared (ATR-IR) spectroscopic methods for 200 Holstein dairy calves.
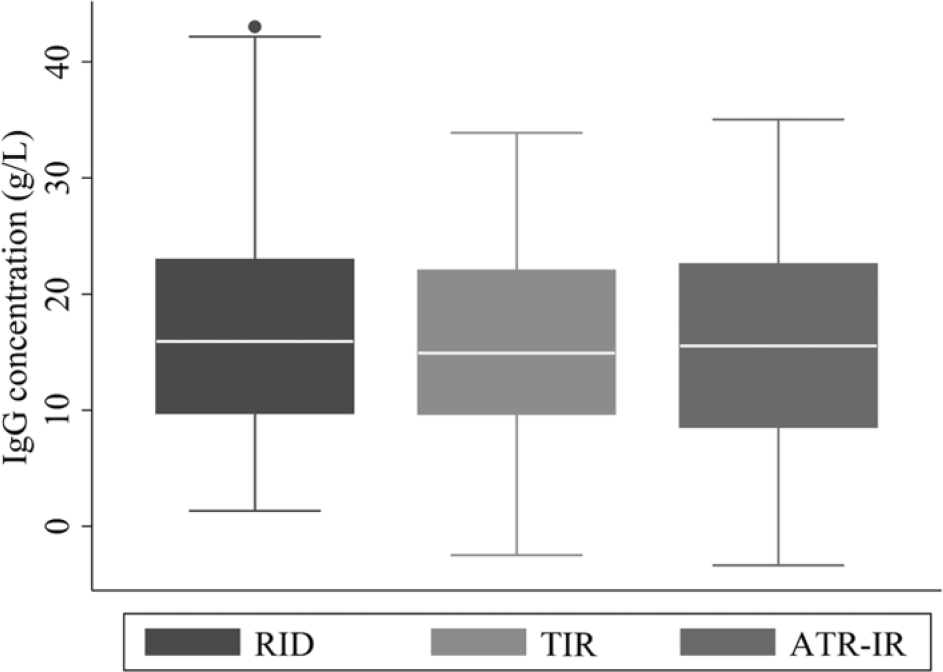
Frequency distribution of serum immunoglobulin G concentrations measured by a radial immunodiffusion (RID) assay, and transmission infrared (TIR) and attenuated total reflectance infrared (ATR-IR) spectroscopic methods for 200 Holstein dairy calves.
Agreement between RID and IR spectroscopic methods
The RID IgG concentrations were positively correlated with those predicted by TIR (r = 0.94; Fig. 2A) and ATR-IR (r = 0.92; Fig. 2B) spectroscopy. Similarly, the IgG concentrations predicted by TIR and ATR-IR spectroscopy-based assays were positively correlated (r = 0.94; Fig. 2C). The concordance correlations between values for RID and both IR spectroscopic methods was 0.91.
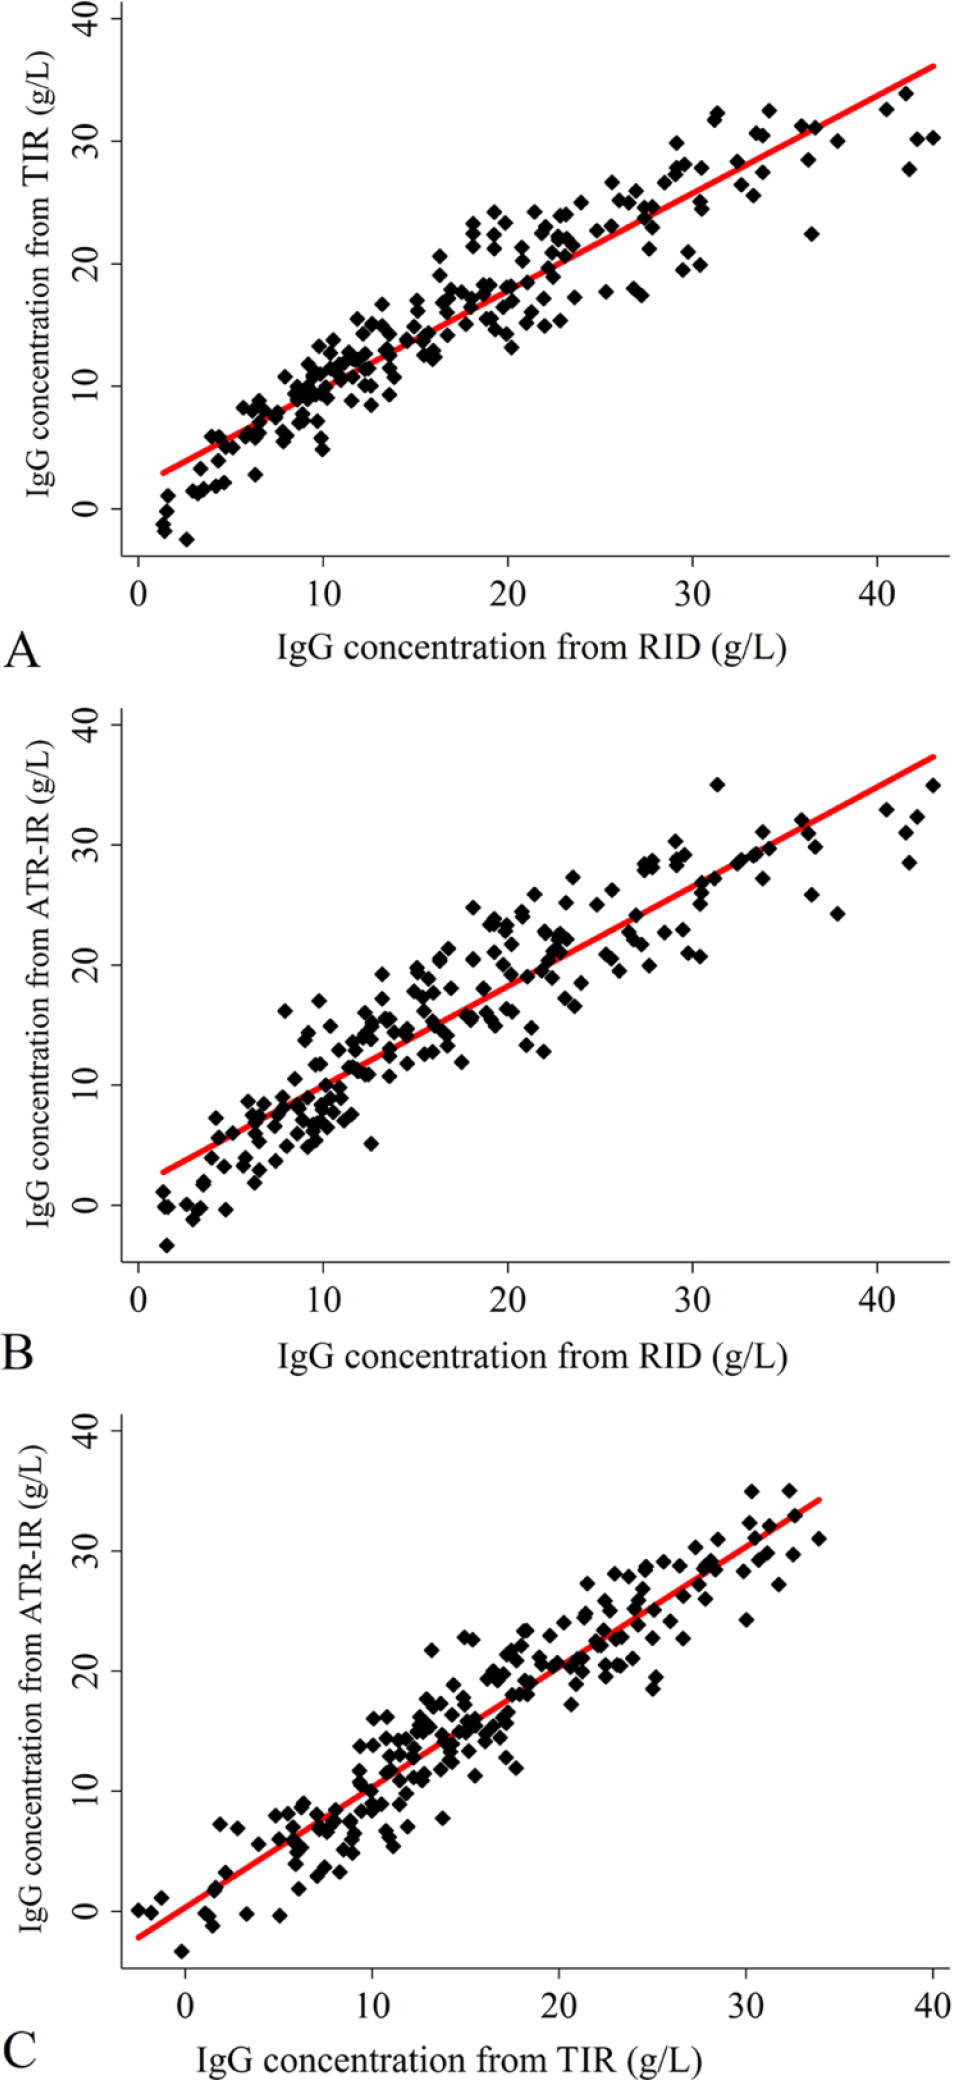
Scatter plots comparing (
The Bland–Altman plot (Fig. 3) revealed that the mean value of the difference between IgG concentrations provided by the RID and the TIR method was −1.62 g/L (Fig. 3A), and −1.28 g/L between RID and the ATR-IR method (Fig. 3B), indicating no obvious bias between these methods. The 95% confidence interval for TIR and ATR-IR ranged from −8.38 to 5.15 g/L and −8.67 to 7.10 g/L, respectively.
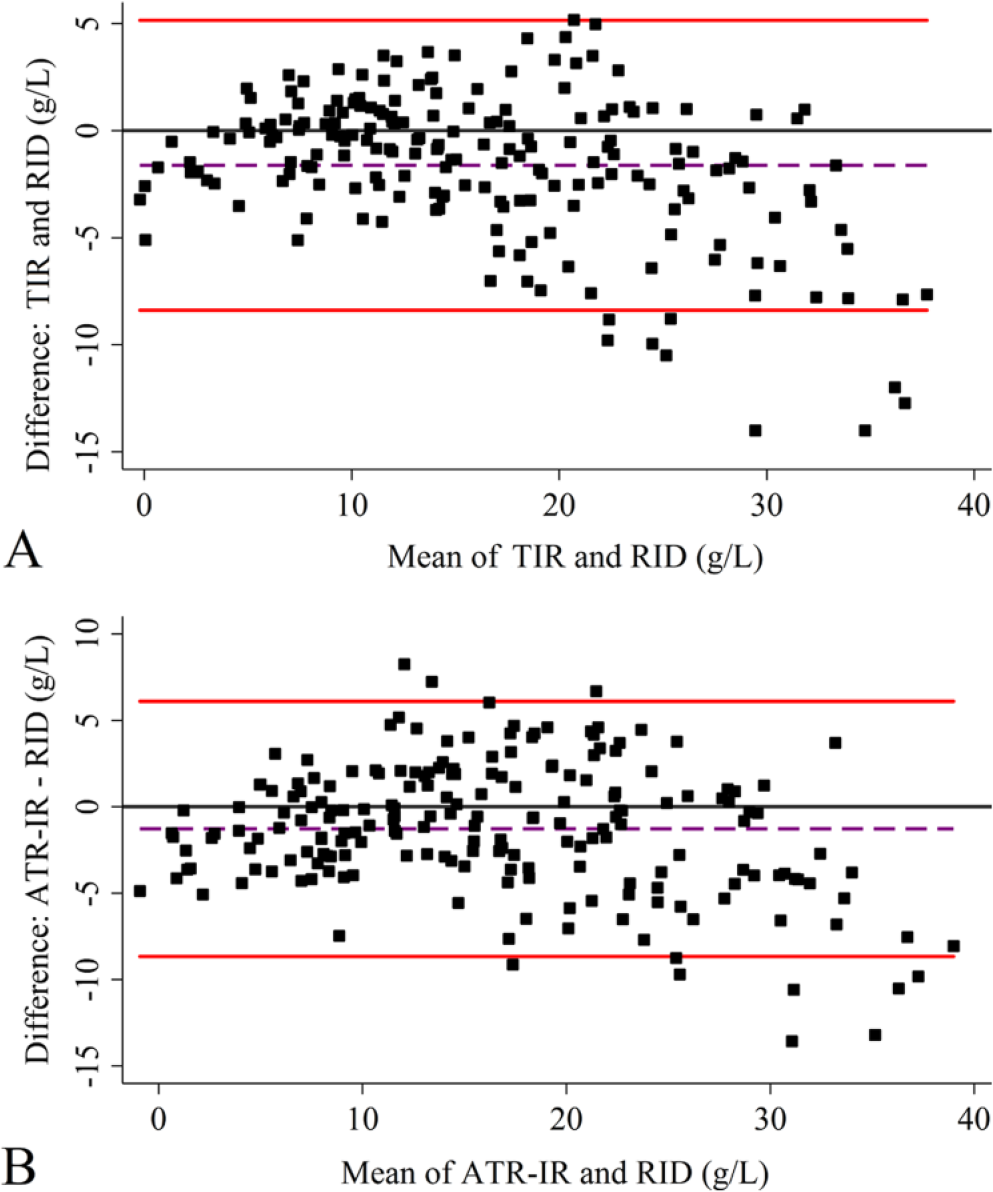
Bland–Altman plots.
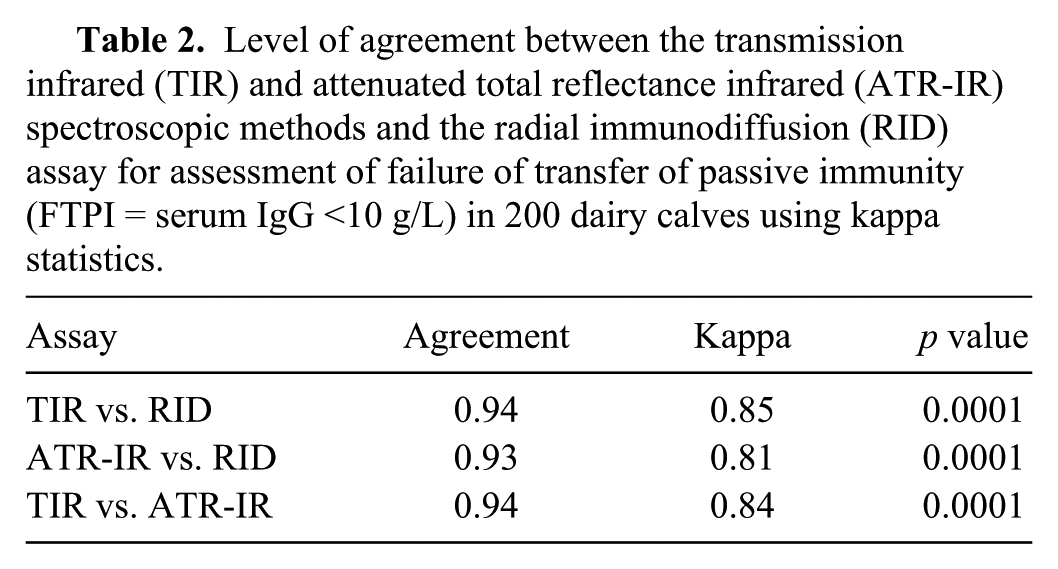
The overall percent of agreement between TIR and ATR-IR was 94%, with a corresponding kappa value of 0.84 (Table 2). The McNemar test for the sensitivity and specificity comparisons showed no significant difference (p > 0.05) in the proportion of calves classified as having FTPI by either IR spectroscopic methods.
Level of agreement between the transmission infrared (TIR) and attenuated total reflectance infrared (ATR-IR) spectroscopic methods and the radial immunodiffusion (RID) assay for assessment of failure of transfer of passive immunity (FTPI = serum IgG <10 g/L) in 200 dairy calves using kappa statistics.
Precision of RID and IR spectroscopic methods
There was no obvious correlation with the IgG concentrations and CV* for the RID method (Fig. 4A), but the CV* for both TIR (Fig. 4B) and ATR-IR (Fig. 4C) methods decreased with increasing IgG concentrations. The mean CV* for RID, TIR, and ATR-IR methods were 8.3%, 11%, and 28%, respectively.
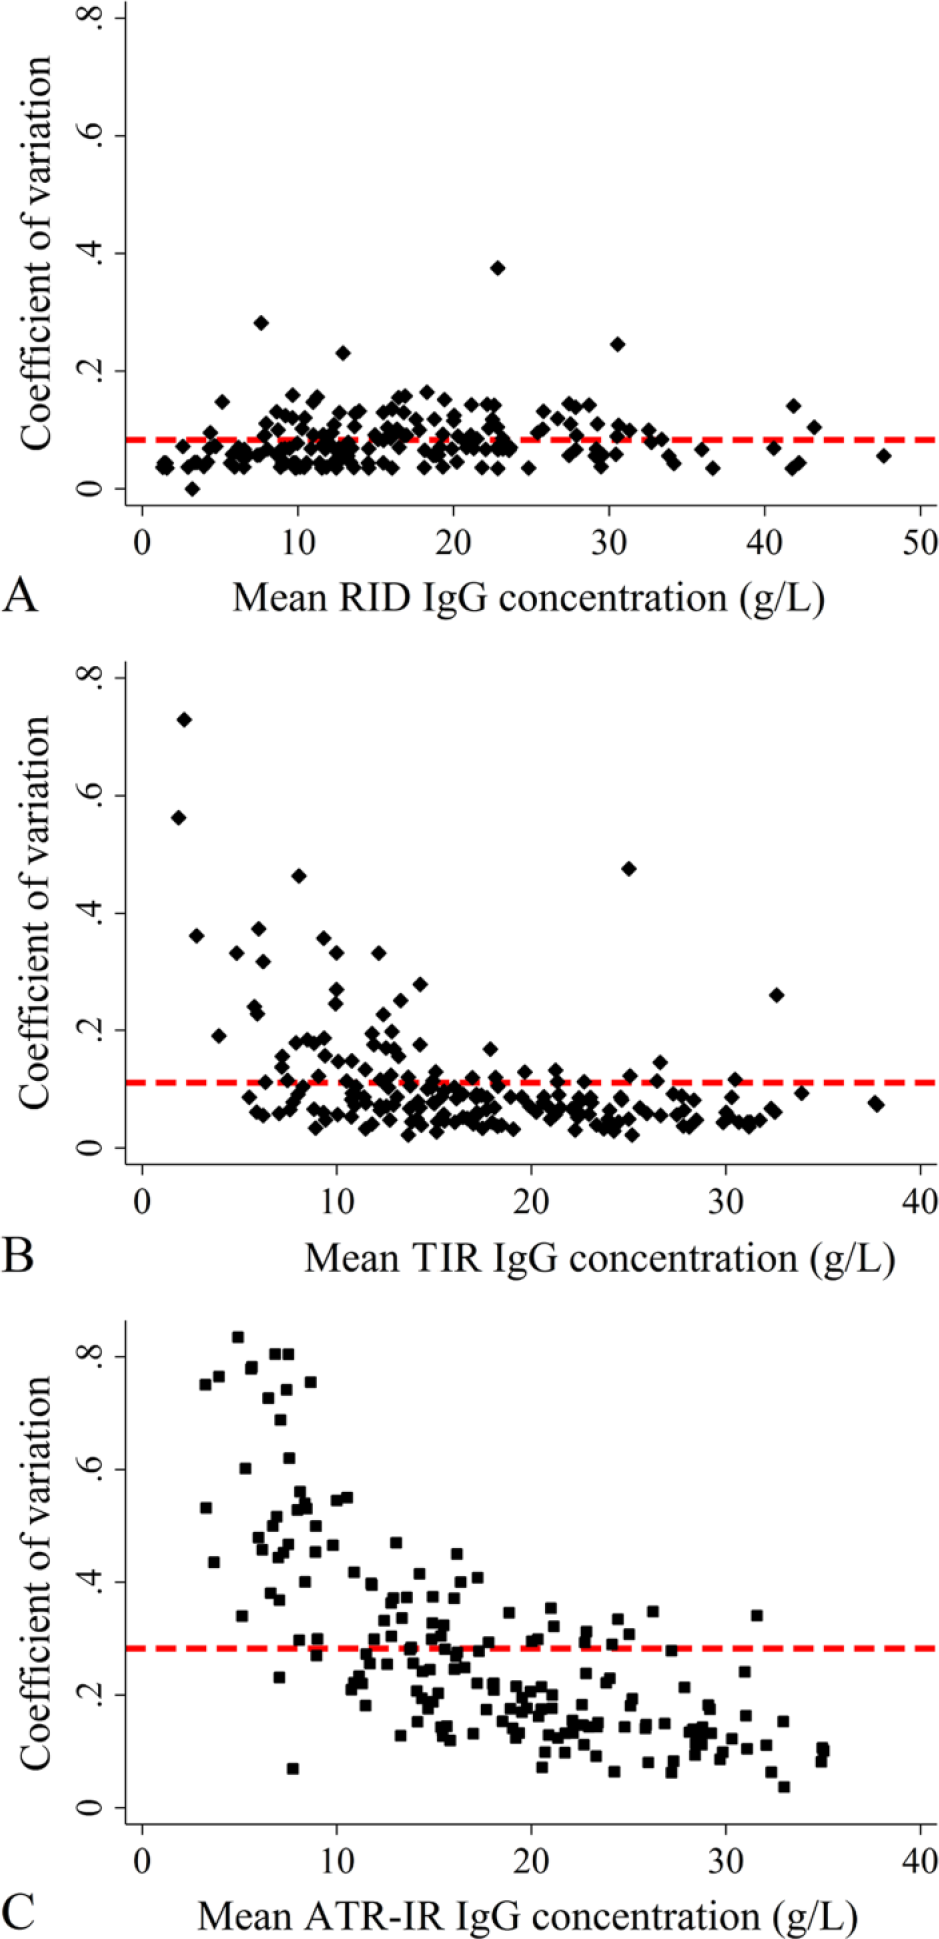
Modified coefficient of variation (CV*) plots for (
Test characteristics of IR spectroscopic methods
Fifty-five samples had IgG concentrations <10 g/L according to the RID method, resulting in a true FTPI prevalence of 27.5% (Table 3). The number of samples that had IgG concentrations <10 g/L according to the TIR (n = 53) and ATR-IR (n = 56) methods resulted in an apparent FTPI prevalence of 26.5% and 28%, respectively.
Diagnostic test characteristics for transmission infrared (TIR) and attenuated total reflectance infrared (ATR-IR) spectroscopic methods for assessment of failure of transfer of passive immunity (FTPI) in 200 dairy calves, using IgG concentration 10 g/L as a cutoff value and a true FTPI prevalence of 27.5%.*
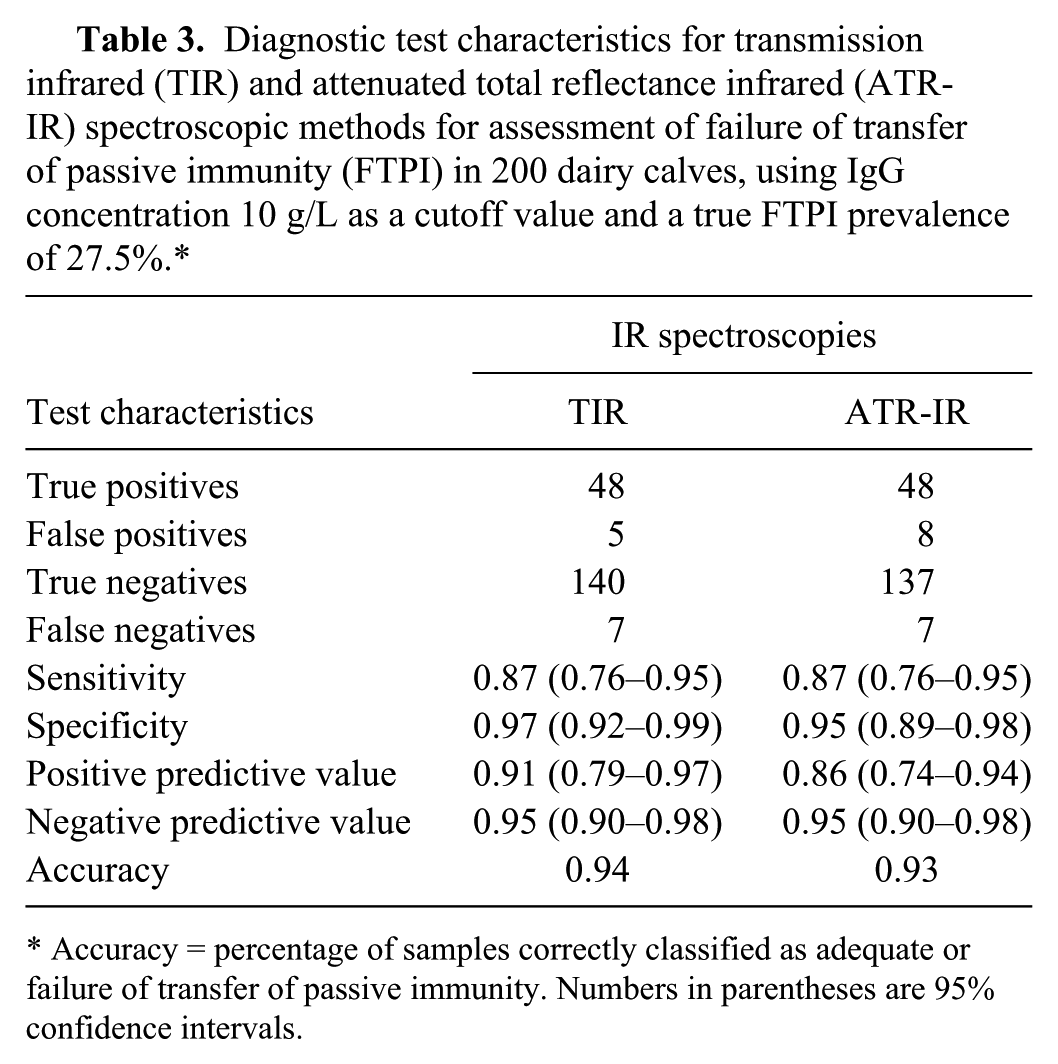
Accuracy = percentage of samples correctly classified as adequate or failure of transfer of passive immunity. Numbers in parentheses are 95% confidence intervals.
For the TIR method, 5 and 7 samples were misclassified as false positives and false negatives, respectively. These samples corresponded to samples with RID IgG values of 10.14–13.59 g/L and 7.93–9.84 g/L, respectively. For the ATR-IR method, 8 samples were misclassified as false positive with RID IgG values of 10.22–12.60 g/L, and 7 samples were misclassified as false negative with RID IgG values of 7.93–9.84 g/L.
Discussion
The study results confirmed that IR spectroscopy, in combination with a quantification algorithm developed using multivariate data analysis, is suitable for the quantification of IgG in bovine serum and identification of FTPI in dairy calves. The 2 PLS models previously developed as the basis for analytical methods based on TIR and ATR-IR spectroscopic measurements were validated by their ability to accurately quantify IgG concentrations in a completely independent set of serum samples. The average IgG concentration for this new set of serum samples was higher (Table 1) than the corresponding average of IgG concentrations used for the original PLS model development.13,14 The prevalence (27.5%) of calves with IgG concentration <10 g/L was correspondingly lower in this dataset than that used for the original model development (prevalence 51%), and falls within the range of FTPI prevalence (19–40%) reported by the National Animal Health Monitoring System. 49
The correlation coefficient plots for the IgG concentrations predicted by both TIR and ATR-IR spectroscopy-based assays compared with the RID determinations were similar to those determined between the 2 IR methods (Fig. 2). In comparison, these values are higher than those reported previously for counterpart TIR-based assays for equid IgG21,32 and camelid IgG levels, 3 and for the ATR-IR method described for canine IgG concentrations. 40 Furthermore, the correlation coefficients between IgG concentrations predicted by both IR spectroscopic methods and the reference RID IgG assay were higher than those reported for refractometry,9,28 similar to those of near-IR spectroscopy, 52 but lower than the value reported for automated turbidimetric immunoassay. 1
The level of agreement between results from the 2 IR spectroscopic methods and the RID assay for detecting FPTI was high, as assessed using kappa statistics (Table 2). Similarly, the ATR-IR spectroscopy showed good agreement (94%) with the TIR spectroscopy. This indicates that the 2 spectroscopic methods demonstrate a high level of agreement on the classification of calves with and without FTPI. The McNemar test showed a nonsignificant difference (p > 0.05) between proportions of calves classified as having FTPI by the IR methods, indicating that the 2 spectroscopic assays performed similarly for FTPI assessment in calves. However, TIR showed higher precision than ATR-IR (Fig. 4). The same results were reported during PLS model building for IgG concentrations of bovine, 14 equid, 21 camelid, 3 and canine samples. 40 The lower precision of the ATR-IR method is likely associated with the variability in sample dryness for each replicate, and to the low number of ATR-IR scans (32 scans), as compared to the TIR method (512 scans).44,46
Both IR-based analytical methods showed excellent specificity and good sensitivity, equivalent to or better than most methods previously reported to assess dairy calves for FTPI.24,47,48 Both methods correctly identified the majority of FTPI cases, and the misclassified samples had RID IgG concentrations very close to the diagnostic cutoff of 10 g/L. This suggests that the likelihood of consequential misdiagnosis is small; the false-negative samples correspond to only partial FTPI, with minimal risk of calf morbidity and mortality.15,24
The positive and negative predictive values (PPV and NPV, respectively) vary with both test performance and the population FTPI prevalence. 32 In North America, the reported prevalence of FTPI in dairy calves ranges from 19% to 40%.29,49 When the proportion of calves with FTPI increases, NPV decreases. Because the sensitivity of both IR spectroscopy-based assays was the same, at true prevalence range of FTPI in North America of 19–40%, the NPV can be calculated at 97% and 92%, respectively. From NPV, the PPV of a negative test (PPVN = 1 − NPV) 11 can be evaluated. Thus, the probability of FTPI-positive calves being classified by the IR-based assay as test-negative (would not receive treatment) would be 3% (0.03) and 8% (0.08) for herds with FTPI prevalences of 19% and 40%, respectively. The PPV was numerically higher for the TIR-based assay than for the ATR-IR assay. As a result, the number of normal animals that were misidentified as FTPI (and receive additional care and farm inputs) was slightly higher using the ATR-IR assay as compared to the TIR method. While the TIR-based assay had a slightly higher specificity, PPV, and precision than the ATR-IR–based assay, it remains that the TIR-based assay is a laboratory-based assay. In contrast, commercially available ATR-IR instruments are robust and portable, making them more appropriate for use in field situations (e.g., the Agilent 4500, Agilent, Danbury, Connecticut). This opens the door for dairy producers and veterinarians to confirm adequate transfer of passive immunity to their calves on farms or in veterinary clinical settings with ATR-IR spectroscopy.
Footnotes
Acknowledgements
We thank Natasha Robinson and Cynthia Mitchell for their technical assistance and data collection; Dr. Alan Fredeen and Jennafer Bent from Dalhousie Agriculture Campus, Truro, Nova Scotia, for providing the Nova Scotia samples; and Dr. Siyuan Hou for providing assistance and guidance with the MATLAB script writing.
Authors’ contributions
I Elsohaby contributed to conception and design of study; contributed to acquisition, analysis, and interpretation of data; and drafted the manuscript. JT McClure contributed to design of study; contributed to acquisition and interpretation of data; and critically revised the manuscript. CB Riley contributed to conception of study; contributed to acquisition and interpretation of data; and critically revised the manuscript. RA Shaw contributed to conception of study; contributed to acquisition and analysis of data; and critically revised the manuscript. GP Keefe contributed to design of study; contributed to acquisition and analysis of data; and critically revised the manuscript. All authors gave final approval and agreed to be accountable for all aspects of the work in ensuring that questions relating to the accuracy or integrity of any part of the work are appropriately investigated and resolved.
a.
BD Vacutainer precision glide, Becton Dickinson Co., Franklin Lakes, NJ.
b.
HTS-XT autosampler, Bruker Optics Ltd, Coventry, United Kingdom.
c.
Tensor 37, Bruker Optics Ltd, Coventry, United Kingdom.
d.
OPUS version 6.5, Bruker Optics Ltd, Coventry, United Kingdom.
e.
Cary 630 FTIR spectrometer, 3B Diamond ATR Module ZnSe element; Agilent Technologies, Danbury, CT.
f.
GRAMS/AI version 7.02, Thermo Fisher Scientific Inc., Waltham, MA.
g.
MATLAB version R2012b, The MathWorks Inc., Natick, MA.
h.
Bovine IgG RID kit, Triple J Farms, Bellingham, WA.
i.
STATA 13 software, Stata Corp., College Station, TX.
Declaration of conflicting interests
The author(s) declared no potential conflicts of interest with respect to the research, authorship, and/or publication of this article.
Funding
The author(s) disclosed receipt of the following financial support for the research, authorship, and/or publication of this article: This study was funded by the Atlantic Canada Opportunities Agency. Personal funding for I. Elsohaby was provided by Mission Office, Ministry of Higher Education and Scientific Research, Egypt, and Innovation PEI, Canada.