
Abstract
Colostrum may have the ability to improve the diagnostic accuracy of some tests when compared to serum for important livestock diseases because of the high concentrations of immunoglobulins present within this sample type. The ELISA for Johne’s disease is one such test, as it suffers from low sensitivity when testing serum samples collected during the subclinical stage of infection. Blood and colostrum samples were collected from 34 Jersey dairy cows and tested for antibodies against Mycobacterium avium subspecies paratuberculosis (MAP) by ELISA. Fecal samples were also collected and tested by a high-throughput Johne’s polymerase chain reaction (HT-J PCR) assay and fecal culture (FC), with the latter being used as the reference test. A receiver operating characteristic (ROC) analysis was performed, and the area under the curve (AUC) was calculated. The HT-J PCR and FC results were also compared. Of the 34 cows in this study, 4 had FC results consistent with MAP infection. The HT-J PCR did not identify any FC-positive cows. Using a 1:20 dilution and sample-to-positive (S/P) ratio cutoff threshold of 0.15, the relative sensitivity values of both serum (AUC 0. 56) and colostrum (AUC 0.63) were 0%. With lower sample dilutions, the relative sensitivity values of serum were 0% (1:2, AUC 0.62; 1:5, AUC 0.55); however, the relative sensitivity value of colostrum was 75% (95% confidence interval [CI]: 19–99%) at a dilution of 1:5, S/P ratio cutoff threshold of 0.15, and AUC of 0.73 (95% CI: 0.55–0.87). The testing of colostrum samples for MAP-specific antibodies by ELISA may provide improved identification of animals in the early stages of infection with MAP when compared with serum samples.
As a result of the selective transfer of maternal immunoglobulins into colostrum prior to parturition, colostrum contains higher concentrations of immunoglobulins than serum. 2 Concentrations of immunoglobulins in cow colostrum can range from 5 times 2 to 10 times 1 greater when compared with serum. The higher concentrations of immunoglobulins found in colostrum should improve the utility of diagnostic tests by improving the sensitivity, provided specificity is maintained. Such an improvement would be useful for diseases such as Johne’s disease, where infected animals initially respond with a strong cell-mediated immune (CMI) response, rather than a humoral immune response. 9 Although the enzyme-linked immunosorbent assay (ELISA) is a relatively inexpensive and simple-to-perform tool for the diagnosis of Johne’s disease, it suffers from poor test sensitivity during the subclinical stage of infection, 8 as the ELISA measures the humoral response to infection. There is some evidence to suggest that colostrum could improve diagnostic test sensitivity using antibody ELISA. A previous study 4 has demonstrated a significant increase in diagnostic sensitivity of an antibody ELISA when comparing colostrum and serum in sheep vaccinated against Johne’s disease. The aim of our study was to determine whether colostrum could achieve a higher diagnostic accuracy when compared to serum for the detection of Mycobacterium avium subspecies paratuberculosis (MAP)-specific antibodies using a commercial ELISA in a commercial dairy herd.
A dairy herd of Jersey cows located in the state of Victoria, Australia was selected for testing. This herd was classified by the Department of Environment and Primary Industries as infected following confirmatory tests for Johne’s disease in the recent past. Samples of colostrum, blood, and feces were collected from 34 Jersey cows, which ranged in age from 2 to 7 years. The samples of colostrum were collected within 12 hr of parturition, and the blood and fecal samples were collected 30–60 days postparturition. The samples of colostrum were initially stored at −20°C until all colostrum samples had been collected. The blood and colostrum samples were transported overnight on ice following collection. The blood samples were centrifuged at 1,157 × g for 10 min to separate the serum, and the samples of colostrum and serum were stored at −80°C until testing of samples could be performed.
The fecal samples were transported overnight on ice and were tested using fecal culture (FC, reference test; http://www.scahls.org.au/Procedures/Documents/ANZSDP/Johnes_Disease_Quality_Plan_2010.pdf) and a high-throughput Johne’s polymerase chain reaction (HT-J PCR) assay (http://www.scahls.org.au/LabTests/Documents/Approved/HT-J_test_method_protocol.pdf), with both tests being performed by the Biosciences Research Division of the Department of Environment and Primary Industries (Bundoora, Victoria, Australia). Cows were determined to be infected with MAP based on a positive FC result. The serum and colostrum samples were tested using a MAP antibody ELISA. a All samples were diluted 1:2, 1:5, 1:10, 1:20, 1:40, 1:80, and 1:100 using the diluent supplied with the ELISA kit. Each sample was tested in triplicate using 100-μL aliquots. Absorbance (optical density, OD) was measured at 250 nm. b The results were expressed as sample-to-positive (S/P) ratios.
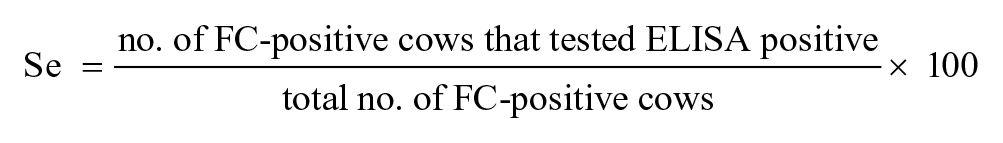
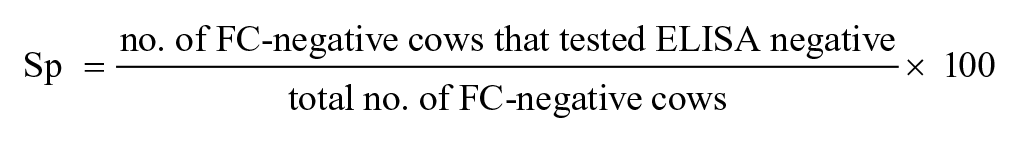
A receiver operating characteristic (ROC) analysis was performed to determine the sensitivity and specificity of serum and colostrum relative to FC. Relative sensitivity (Se) and relative specificity (Sp) were defined and calculated as follows:
An area under the curve (AUC) analysis was also performed for serum and colostrum, at each dilution, using commercial software. c Binomial exact 95% confidence intervals (95% CIs) were calculated for relative Se, relative Sp, and the AUC.
Using FC as the reference test, fecal samples from 4 cows (12%) had results consistent with MAP infection, and were determined to be positive, while fecal samples from 30 cows (88%) had no results consistent with MAP infection and were determined to be negative. FC and HT-J PCR showed concordant results for 88% of the samples, with both tests determining the same 30 cows to be negative. The HT-J PCR did not detect any cows that had positive FC for MAP.
Using the manufacturer’s recommended dilution for serum of 1:20 and recommended S/P ratio cutoff threshold of 0.15, the relative Se and Sp for colostrum was 0% (95% CI: 0–60%) and 97% (95% CI: 83–100%), respectively, which was not significantly different when compared with the relative Se and Sp for serum (Se: 0%, 95% CI: 0–60%; Sp: 100%, 95% CI: 88–100%; Table 1). The associated AUC for serum and colostrum at a 1:20 dilution was 0.56 (95% CI: 0.38–0.73) and 0.63 (95% CI: 0.45–0.79), respectively (Table 1).
Relative sensitivity (Se) and relative specificity (Sp) of serum (S) and colostrum (C) tested by a commercial enzyme-linked immunosorbent assay (ELISA) for Mycobacterium avium subspecies paratuberculosis–specific antibodies. Serum and colostrum were diluted 1:2, 1:5, 1:10, 1:20, 1:40, 1:80, and 1:100, and ELISA results were compared at sample-to-positive (S/P) ratio cutoff thresholds of 0.04, 0.05, 0.1, 0.15, 0.2, and 0.25. Area under the curve (AUC) was calculated for serum and colostrum at each dilution. Binomial exact 95% confidence intervals (CIs) were calculated for relative Se, relative Sp, and the AUC, for serum and colostrum, and for each dilution and S/P ratio cutoff threshold.
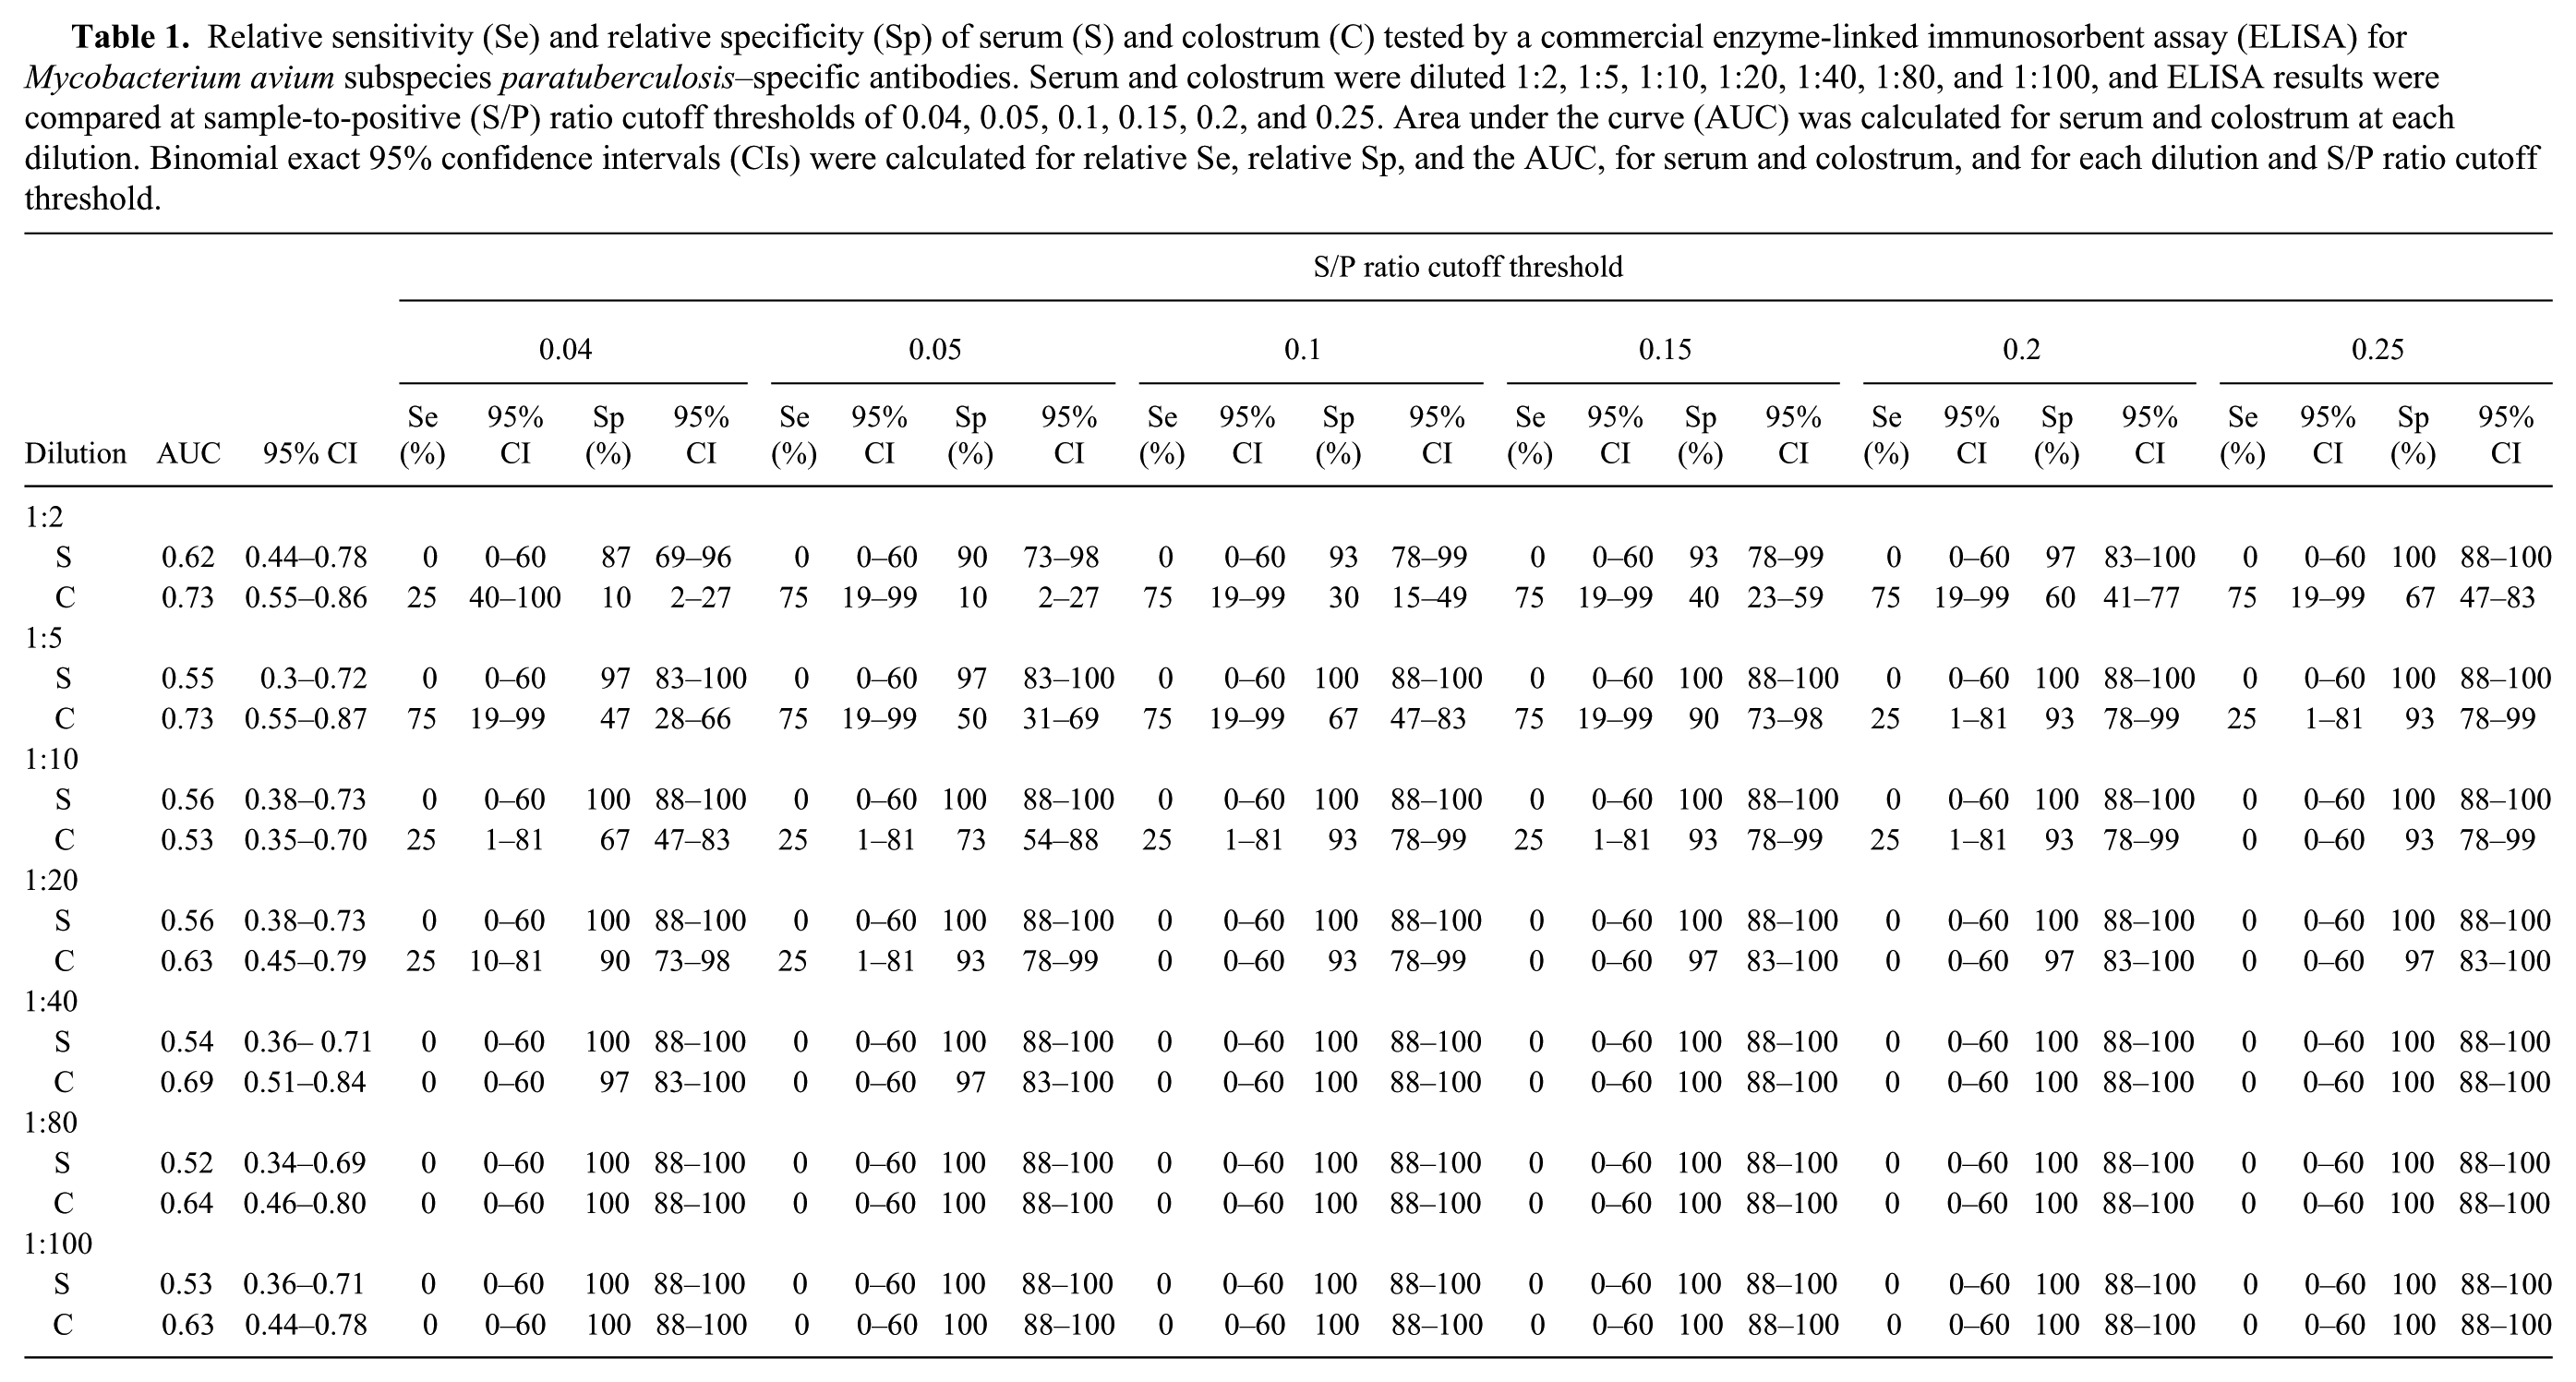
With a decrease in dilution to 1:5 and the same S/P ratio cutoff threshold of 0.15, the relative Se and Sp for colostrum was 75% (95% CI: 19–99%) and 90% (95% CI: 73–98%), respectively. The relative Se for colostrum was higher when compared to serum at the same dilution and S/P cutoff threshold (Se: 0%, 95% CI: 0–60%; Sp: 100%, 95% CI: 88–100%) (Table 1). The associated AUC for serum and colostrum diluted 1:5 was 0.55 (95% CI: 0.30–0.72) and 0.73 (95% CI: 0.55–0.87), respectively (Table 1).
Using the same sample dilution of 1:5 and the manufacturer’s recommended S/P ratio cutoff threshold for milk of 0.1, the relative Se and Sp for colostrum was 75% (95% CI: 19–99%) and 67% (95% CI: 47–83%), respectively. The relative Se for colostrum was higher when compared to serum at the same dilution and S/P ratio cutoff threshold (Se: 0%, 95% CI: 0–60%; Sp: 100%, 95% CI: 88–100%).
FC was used as the reference test for the fecal samples in the current study and compared to the HT-J PCR assay. In our study, only 4 of the 34 cows had FC results consistent with MAP infection; however, the HT-J PCR determined that all animals tested in our study were negative. The HT-J PCR was originally based on research performed using direct quantitative real-time (q)PCR, where 8 out of 13 experimentally infected FC-positive sheep, 24 out of 40 MAP-exposed, FC-negative sheep, and 68 out of 69 MAP-exposed, FC-positive sheep tested positive by PCR. 5
A 2014 study that investigated the HT-J PCR using Australian cattle and sheep populations found that in 870 cattle, 111 were FC positive and 124 were HT-J PCR positive, while in 507 sheep, 111 were FC positive and 117 were HT-J PCR positive. 7 However, that study 7 also attempted to identify fecal samples that were known to contain very low numbers of MAP, as the identification of subclinically infected animals is of particular importance with regard to maintenance of infection. The study found that replicate qPCR assays had variable detection rates when using samples that contained low MAP numbers. 7 The study also showed that the agreement between the HT-J PCR and radiometric culture decreased with decreasing numbers of MAP in the original sample, as culture was performed on a separate aliquot to what was used for HT-J PCR. 7 As such, the HT-J PCR has been recommended as a flock and herd test, rather than individual animal testing. 7 It is possible that the low numbers of FC-positive cows identified in our study was caused by the presence of subclinical infection in the study herd, therefore the fecal samples tested contained very low numbers of MAP, reducing the identification of infected animals.
Using the manufacturer’s recommended S/P ratio cutoff threshold of 0.15 and 1:20 dilution, the relative Se and Sp for colostrum and serum were not significantly different (i.e., relative Se was low and relative Sp was high for both samples). Additionally, with a reduction in sample dilution and the same S/P ratio cutoff threshold of 0.15, there was no observed improvement in the relative Se of serum. However, using a 1:5 dilution and the manufacturer’s recommended S/P ratio cutoff threshold of 0.15, the relative Se for colostrum was higher (75%) when compared to serum (0%), while maintaining a high relative Sp.
The dilution of serum at 1:20 is a commonly used method for the detection of MAP antibodies by ELISA.6,10 As mentioned previously, it is likely that the herd selected for testing in our study was subclinically infected. During subclinical infection, animals respond with a strong CMI response. As the disease progresses, the CMI response decreases and is replaced by a strong humoral immune response. 9 Therefore, as the ELISA is detecting specific antibody (humoral immune response), the detection of subclinically infected animals is impaired. However, our study shows that the testing of colostrum in ELISA at dilutions <1:20 may improve the detection of subclinically MAP-infected animals when compared with serum.
It should be noted that serum and colostrum were not collected at the same time during our study. During the process of colostrogenesis, transfer of immunoglobulins into colostrum from maternal serum can begin 2–3 weeks prior to parturition, ceasing immediately prior to or at the onset of lactation. 3 The collection of serum 30–60 days after parturition in our study allowed for the immunoglobulin concentrations in maternal serum to return to more normal higher concentrations, which occurs within 28 days following parturition. 3 We believe that the comparison of serum and colostrum at different time points in our study allowed for a fairer comparison of the 2 samples, without the processes of colostrogenesis influencing the results.
Considering the potential subclinical status of the herd tested in this study, it is possible that colostrum may provide improved identification of animals in the early stages of MAP infection when compared to serum. However, these results warrant further investigation because of the small number of animals used in this study.
Footnotes
Acknowledgements
We thank Peter Younis and The Vet Group (Timboon, Victoria) for their assistance during this study.
Authors’ contributions
CJ Jenvey contributed to conception and design of the study; contributed to acquisition, analysis, and interpretation of data; and drafted the manuscript. MP Reichel contributed to design of the study, and contributed to analysis and interpretation of data. PD Cockcroft contributed to conception and design of the study, and contributed to acquisition, analysis, and interpretation of data. All authors critically revised manuscript; gave final approval; and agreed to be accountable for all aspects of the work in ensuring that questions relating to the accuracy or integrity of any part of the work are appropriately investigated and resolved.
a.
Parachek 2, Prionics AG, Schlieren-Zurich, Switzerland.
b.
Benchmark Plus microplate spectrophotometer, Bio-Rad Laboratories Pty. Ltd., Gladesville, New South Wales, Australia.
c.
MedCalc for Windows version 15.6.1, MedCalc Software, Ostend, Belgium.
Declaration of conflicting interests
The author(s) declared no potential conflicts of interest with respect to the research, authorship, and/or publication of this article.
Funding
The author(s) received no financial support for the research, authorship, and/or publication of this article.