
Abstract
Fitness for purpose and validation are increasingly becoming a benchmark in the development of test methods for the diagnosis of infectious diseases in aquatic animals. The design of the evaluation and the analysis of data are critical to demonstrate test method performance characteristics and fitness for purpose, as stated in the World Organization for Animal Health pathway for test validation. Three test methods for the detection of the oyster parasite Haplosporidium nelsoni were selected for the validation study described herein: histology, end-point polymerase chain reaction (PCR), and real-time PCR (qPCR). Preliminary work evaluated the analytical sensitivity and specificity of the PCR and qPCR assay in development. The following stage used test results on 100 oysters in 3 different laboratories to assess diagnostic sensitivity (DSe), diagnostic specificity (DSp), repeatability, and reproducibility. Repeatability and reproducibility were within 68–95%. The final part of the project evaluated DSe and DSp using test results on 400 oysters and results from the first 100 oysters tested. In the absence of a 100% gold standard test, latent class modeling methods were explored to characterize the tests (i.e., Bayesian analyses). For both PCR methods, DSe was >90%, and in the 60% range for histology, whereas DSp was >90% for all methods. Based on the results of this validation, a threshold cycle value of 30 for qPCR corresponds to the limit of sensitivity for histology where unreliable detection becomes more frequent, thus providing a threshold helpful in diagnostic settings where both histology and qPCR are used.
Keywords
Introduction
Multinucleated sphere unknown (MSX) disease of oysters is caused by the haplosporidian parasite, Haplosporidium nelsoni. 1 The parasite has been present in oyster populations in the mid-Atlantic United States since the 1950s, and has caused documented mortalities of >90% in affected populations of the American oyster, Crassostrea virginica. 1 The parasite distribution gradually spread north in the 1980s and 1990s and was found in the Piscataqua River estuary on the Maine–New Hampshire border in 1995. 2 In the autumn of 2002, an epidemic in American oysters from the Bras d’Or Lakes in Cape Breton, Nova Scotia, Canada led to the first identification of MSX disease in Canada. 12 Disease response included a widespread large-scale survey of American oyster populations in the Maritime Provinces. 12
The tests initially used in the Maritime Provinces survey, histology and an end-point polymerase chain reaction (PCR) assay, corresponded to the published recommended method listed by the World Organization for Animal Health (OIE). 21 Improvements to the OIE recommended PCR were gradually tested and adopted. However, the extensive testing needs of the surveillance highlighted the importance of having access to a high-sensitivity, high-throughput test method to address surge capacity in response to a disease event. Real-time PCR (qPCR) assays have several advantages over end-point assays, and the semiquantitative results they produce are expanding our level of understanding of infection dynamics in survey samples. 20 A qPCR assay was developed by the Department of Fisheries and Oceans Canada, Gulf Fisheries Center Aquatic Animal Health Laboratory (DFO; Moncton, New Brunswick, Canada) in 2007 to increase sensitivity of the PCR test and increase laboratory capacity.
Although by 2009, H. nelsoni was no longer a listed disease by the OIE, it remains a concern to the oyster industry in Atlantic Canada. The survey and subsequent monitoring indicate that the parasite remains confined to the waters of North-East Cape Breton and the Bras d’Or Lakes, Nova Scotia, and there has been no documented spread of the parasite to other waters of eastern Canada to date (Stephenson M: 2012, Aquaculture Association of Nova Scotia (AANS) Revitalizing the Bras d’Or Lakes for Oyster Development. Aquac Assoc Can Spec Publication 18). Given the economic impact that the parasite would cause if it spread beyond its current distribution, it was deemed a disease agent of importance and listed under Canada’s Health of Animals Act in 2011. It has since been regulated under the National Aquatic Animal Health Program (http://www.inspection.gc.ca/animals/aquatic-animals/diseases/reportable/2015/eng/1339174937153/1339175227861).
Identification of the diagnostic characteristics of a test is one of the main steps in the OIE pathway for test validation (http://www.oie.int/fileadmin/Home/eng/Health_standards/aahm/current/1.1.02_VALIDATION.pdf). Traditional approaches to this type of test evaluation include diagnostic sensitivity (DSe) and specificity (DSp) which compare how well a new test identifies positives and negatives with respect to the presumed perfect gold standard test. 5 Available diagnostic tests for MSX include histology, PCR, and qPCR; however, none of these tests are known to be perfect. Therefore, the traditional approach to evaluation cannot be applied directly. Diagnostic test evaluation using latent class modeling (LCM) has been used to estimate test performances in animals.3,6 Additional parameters to help determine usefulness of diagnostic tests include agreement between 2 sets of laboratory results. Repeatability can be measured within a laboratory by repeating the same samples twice with the same test. Reproducibility can be measured between laboratories by comparing the results from 2 different laboratories on the same samples.
The objectives of our project were 2-fold. The first objective was to validate the diagnostic tests for MSX selected for this study by estimating the repeatability (within-laboratory consistency), reproducibility (between-laboratory consistency), DSe, and DSp of the available tests. The second objective was to evaluate the diagnostic test protocol for future use as a standardized diagnostic test method.
Material and methods
Participating laboratories
The participating laboratories were the Department of Fisheries and Oceans Canada, Gulf Fisheries Center Aquatic Animal Health Laboratory (DFO; Moncton, New Brunswick, Canada), and 4 other laboratories (lab A–D).
Selection of animals and populations
Results of previous monitoring work by the DFO informed the selection of the populations used in the study. Three distinct populations were chosen, including 200 oysters from a high-prevalence population from an outbreak in the Bras d’Or Lakes, 200 oysters from moderate-level prevalence sites in the Bras d’Or Lakes, and 100 oysters from a population of MSX-free oysters from Caraquet, New Brunswick. Banked tissues of these previously tested animals were retrieved from storage. The estimated prevalence ranges for these groups were 50–90%, 20–50%, and 0%, respectively. The estimations of prevalence for these groups were made from the DFO monitoring data, but the previous test result status was not a factor in the selection of individual oysters from each population.
The 500 oysters were tested in 2 phases. Histology, end-point PCR, and qPCR were assessed during each phase of the project. In phase I, the first 100 oysters were tested for repeatability and reproducibility of the tests from the different laboratories, although qPCR was only available at DFO, hence reproducibility of qPCR was not reported. The 100 oysters were randomly selected from the negative group (20), the moderate-prevalence group (30), and the high-prevalence group (50). The number of oysters selected from each group was purposefully determined in order to approximate a prevalence of 50% overall. In phase II, the remaining 400 oysters were tested by the DFO laboratory only, and results for all 500 oysters were used to estimate the diagnostic sensitivity (DSe) and specificity (DSp) of the 3 diagnostic tests.
Preparation of material for testing
The 500 banked tissues selected for validation were initially collected during monitoring by the DFO. The original postmortem examination was performed as described 9 with modifications for the collection of material for molecular testing. All tools used for shucking oysters and dissection of soft tissues were disinfected between animals to prevent cross-contamination. Tools were wiped clean, dipped in 70% ethanol, and flamed between animals. Tissues collected for PCR were immediately adjacent to the section used for histological examination and consisted of gill, digestive gland, and mantle. A portion of these tissues was archived in 95% ethanol at room temperature, and/or frozen. Tissues for histology were fixed in Davidson solution 9 and processed using standard methods. Paraffin blocks were archived.
For phase 1 of the project, the samples were obtained from archived gill, mantle, and digestive gland tissue as mentioned above. Eight tubes per oyster were prepared for testing by PCR and qPCR, with each tube containing 95% ethanol and subsamples of frozen and/or ethanol-preserved tissues. Scalpels and tweezers used to subsample were put in a 250°C bead sterilizer a for a minimum of 20 sec between each animal. This sterilization method was tested postvalidation by the DFO and has since been shown inadequate for DNA work (unpublished). Randomly numbered labels were used so that participating analysts were blind to the sample’s original identifier and result. Each laboratory received 200 tubes (2 tubes per oyster) for testing by PCR (DFO, Lab C, and Lab D) and qPCR (DFO).
There were also 6 slides made for each oyster at Lab B so that DFO, Lab A, and Lab B each received 2 slides for each oyster. The slides had random numbers for identification and were placed randomly into the slide boxes to mitigate the risk of bias due to ordering of the slides. Labeling and random coding was performed by individuals not involved with the analysis, such that analysts were blind to the sample’s original identifier and result.
For phase 2, 1 frozen or ethanol-fixed tissue section was taken from the 400 reserve oysters for DNA extraction for the PCR and qPCR by the DFO. One histology slide was also prepared from each of the 400 reserve oysters at the DFO Laboratory. Preparation was performed by personnel not involved in the study.
Preparation of analyst prior to testing
Prior to the start of the study, all participants were prepared by carefully reviewing PCR protocols or methods used to read histology slides. A site visit to each of the participating laboratories was conducted by the DFO team of analysts to go over protocols for PCR and histology.
DNA extraction
DNA extraction of the samples submitted for testing by PCR and qPCR was done with a column kit. b A mix of gills, mantle, and digestive gland of ~50 mg was used for extraction. This larger volume of tissue required modifications to the manufacturers’ protocol by doubling the quantities of proteinase K, buffers, and ethanol at each of the steps prior to DNA washing. The solutions were applied to the binding column in 2 steps when the volume exceeded the column capacity. Washing of the DNA was done with 630 µL of buffer AW1 and AW2. Elution of the DNA was done in 2× 100 µL of buffer AE, for a final volume of 200 µL. The DNA concentration obtained with this method averaged 470 ± 270 ng/µL (n = 240), with highest concentrations not to exceed 1,500 ng/µL. Thus, for end-point PCR, DNA was neither quantified systematically nor normalized. For qPCR, DNA was quantified on a spectrophotometer c and normalized to 150 ng/µL with Tris–ethylenediamine tetra-acetic acid (1×, pH 8) using a liquid handling robot. d
Plasmid
The DNA extracted from an infected oyster was used to amplify a 1,354–base pair region of MSX encompassing the regions selected for diagnostic PCR assays, using 800 pmol of each primer (314F: 5′-ATTCAAGTTTCTGCCCTATCAG; 1750R: 5′-CAGGGACGTAATCAATGCA) and a commercial master mix. e The PCR fragment was electrophoresed on 2% agarose and gel purified using purification columns. A 30-ng aliquot was blunt inserted into pSC-A-amp/kan plasmid, f followed by transformation into competent cells following the manufacturer’s instructions. Transformed cells were multiplied in lysogeny broth (LB) containing ampicillin, and clones were grown on LB plates with ampicillin for selection. A miniprep g was done to purify the plasmid containing MSX sequences. Sequences were verified by PCR amplification and Sanger sequencing of PCR amplicons using standard methods.
Development and selection process for PCR and qPCR assays
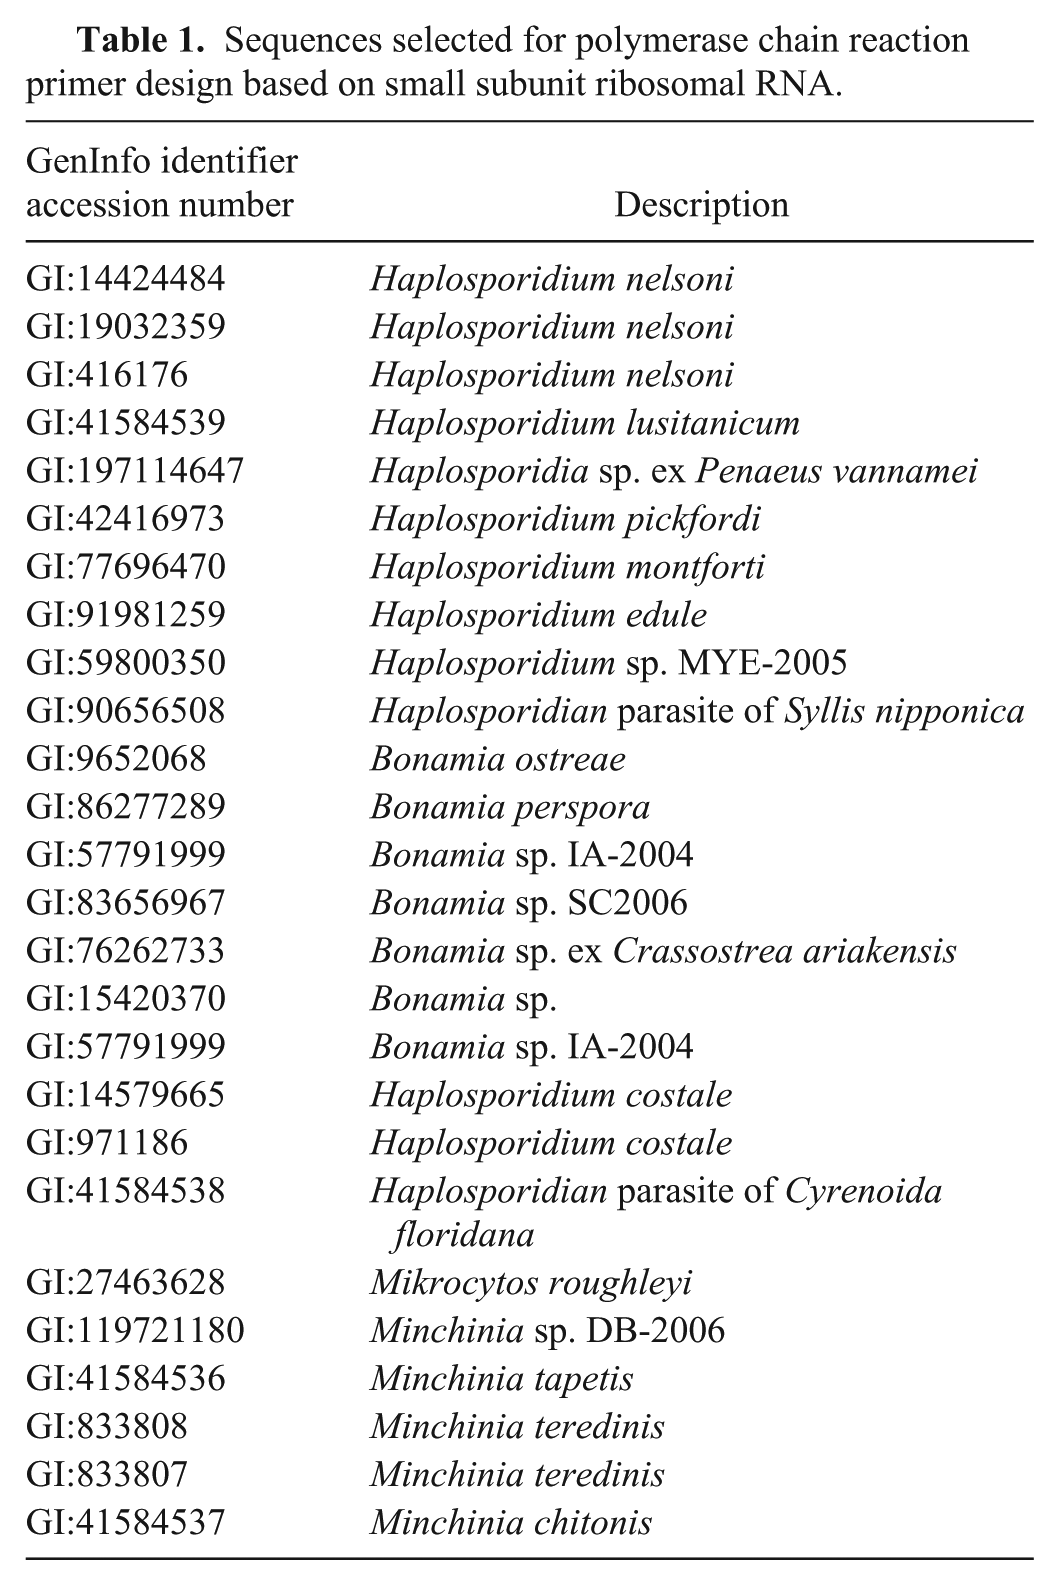
Prior to validation, PCR assays for MSX detection were carefully reviewed with the intent of improving the performance, if possible, of an end-point PCR assay already in use by the DFO, and developing a new real-time assay. A Blast search (National Center for Biotechnology Information) using sequence GI:416176 for H. nelsoni was performed, and closely related sequences from haplosporidians and other genera were used to build an alignment (Table 1). Several primers were initially selected in silico to avoid the possible amplification of other haplosporidians, especially Haplosporidium costale, which often coinfects oysters with MSX in samples tested by DFO. 16 Primers were tested in end-point PCR using a serial dilution of DNA from an infected tissue and/or DNA plasmid for comparison. At this stage, the PCR chemistry and conditions were not optimized but followed manufacturer’s guidelines. A commercial PCR master mix kit e was used throughout the primer selection process, with 800 pmol of each primer in 25-µL reaction volumes, and 1 µL of DNA. The PCR conditions were 94°C (4 min), 10 cycles of touchdown (94°C for 40 sec, 70°C for 40 sec, 72°C for 1 min with the annealing and extension temperatures dropping by 1°C each cycle), and 40 cycles at 94°C for 40 sec, 60°C for 40 sec, and 72°C for 1 min. A final extension at 72°C for 5 min and a hold at 20°C completed the program. Electrophoresis on 2% agarose or 6% acrylamide using ethidium bromide, for visualization of amplified DNA bands, and a 50-bp DNA ladder, for confirmation of band size, was done.
Sequences selected for polymerase chain reaction primer design based on small subunit ribosomal RNA.
Once a pair of primers was selected based on their ability to detect serial dilutions and production of single bands on gel using standard conditions, various PCR kits were examined with those primers. The kitsh,i were tested using serial dilutions of DNA from infected tissue and/or DNA plasmid and compared against the commercial master mix e in search of improvements in sensitivity as a priority.
Final conditions of the assay with the selected primers and kit were determined by adjusting the primer concentration after optimization and by performing a gradient PCR from 52°C to 68.5°C to determine the optimal annealing temperature. Selected primers for the end-point PCR used during the validation were 161F: 5′-GGGCTAATACGTGATAAATGGTACG and 334R: 5′-TTCCCCGTTACCCGTCAT. The commercial PCR master mix e was used with 320 pmol of each primer, 1 µL of DNA, in a final volume of 25 µL, and PCR conditions as above. The primer specificity was empirically tested to confirm that amplification of H. costale–infected oysters was not possible.
For the development of the qPCR assay, an initial evaluation of SYBR Green chemistry was donej,k using the primers selected for end-point PCR and serial dilutions of plasmid and/or DNA from an infected oyster. A real-time thermocycler l was used, and cycling conditions varied depending on the kit. Initial conditions followed the manufacturers’ recommendation, then 40 cycles were used at 94°C for 40 sec, 60°C for 40 sec, 72°C for 1 min, followed by extension at 72°C for 5 min and a melting curve from 55°C to 99°C at 5 sec/°C. The results were analyzed by manually setting the baseline where the linear amplification of positive samples, as measured by fluorescence emission, reached approximately the first third of the linear portion of amplification. The placement of the baseline was thus independent of the background noise. Results were reported as threshold cycle (Ct) values and are inversely related to the initial concentration of target in the sample.
A second group of kits were evaluated with a probe.
m
Primer 161F was combined with a slightly modified reverse primer (336R: 5′-
Details of the real-time polymerase chain reaction kits evaluated and the conditions tested.*
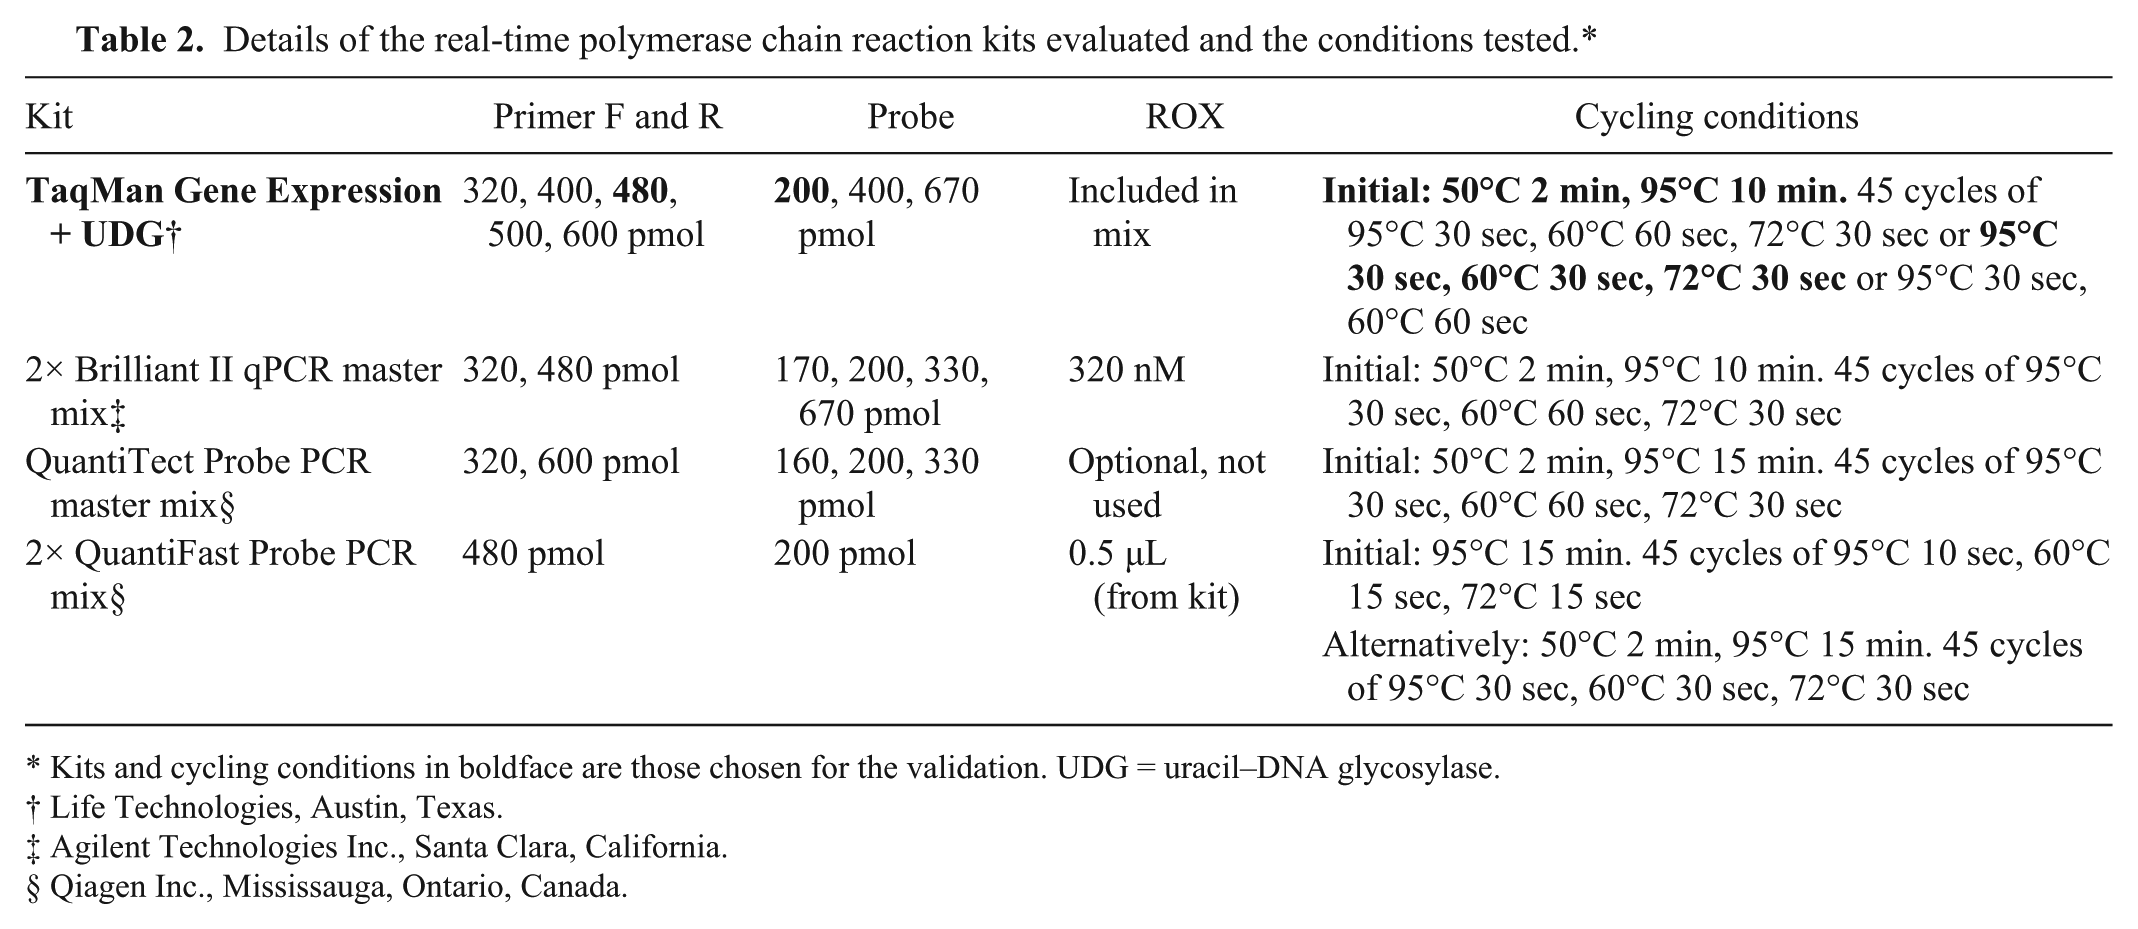
Kits and cycling conditions in boldface are those chosen for the validation. UDG = uracil–DNA glycosylase.
Life Technologies, Austin, Texas.
Agilent Technologies Inc., Santa Clara, California.
Qiagen Inc., Mississauga, Ontario, Canada.
Limit of detection of the qPCR assay
The limit of detection was tested using log serial dilutions of a purified plasmid at an initial concentration of 59 ng/µL measured on a spectrophotometer. o Dilutions were mixed 1:1 with DNA from non-infected oysters before testing in duplicate wells. The lowest dilution producing consistent positive results in both wells in 10 consecutive runs was converted in copy number of the double-stranded DNA plasmid using the total length of the plasmid. The efficiency of the qPCR assay reactions was also determined during these assays by converting the slope of the standard curve using the formula: E = -1 + 10(-1/slope).
Histology
The histological protocol used by the 3 participating histology analysts ensured a uniform approach to sample analysis and reporting of results. Each histology slide was scanned at low magnification (25–100×) to verify that tissue was of sufficient quality for the test. The slide was then scanned completely at an intermediate magnification of 200× to detect lesions, areas of host response (hemocyte infiltration), or other pathology, which was given first priority during higher magnification examination for specific pathogens. The high-power scan consisted of examining 50 fields of view at 400× magnification, including 25 fields of visceral mass (digestive gland, gut, and connective tissue) and 25 fields of gill. Samples were identified as “presumptive positive” or “negative” based on the observation of plasmodia and/or spores consistent with MSX. Intensity of infection, as described by the OIE, 21 was used to provide a semiquantitative description for interpretation of results and comparison between analysts.
Statistical design and modeling
All diagnostic test results were scanned visually for any errors in data entry and missing data and then merged by their original oyster identification into a larger database. Once compiled, data was validated and analyzed using a commercial software package. p The statistical analysis was done in a stepwise manner for phase I. The qPCR test results were dichotomized into infected (positive) oysters if Ct <40 and noninfected (negative) oysters if Ct ≥40. Repeatability within a diagnostic test was evaluated by agreement defined by the proportion of the 100 oysters that had the same result on both of the 2 samples. Repeatability within a diagnostic test was also evaluated by McNemar exact test to test for a difference in the proportion of positive test results between the 2 sets of samples. 5 If this test was not significant (P > 0.05) then kappa was calculated. Kappa is the measurement of agreement that is adjusted for the agreement due to chance alone. Kappa is calculated as [(observed agreement – agreement due to chance)/(1 – agreement due to chance)]. 4 Reproducibility between laboratories of the same test was evaluated using both proportion agreeing and kappa. If the repeatability of the DFO PCR, qPCR, and histology diagnostic tests was high, then the testing of the 400 oysters for phase II would proceed. The interpretation of kappa is usually considered almost perfect if kappa is ≥0.80, substantial if kappa is 0.60–0.79, moderate if kappa is 0.40–0.59, fair if kappa is 0.20–0.39, slight if kappa is 0.0–0.19, and no agreement if kappa is less than zero. 10
The objective of phase II was to estimate DSe and DSp of the available tests for MSX using LCM techniques. When a perfect standard reference test (gold standard) is not available, it is possible to estimate DSe and DSp with LCM. Bayesian methods are commonly used to evaluate diagnostic tests in veterinary medicine. 6 The remaining 400 oysters were selected for this phase of the study. In addition, to increase the number of animals in our analysis, we added the first set of test results from the DFO for oysters used in phase I. The summary of the composition of the groups is in Table 3.
Number of oysters tested from each of the different prevalence level groups.*
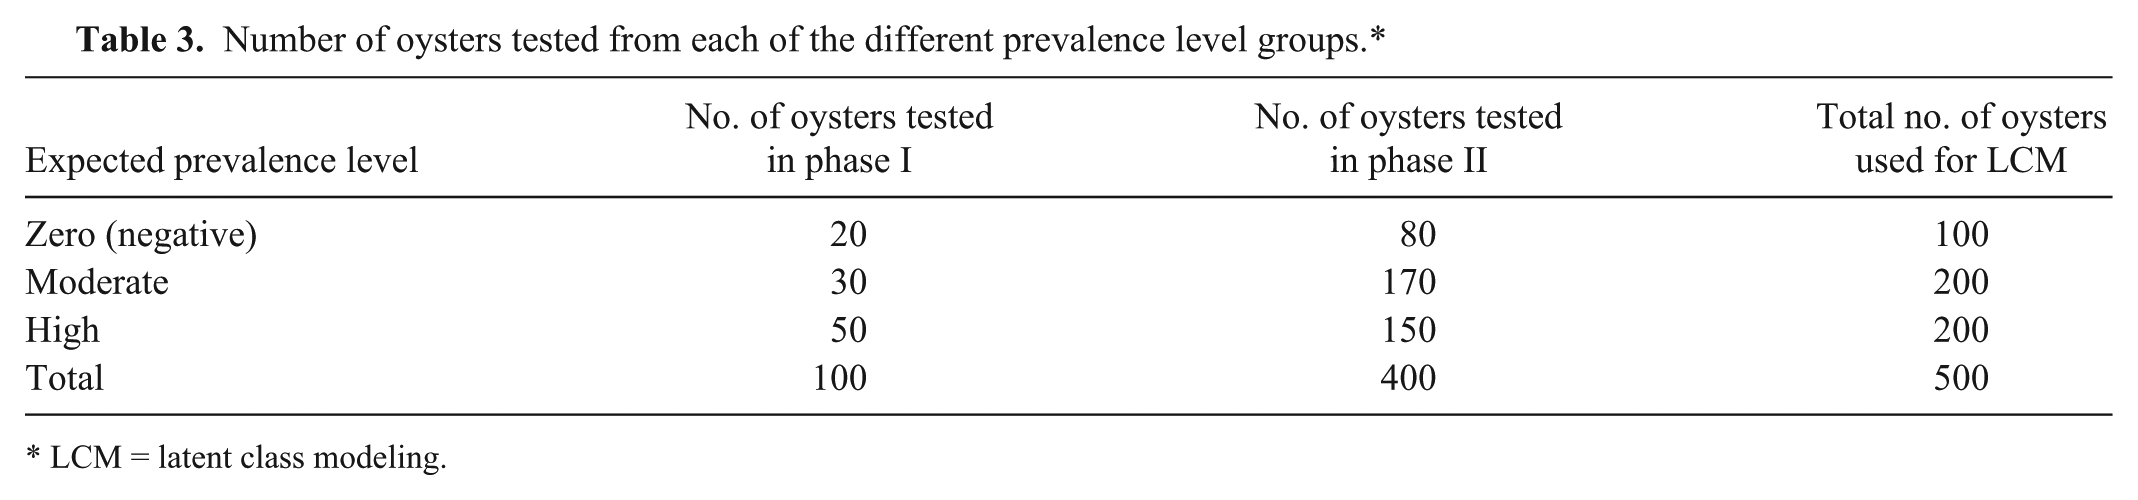
LCM = latent class modeling.
Bayesian modeling
Bayesian methods are based on Markov Chain Monte Carlo (MCMC) estimations and were performed with the WinBUGS software. 11 Bayesian modeling has the advantage of being able to use prior information regarding the test parameters to create refined model estimates (posterior estimates). For the base model (Bayes-1), noninformative beta (1,1) priors were set for all DSe, DSp, and population prevalences. One important assumption for the maximum likelihood models is that the tests are conditionally independent. 7 Models were initially run with all tests independent of one another. To test the dependence between all combinations of 2 diagnostic tests, the models were altered so that multiple models were run with covariance terms for each pair of diagnostic tests (qPCR–PCR, PCR–histology, and qPCR–histology; Bayes-2 models). Additional models were made restricting the prevalence of the negative group to 0 by adding in a prior distribution of beta (1 000 000, 0; Bayes-3 and Bayes-3A). Finally, the stability of the model was challenged by making small changes to the input data to see how sensitive DSe and DSp were to small changes in the data (Bayes-4). An additional stability analysis was done on data that consisted of the phase II oyster results and the second set of duplicate samples (set 2) from phase I oyster results (Bayes-1 set 2). Because of loss of 1 histology slide, results from only 499 oysters were used.
For all the models, a burn-in period of 10,000 iterations was run and discarded. After which, 50,000 iterations were run to provide the posterior estimates. Convergence of the MCMC chain was assessed by confirming that the history plots ran stably and did not switch to different regions. Quantile plots and autocorrelation plots were also examined for evidence of model convergence. The point estimates and the probability intervals were taken from the median and percentiles of the posterior distributions.
The Bayesian goodness-of-fit P values 13 and the deviance information criterion (DIC) 15 were used to compare models with and without conditional dependence covariance. There is no set limit for the significance of the Bayesian P value limit; however, if the Bayesian P value is very low, there is some evidence that the model does not fit. 15 Models were considered significantly better if the DIC decreased more than 3 units. If models were not less than 3 units, the model with fewer variables were retained. 3
Cut-point for qPCR Ct
A useful technique for choosing a cutoff Ct value is the 2-graph receiver operating curve plot (also called sensitivity–specificity plot). 14 A sensitivity–specificity plot is created by calculating the DSe and DSp at each Ct value and then graphing the DSe and DSp at the corresponding Ct cutoffs. For our study, the DSe and DSp were estimated using the changing cutoff Ct value in multiple Bayesian models keeping the PCR or histology data consistent in the models. The point at which DSe and DSp cross over is the Ct value at which DSe and DSp are equal; however, the cutoff should be based on the purpose of the test. 8
Results
Selection and limit of detection of PCR and qPCR
Primers were successfully selected based on their specificity in silico. The forward primer 161F was specific to MSX sequence whereas the reverse primer 334R matched other species (Table 1) in the alignment but not H. costale. The commercial PCR master mix e was not outperformed by any of the other kitsh,i tested (results not shown) and was chosen. End-point PCR conditions were adjusted to avoid the production of extra bands. For qPCR, the same primers and SYBR Green assays were tested but due to nonspecific signals occasionally caused by primers–dimers and ambiguity in the interpretation of the melting curve, a probe-based assay was selected. For the development of the probe-based assay, the reverse primer was slightly modified to better match the melting temperature of the forward primer. Based on the comparative limit of detection observed with various kits, the ease of use, linear range of amplification, consistency between runs, availability of uracil–DNA glycosylase, and cost, a commercial probe-based kit n was selected, in combination with a 6-FAM–labeled probe with MGB. The efficiency (E) of the assay, as measured by the formula E = -1 + 10(-1/slope), was very similar between runs at 97% and linear over 9 orders of magnitude. Deviation from linearity was observed for the lowest dilutions near the limit of detection due to the Poisson distribution for low copy numbers (Fig. 1). The limit of detection was determined to be 38 copies of a double-stranded DNA plasmid. Postvalidation, we observed and measured a loss of <1 log (~2 Ct) in sensitivity using MSX plasmid spiked in Mytilus edulis DNA extract. Although this inhibition was not observed in oysters, a decision to add 1 µL of 1% bovine serum albumin to the PCR and qPCR mixture was made to prevent inhibition of PCR reaction. For routine detection of MSX, the qPCR assay is done in duplicate wells, and 40 cycles is standard, as either no signal or only nonreproducible signals were obtained above this limit during the validation testing.
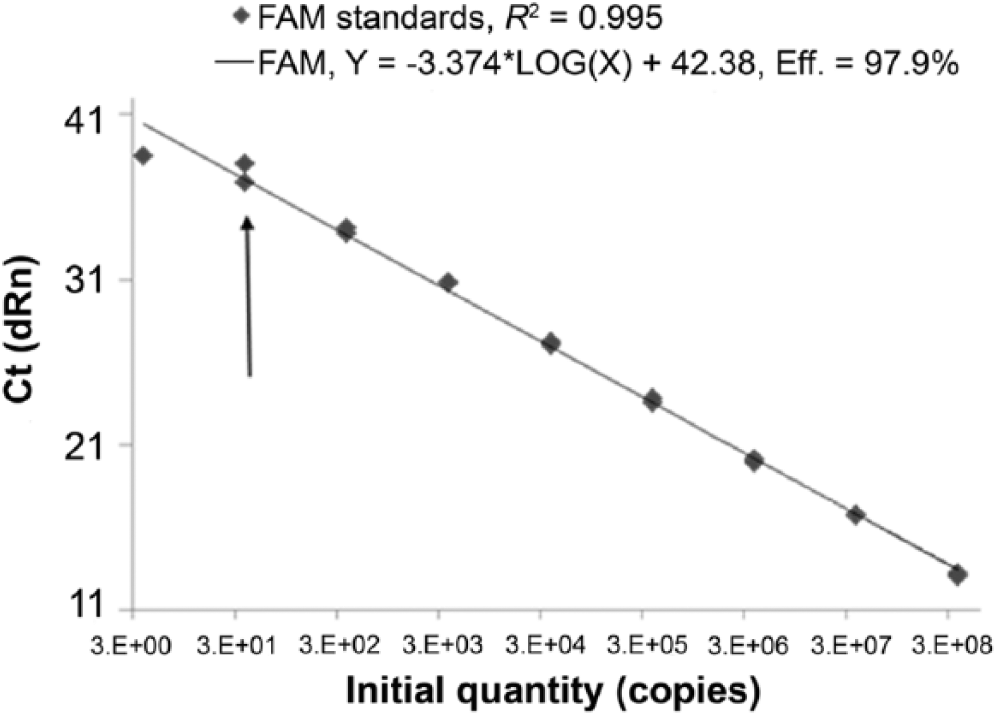
Threshold cycle (Ct) versus copy numbers of multinucleated sphere unknown (MSX) disease DNA template. Copy numbers were calculated from MSX plasmid serially diluted 10-fold. Limit of detection is 38 copies of template (arrow). FAM = 6-carboxyfluorescein; dRn = normalized data.
Repeatability and reproducibility
For phase I, most laboratories reported data as tests were completed. Lab D did not report the PCR results at the time of test completion. The original results were lost, and pictures of the gels were reread by the technician almost 1 year after the PCR assays were completed. One histology slide was accidentally destroyed by lab A leaving only 99 samples for one of their sets of slides.
The repeatability for all tests is presented in Table 4. All tests performed with >85% agreement except the lab D PCR test, which performed with only 68% agreement. Agreements as measured by kappa were shown to have substantial to almost perfect agreement except for Lab D PCR, which was only fair. All standard errors for reported kappas were 0.09–0.10.
Repeatability of 3 diagnostic tests at the 4 laboratories.*
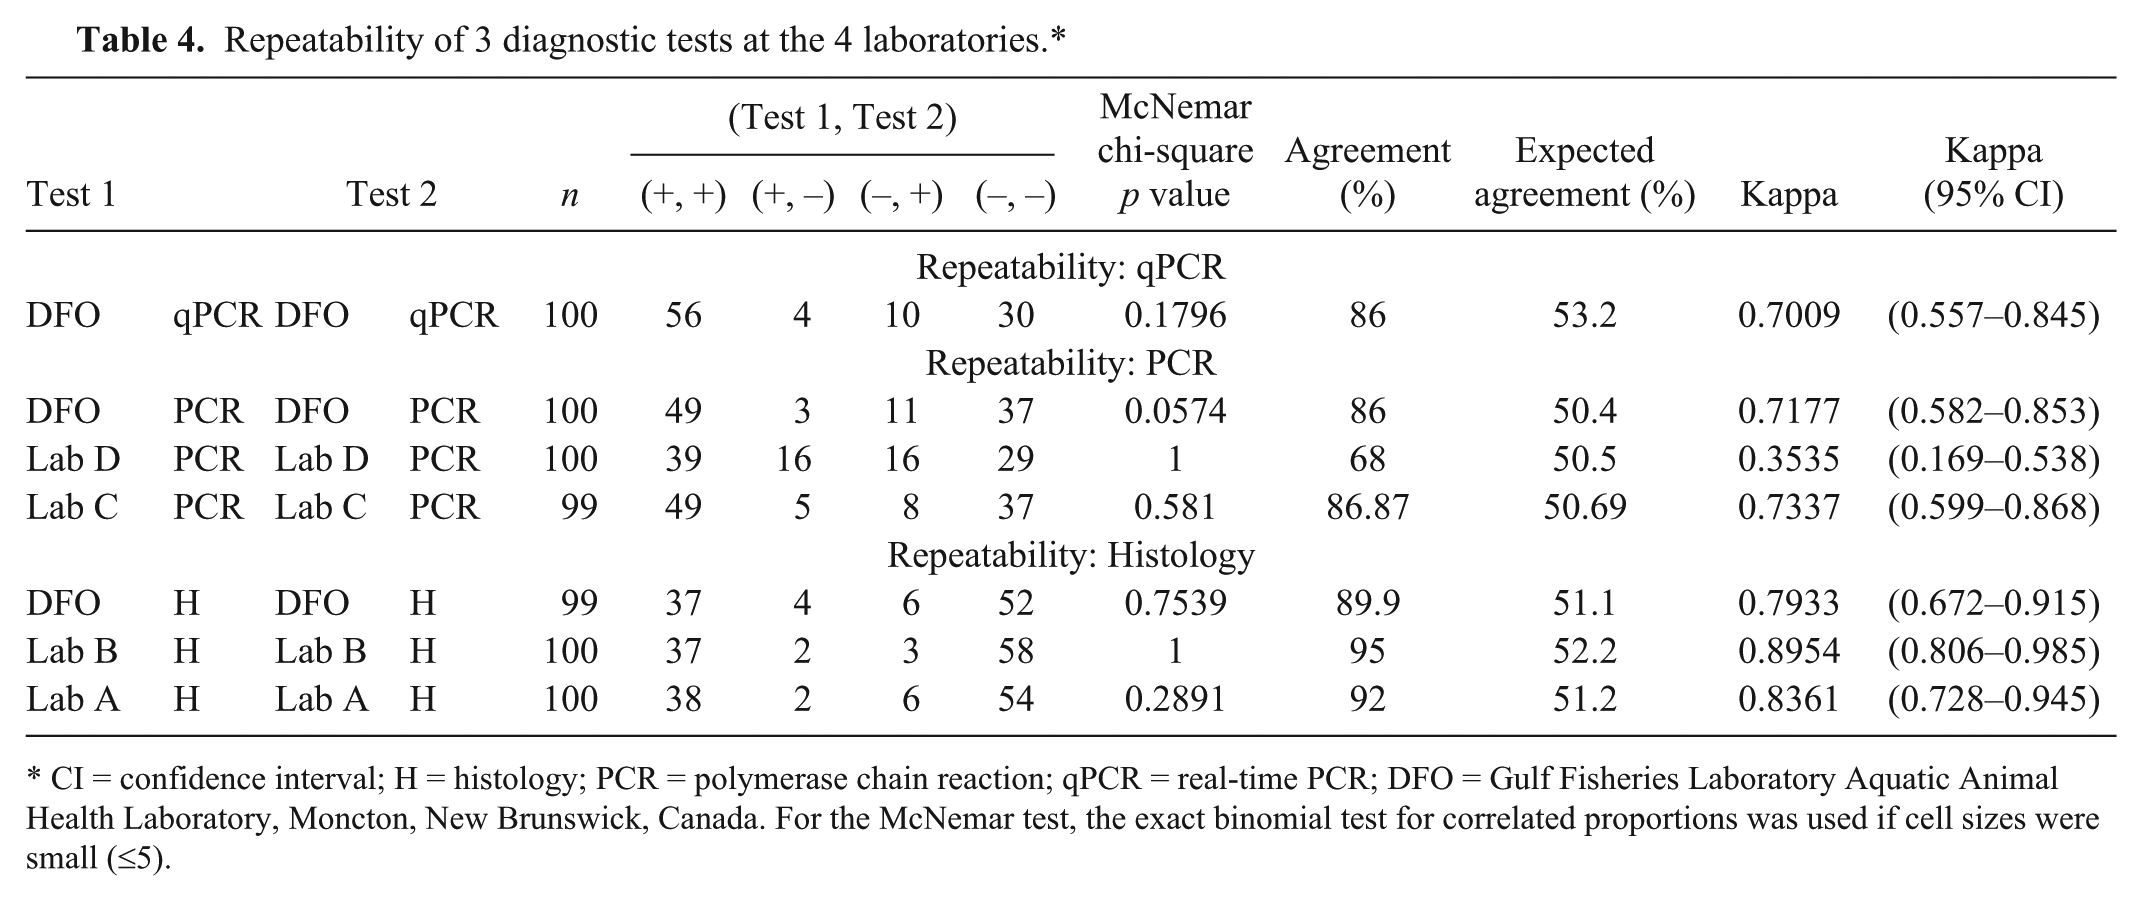
CI = confidence interval; H = histology; PCR = polymerase chain reaction; qPCR = real-time PCR; DFO = Gulf Fisheries Laboratory Aquatic Animal Health Laboratory, Moncton, New Brunswick, Canada. For the McNemar test, the exact binomial test for correlated proportions was used if cell sizes were small (≤5).
Reproducibility as measured by mean proportion of agreement and mean kappa are presented in Table 5 for PCR, and in Table 6 for histology. For the PCR from the different laboratories, the agreement was substantial except when lab D PCR was compared with the DFO and lab C PCR tests in which agreements were fair to moderate. Agreements between laboratories for the histology were excellent and ranged from 90% up to 94%. Kappa scores ranged from 0.79 to 0.88 with all but 1 test pair with almost perfect agreement. There were no significant McNemar p values, indicating that the tests did have the same proportion of positive test results.
Reproducibility of the polymerase chain reaction (PCR) assays at the 3 laboratories.*
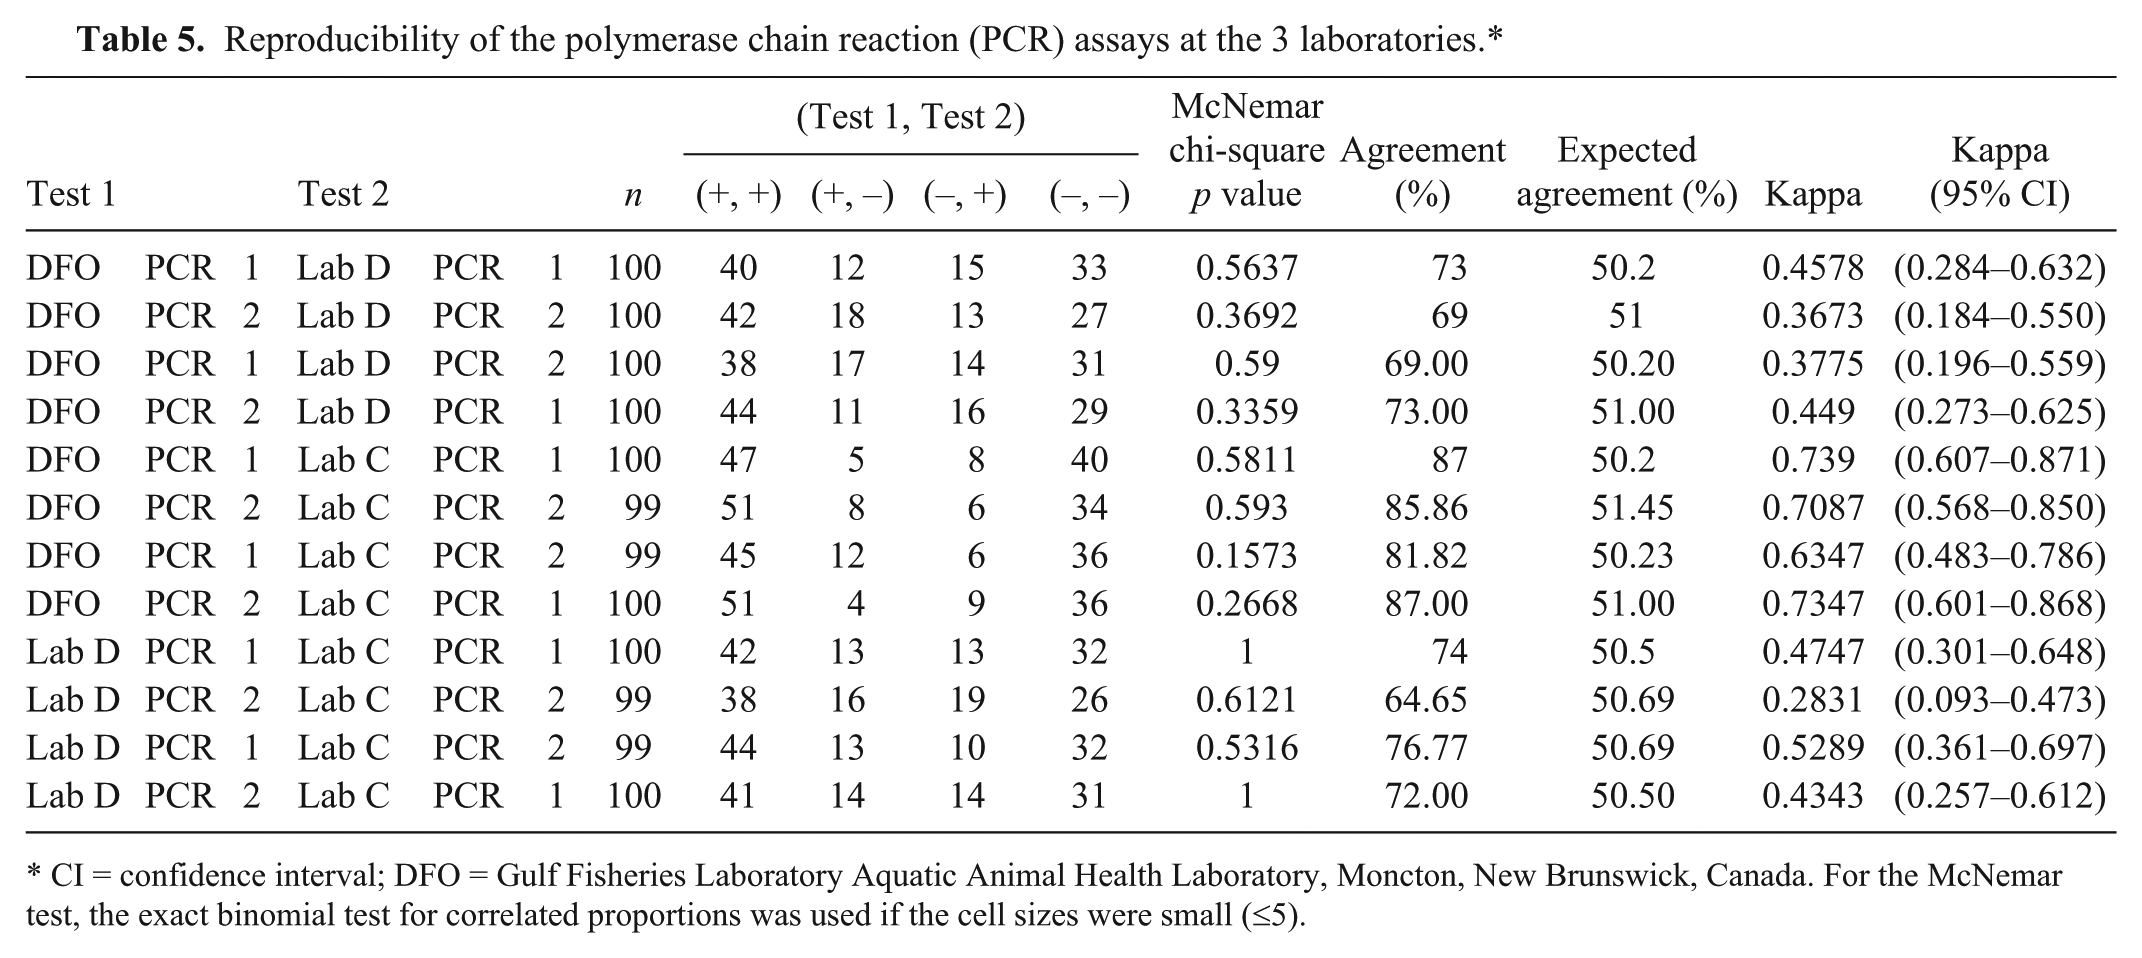
CI = confidence interval; DFO = Gulf Fisheries Laboratory Aquatic Animal Health Laboratory, Moncton, New Brunswick, Canada. For the McNemar test, the exact binomial test for correlated proportions was used if the cell sizes were small (≤5).
Reproducibility of histology (H) assay at the 3 laboratories.*
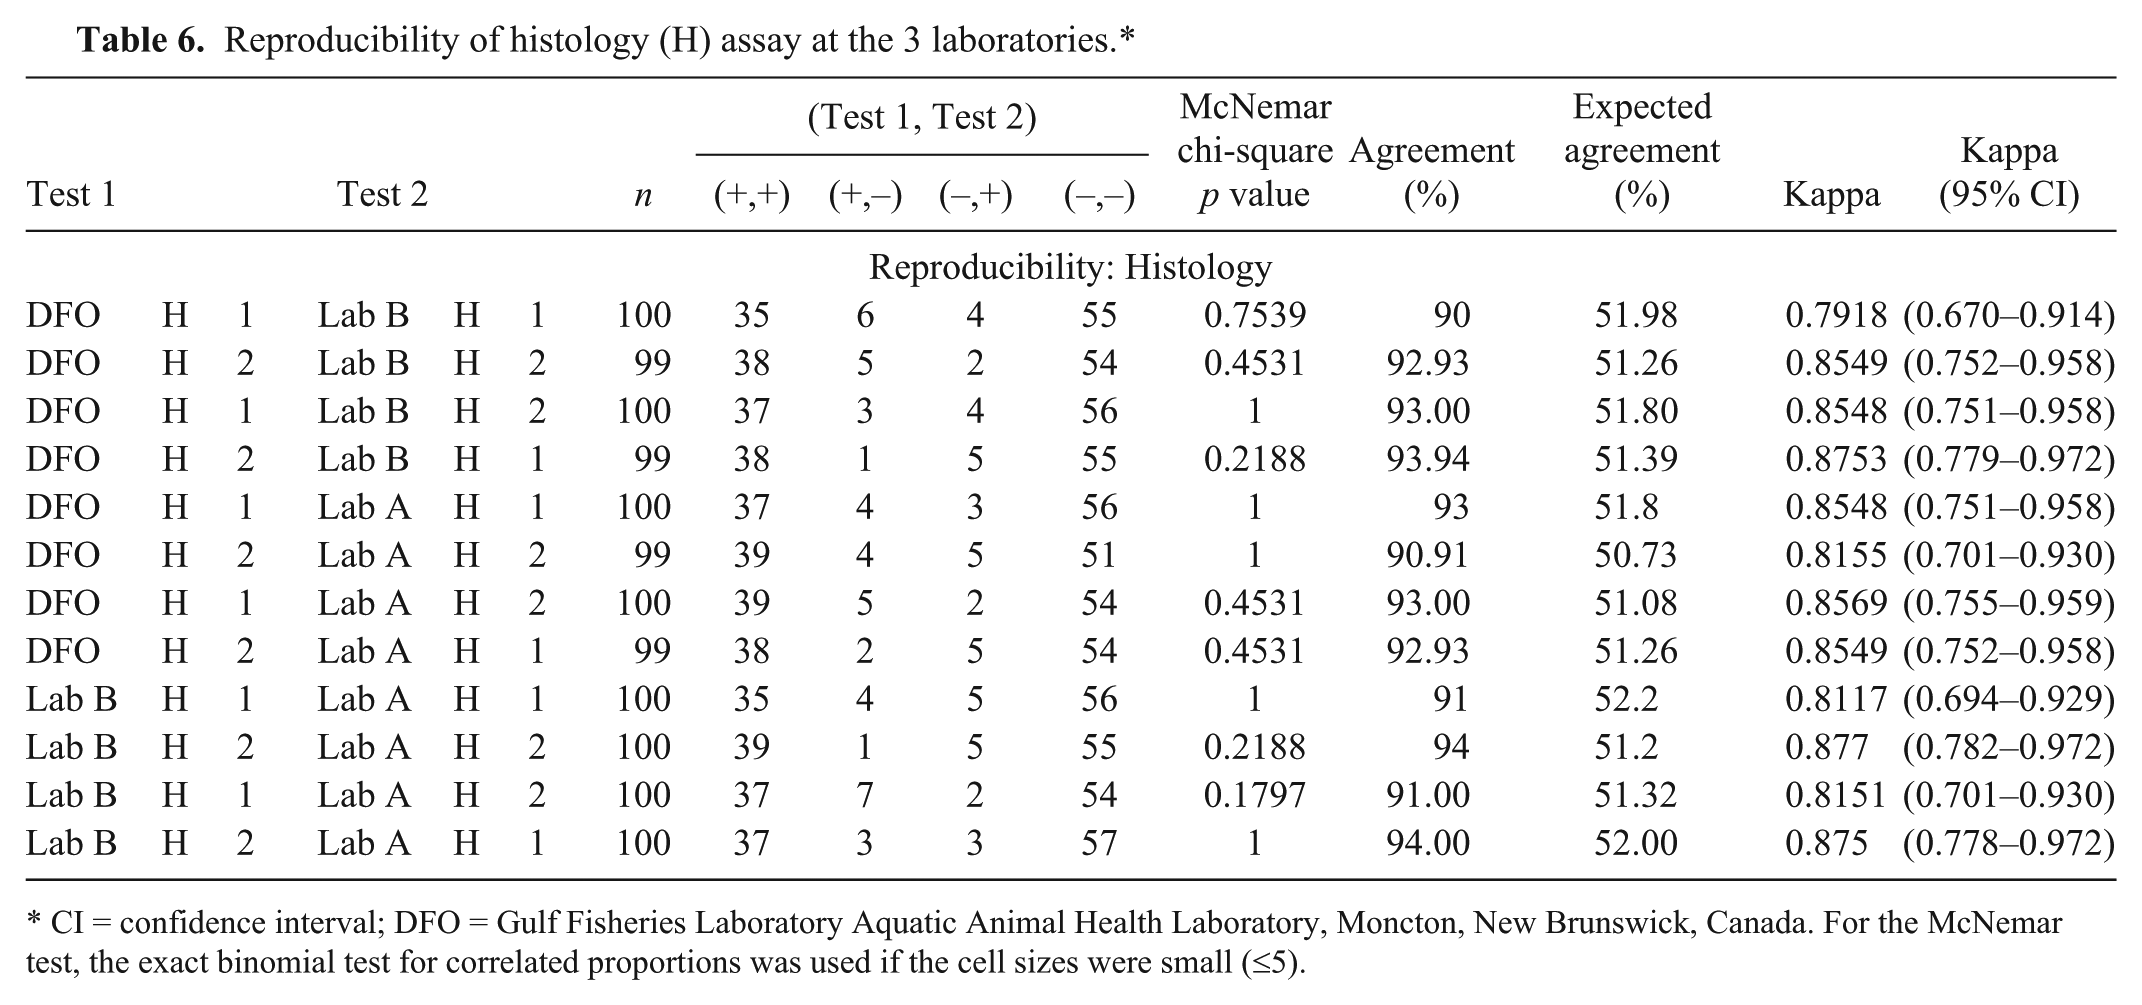
CI = confidence interval; DFO = Gulf Fisheries Laboratory Aquatic Animal Health Laboratory, Moncton, New Brunswick, Canada. For the McNemar test, the exact binomial test for correlated proportions was used if the cell sizes were small (≤5).
Latent class modeling
In all Bayesian models, the Markov Chain Monte Carlo appeared to converge. All history plots and quantile plots were stable. All autocorrelation plots had a fairly short range. The parameter estimates for all models with and without conditional dependence between pairs of tests are presented in Tables 7 and 8. The best models were chosen using the appropriateness of the Bayesian P value (not extremely low or extremely high) in combination with the lowest DIC. The 3 best fitting models were the base model with negative population restrained to zero (Bayes-3), the base model with dependence of DSp of the qPCR and PCR tests (Bayes-2covQP_(DSp only)), and the base model with both the restrained prevalence and the dependence of DSp of the qPCR and PCR tests (Bayes-3A). However, the DIC was not more than 3 units different among the 3 models. Although the DIC was lower and the covSp was significant in Bayes-2covQP_(DSp only) and in Bayes-3A, the Bayes-3 model is also a notable model as this model is less complicated and easier to understand. For these reasons, the conditionally independent model (Bayes-3) is likely the best model. All 3 models have estimated parameter estimates that are very similar.
The estimated parameters with the 95% probability intervals (in parentheses) for Bayesian models for all 3 prevalence populations (negative, moderate, and high) with all 3 tests: polymerase chain reaction (PCR), real-time PCR (qPCR), and histology (H). Models include base model (1), models with prior probabilities (3 and 3A), and sensitivity analysis models (4 and 1 set 2).*
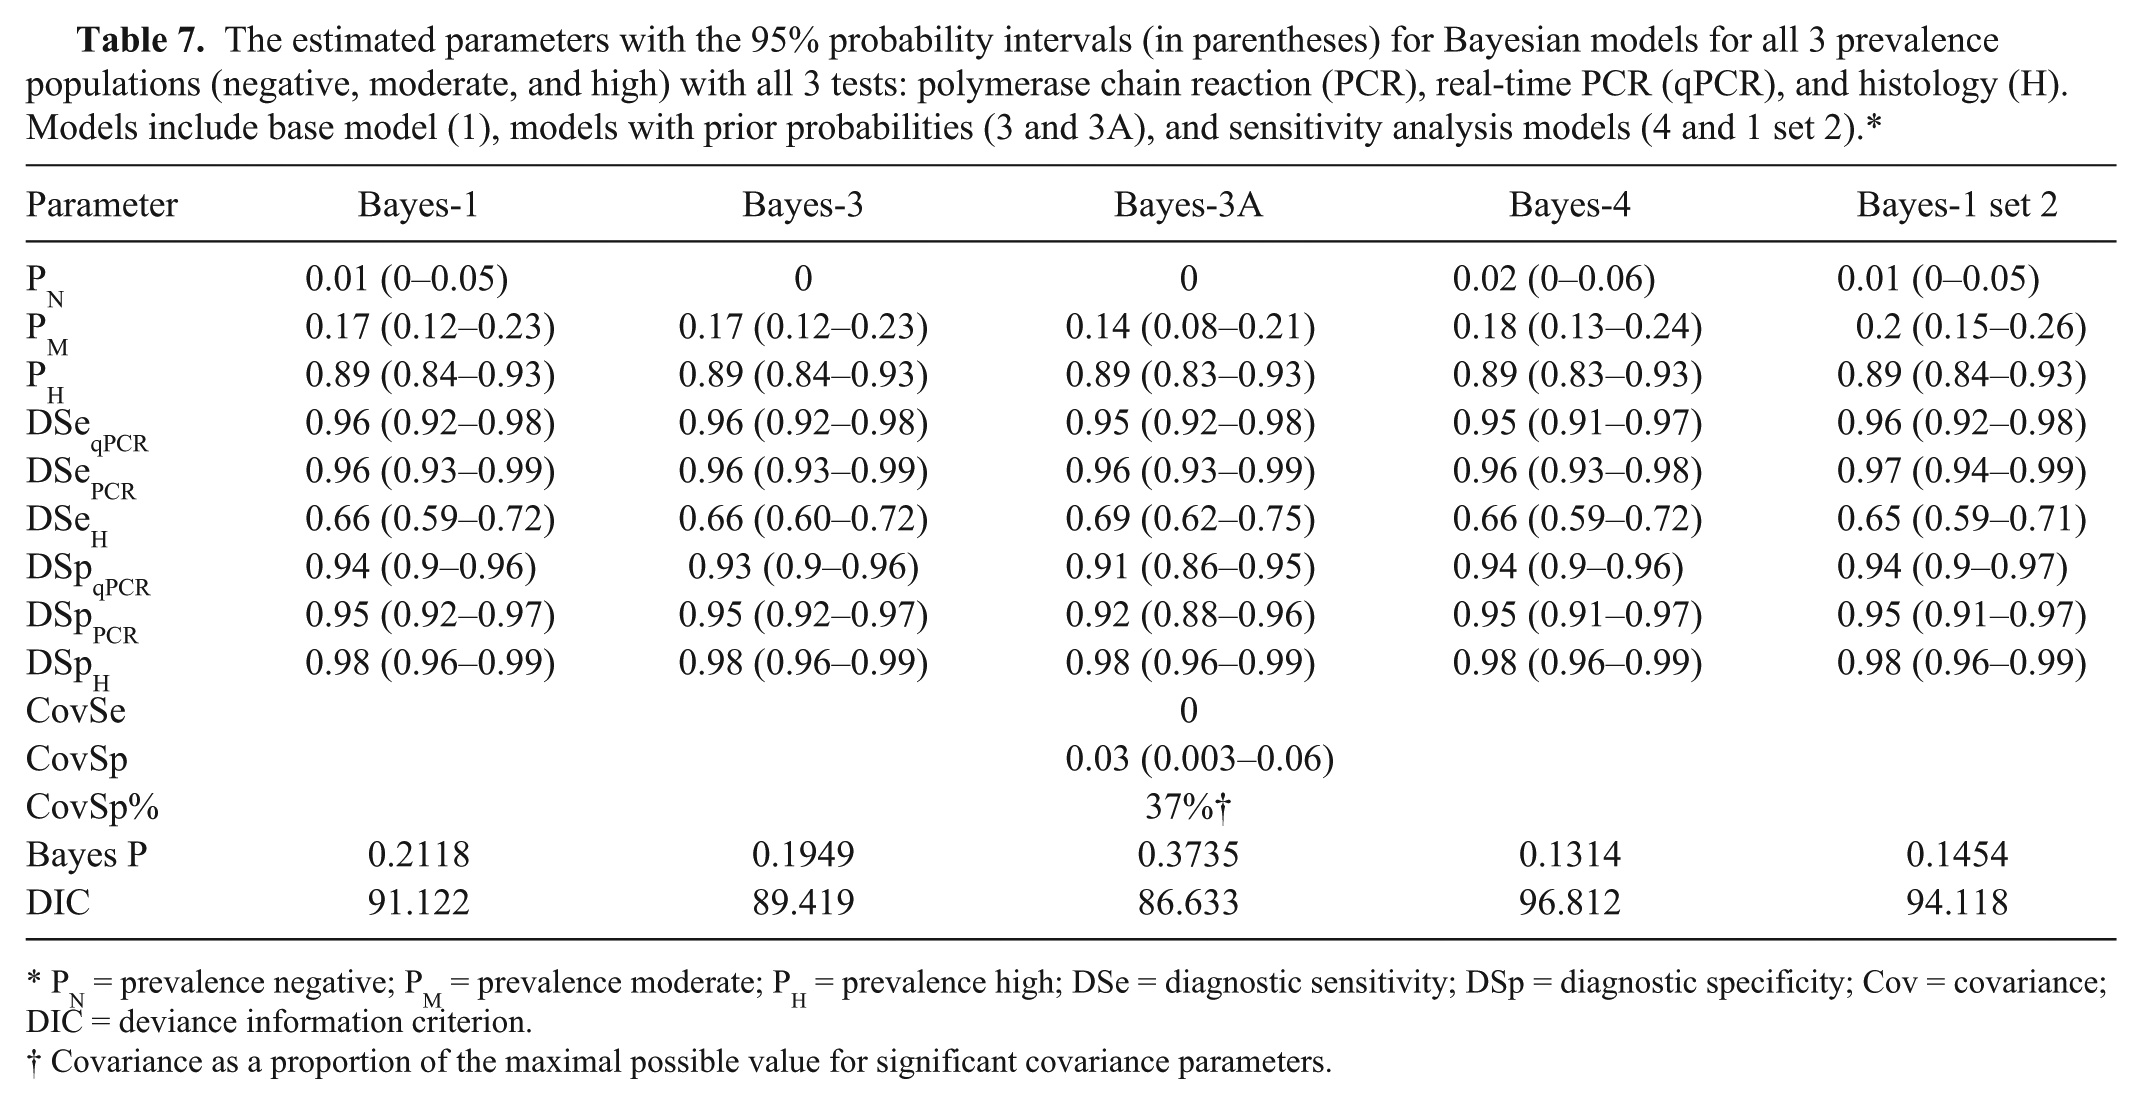
PN = prevalence negative; PM = prevalence moderate; PH = prevalence high; DSe = diagnostic sensitivity; DSp = diagnostic specificity; Cov = covariance; DIC = deviance information criterion.
Covariance as a proportion of the maximal possible value for significant covariance parameters.
The estimated parameters with the 95% probability intervals (in parentheses) for Bayesian models for all 3 prevalence populations (negative, moderate, and high) with all 3 tests: polymerase chain reaction (PCR), real-time PCR (qPCR), and histology (H). Models include all models with dependence of 2 tests.*
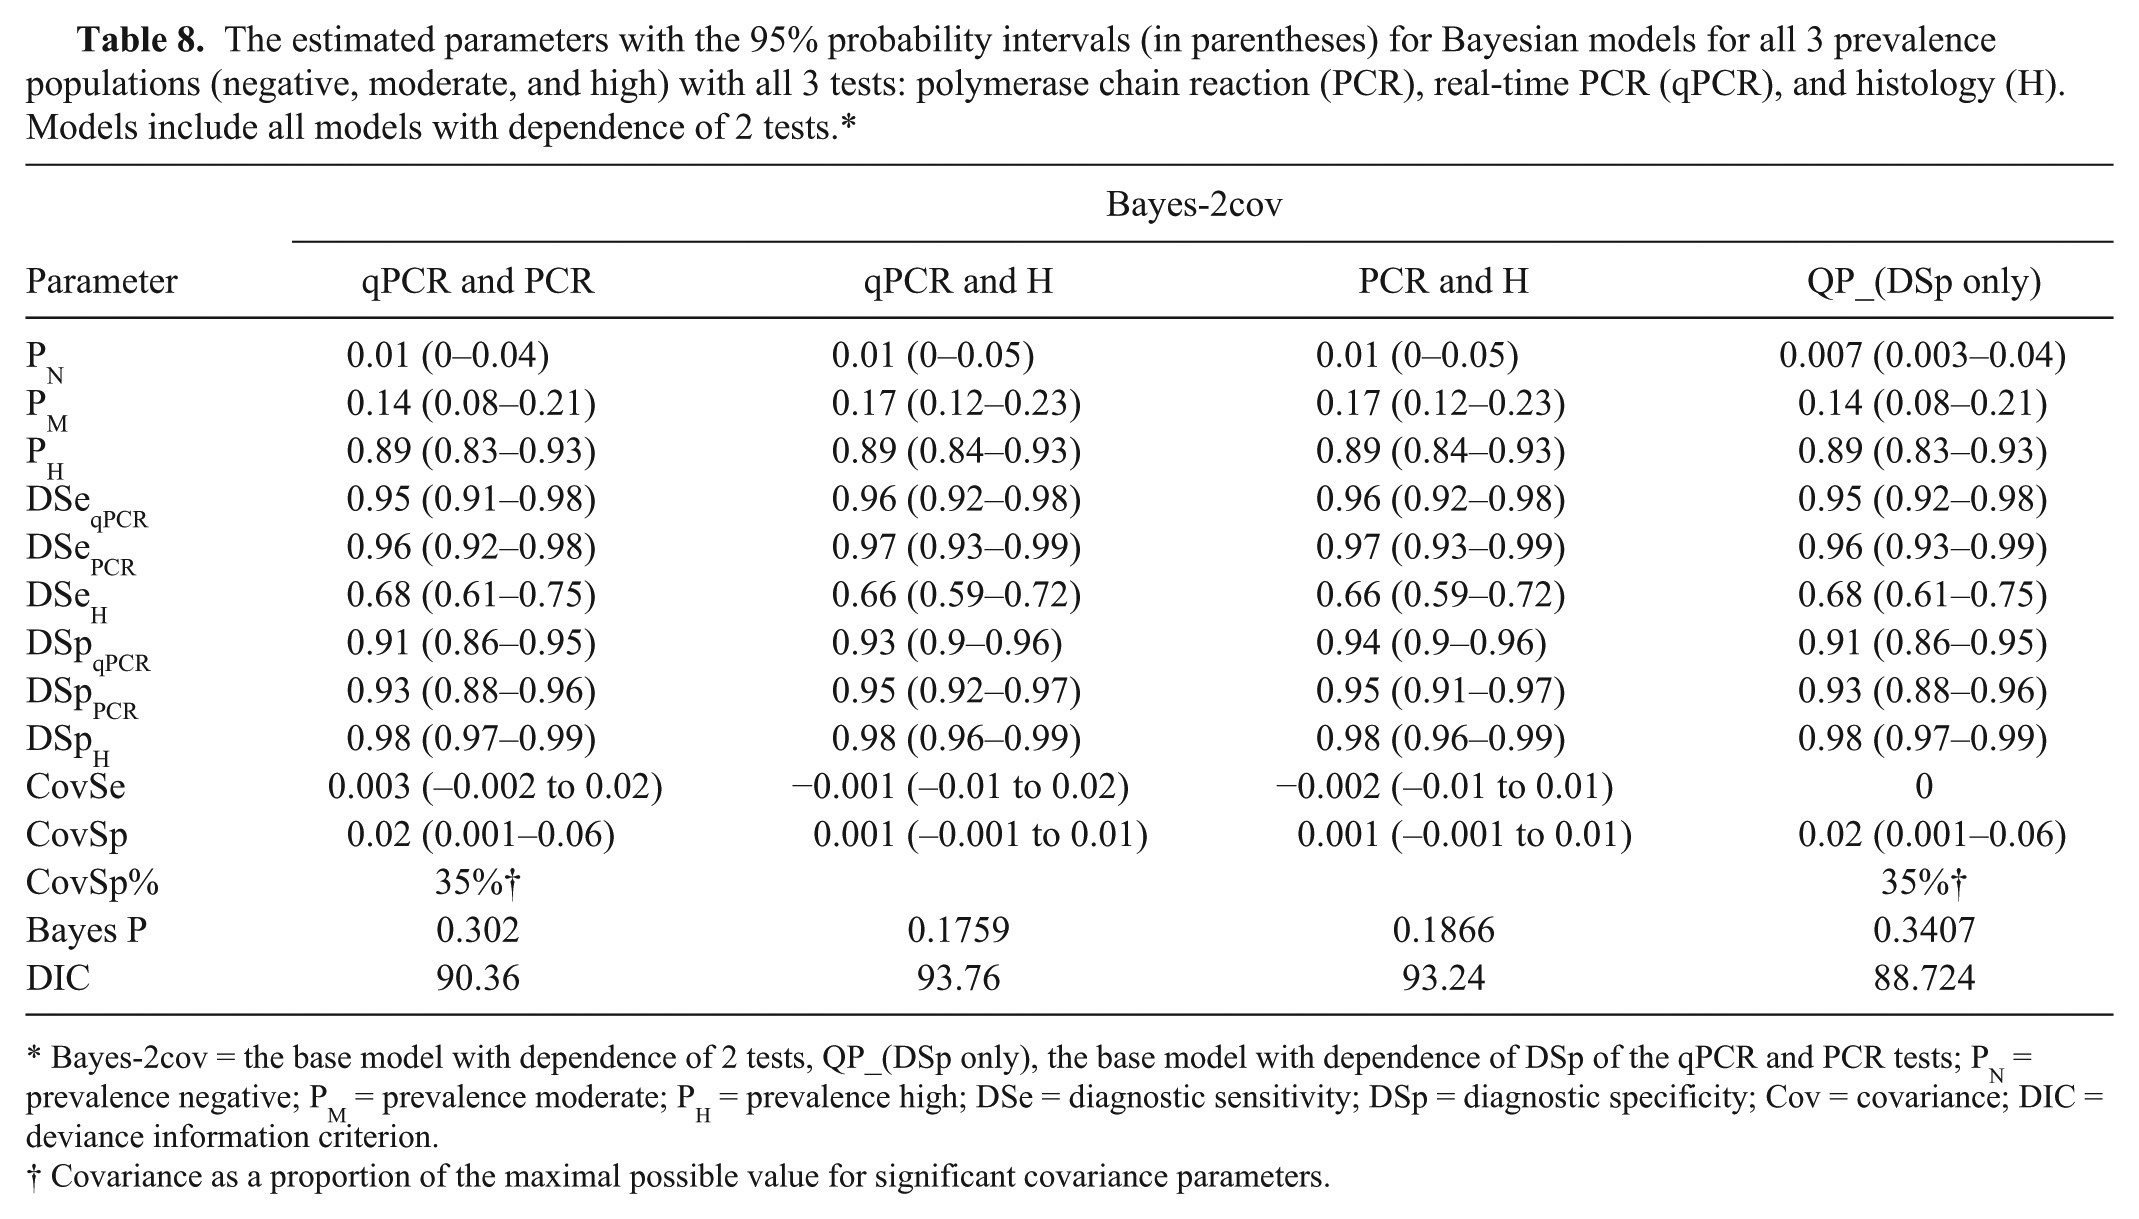
Bayes-2cov = the base model with dependence of 2 tests, QP_(DSp only), the base model with dependence of DSp of the qPCR and PCR tests; PN = prevalence negative; PM = prevalence moderate; PH = prevalence high; DSe = diagnostic sensitivity; DSp = diagnostic specificity; Cov = covariance; DIC = deviance information criterion.
Covariance as a proportion of the maximal possible value for significant covariance parameters.
DSe of the qPCR and PCR in these 3 models were very high, ranging from 0.95 to 0.96. DSe of the histology tests was not high and was estimated at 0.66–0.69. Examination of the confidence intervals reveals that the sensitivity of the histology test appears significantly lower than the 2 other tests. The specificities for all tests were high, ranging from 0.91 to 0.98. The histology had the highest DSp.
The 3 different models had similar estimated prevalences for the different prevalence level groups. The negative group was close to zero (0.007) in Bayes-2covQP_(DSp only). The moderate prevalence group ranged from 14% to 17% in the 3 models while the high prevalence group had an estimated prevalence of 89% in all 3 models. The probability intervals were not very wide with a maximum of 13% spread.
The estimates for all parameters for the sensitivity models with altered data (Bayes-4 and Bayes-1 set 2) are very close to the other models. There were only small changes in the parameters from the Bayesian sensitivity models to the other models giving evidence of the stability of the models.
Comparison between histology and qPCR results
As the qPCR is semiquantitative, a correlation between the histological ratings could be made. However, we were mostly interested to compare the limit of sensitivity of both methods, and to determine which Ct value corresponds to the point where loss of sensitivity occurs by histology. Using a dichotomous rating (positive or negative histology versus positive qPCR results), the histology produces a few negative results for Ct values of 20–33, but becomes highly unreliable above Ct 30. Histology detects only 31% of the animals found positive by qPCR at Ct 30 and above, and only 12% at Ct 33 and above (Fig. 2).
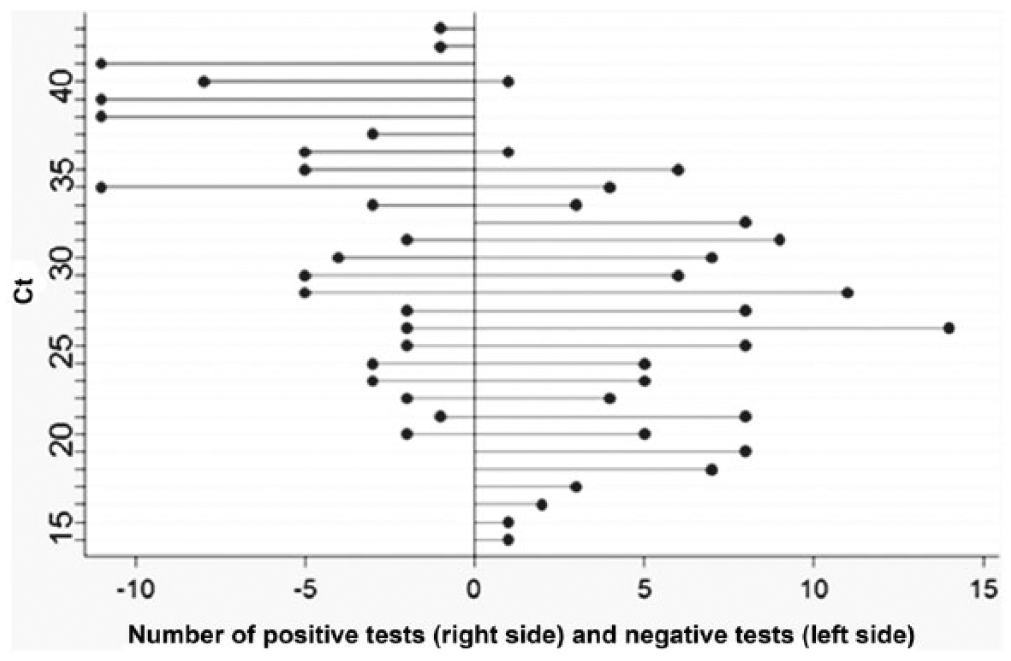
Number of histological test positive and negative based on the threshold cycle (Ct) value obtained by real-time polymerase chain reaction.
Cutoff for qPCR
For the above estimations of test performance parameters, the qPCR was set to positive if the Ct was less than 40. Using the Bayesian analysis with the prevalence of the negative group set at zero, estimates of DSe and DSp were made at different Ct cutoff levels. The resulting DSe and DSp estimates are presented in Figure 3. The point at which the 2 lines cross is the Ct at which the DSe and DSp is equivalent. In this case, that Ct is ~39.5. At that point, it appears both the DSe and DSp are 0.95. This may be the optimal Ct cut-point because both DSe and DSp are very high; however, the cutoff should be based on the purpose of the test.
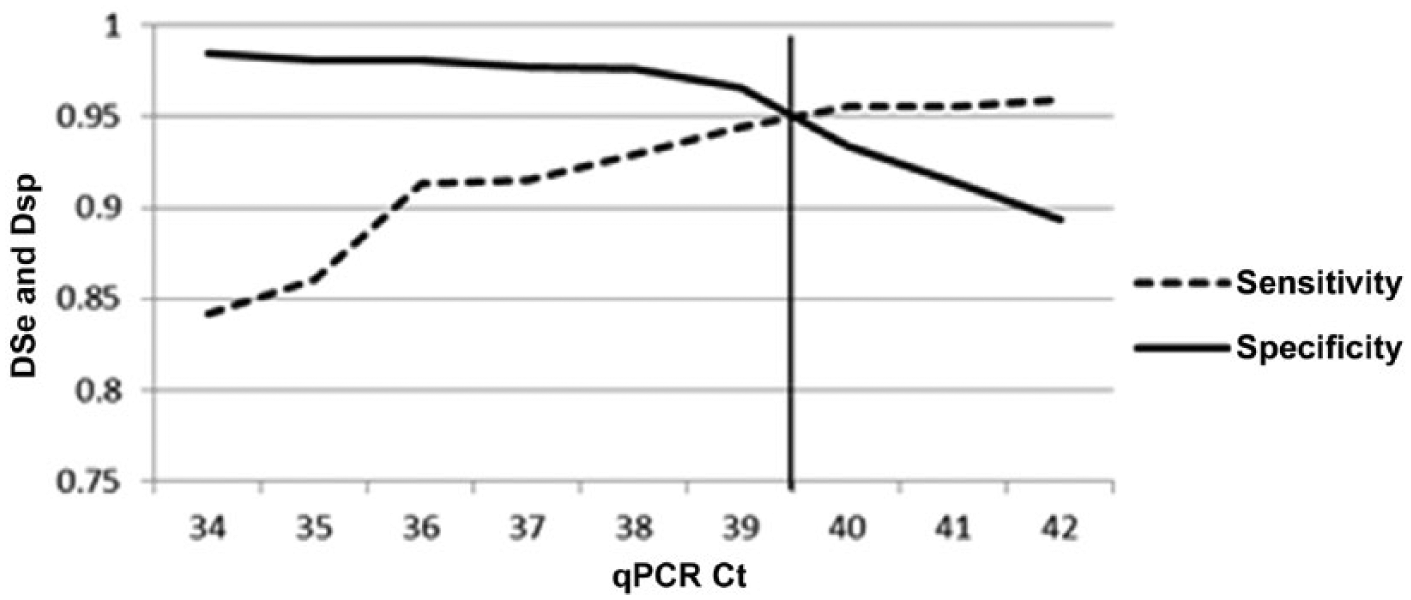
Two-graph receiver operating characteristic plot (sensitivity–specificity plot) with the diagnostic sensitivity (DSe) and specificity (DSp) graphed against increasing threshold cycle (Ct) cutoff values of the real-time polymerase reaction (qPCR) test. The vertical line represents the point at which DSe and DSp are equivalent.
Discussion
Repeatability of a diagnostic assay must be sufficiently good before further evaluating of other characteristics. In this study, outlier repeatability results were obtained in 1 laboratory during phase I. Low repeatability of polymerase chain reaction (PCR) (68%) and consequently poor reproducibility of this set of results with the other laboratories were observed. Such problems have been reported in other similar studies. 19 This highlights the importance of training, experience, setup, and quality assurance and quality control in a laboratory although other causes could lead to isolated problems in testing. For molecular assays, many factors surrounding the test performance itself are critical, such as the maintenance of equipment, prevention of cross contamination and data recording. One must also consider that the overall prevalence of nearly 50% obtained through the selection of the animals for validation is particularly well suited to detect contamination problems since it will bring contamination pressure to the highest level.
The importance of MSX raises the importance of the disease in shellfish health as well as with transfers associated with industry activities and import/export relevance. 16 In our study, the use of LCM methods was successful in estimating the test characteristics and population prevalences without a gold standard for MSX detection. The tests used included qPCR, PCR, and histology. The qPCR and PCR assays had the highest DSe (95–97%). In contrast, the DSe of the histology was lower (65–69%). It is often reported that PCR assays have high sensitivities. 3 In order to identify the organism by histology, the parasite must be intact and present within the section observed. In contrast, the presence of the intact organism is not essential for the molecular tests to identify MSX DNA, and the tissue sampled is larger.
The DSp for all tests was >90%. The various Bayesian models yielded very similar results. Model sensitivity analysis was conducted using the modified populations (Bayes-4 and Bayes-1 set 2). These models gave very similar results to the other models using the original data, indicating that the models were stable.
Bayesian methods proved to be useful in adjusting for prior knowledge of the prevalence from the negative population and for assessing conditional dependence between tests. Theoretically, conditional dependence is more likely to be found between tests that have the same biological process. 7 There was evidence of potential dependence between the DSp of the qPCR and PCR. However, this model was not the model assessed as the “best” model due to its DIC value not being significantly different than the conditionally independent model and the added model complexity due to the addition of the covariance. Models with conditional independence and a negative population prior probability set to zero were deemed the best fitting model. However, it is prudent to examine all models and appreciate their similarities.
One of the assumptions in our test performance evaluation is that the test performs consistently in all populations. Violation of this assumption has been seen previously in fish diseases. 3 Because this assumption was not tested in our evaluation, the test parameters presented can be interpreted as more of an average of test performance among differing populations rather than being the estimate for all populations. Future work could undertake an evaluation of test consistency among differing populations.
There were 3 different prevalence populations. With prior knowledge of the disease history of the negative oyster population, setting a prior to zero resulted in posterior point estimates of approximately zero (7 × 10e-7). This outcome is consistent with what is known about the population. The moderate prevalence population had an estimated prevalence ranging from 14% to 17% depending on the model. This population was from oysters in an area of the Bras d’Or Lakes away from the outbreak sites. The significance of this finding for this population must be evaluated in combination with the histological observations and temporal samples. By combining qPCR Ct values, histology scale rating, and yearly data, with prevalence levels, a better understanding of disease dynamics is obtained, and an informed decision can be made regarding measures to control the spread of MSX.
The high prevalence population originated from oysters recovered from the outbreak region. During the original epizootic, mortality rates in these areas were estimated at >80%. 16 The estimated prevalence of these oysters was 89%, which fell into the predicted prevalence range (50–90%). Epizootics of MSX in American oysters have been reported when prevalence attains 30% within 2 years of exposure. 1
For the purpose of our evaluation, the qPCR cut-point for positive oysters was set at 40 Ct. The DSe and DSp can be greatly influenced by the Ct level of the qPCR test. If the Ct cutoff is shifted higher so a proportion of the reference samples move from the negative category to the positive category, the DSe may increase while the DSp may decrease. On the other hand, if the Ct cutoff is lowered, the DSe may decrease while the DSp may increase. Deciding on the threshold will be influenced by how the test will be used so that it is “fit for purpose.” For example, if the test will be used to screen for freedom for disease, it likely is more important to have a high DSp rather than a high DSe to minimize false positives. Using an epidemiologic approach to determine the cutoff value of the Ct can help minimize misclassification while helping the assay achieve fitness for purpose.
By examining the sensitivity–specificity plot (Fig. 3), the optimal Ct cut-point for the qPCR test appeared to be in the 39–40 range, giving excellent DSe and DSp results for the qPCR test. Although this is a useful exercise to epidemiologically pick a Ct cut-point for the test, it should be balanced by the purpose of the test. As shown in Figure 3, there is not much gain in DSp by lowering the cut-point for qPCR, for a loss of sensitivity that might be unacceptable. In addition, because all models are mathematical structures, if the Ct cut-point changes and we believe this is the true biological cut-point between positive and negative oysters, the PCR and histology test parameter estimates will also be slightly adjusted within the models. The Ct cut-points are sometimes determined by the arbitrary decision to classify samples as false positive, and choosing a cutoff Ct value that eliminates these results. 20 It is, however, advisable to carefully examine the reason behind the suspected false-positive results: could the Ct be true positive, or could they represent contamination problems? The approach used herein is evidence-based using the entire set of results and balances the risk and benefit of falsely declaring a sample negative by setting the cutoff too low. It is important to know how diagnostic tools perform regarding DSe, DSp, repeatability, and reproducibility, although practical aspects in the laboratory should also be discussed, as their effect are not directly measured by the models but are nonetheless critical to the test.
Current practice for diagnostic application in the DFO is to run qPCR in duplicates. This was not the case during validation, when single wells were used. When only 1 of 2 wells is positive, the policy is to repeat the assay. If contamination, human errors, and nonspecific signals are not an issue, the lack of duplication can only be caused by random sampling effect with very low template in the sample (or Poisson distribution). This effect was observed during the limit of detection test, where dilutions containing <38 copies of DNA plasmid were often detected at very high Ct values but not in both wells. In practice, duplication adds confidence when both wells are positive or negative; results not showing in both wells raise issues and questions, and policies should be established in the testing laboratory to interpret these inconclusive results.
For PCR and qPCR, cross-contamination can be an issue. 18 Controls (e.g., extraction blanks, negative and positive controls, and separation of pre- and post-PCR material) are critical. One additional benefit of the qPCR kit selected is the presence of uracil–DNA glycosylase (UDG), which prevents reamplification of carryover PCR products. 18 Additionally, it is recommended that a positive control is used that is distinct from the true pathogen. A cloned sequence with an insert that is bound by a second probe can serve this purpose. Although all these controls are able to warn an analyst of a problem with an entire batch of samples, controls are not entirely safeguarding the process from occasional false-positive results. False-negative results, on the other hand, can be avoided by testing for endogenous genes, demonstrating that the extraction and PCR process was correct and that the sample was of sufficient quality.
The DSe and DSp have been estimated using LCM. Because the qPCR and PCR have high DSe and DSp, one might believe that these tests are suitable for use in all situations. However, the characteristics, cost, time, and the purpose of the test are all elements to consider. Some examples for the purpose of diagnostic tests include confirmation of infection, surveillance, testing for freedom of disease, demonstrating geographic distribution of disease, and prevalence estimation to identify if control measures are working.
If testing is needed to find an infection, a test that has a high DSe may be desirable. A test with a low DSe would have a greater likelihood of providing false-negative results. The inherent risk with false-negative results is that disease may be allowed to spread, causing an outbreak in the population. On the other hand, in the context of a surveillance program that periodically tests multiple oysters to ensure an area is still free of MSX, it may be reasonable to use a less expensive test that has only a fair DSe, such as histology, because the ability to diagnose MSX in a region will be high (herd DSe) if larger sample sizes are tested. Histology also provides some indication on physiological impacts to the host. Documentation of the life stage observed may also be useful to the management of a disease situation.
Histology is unlikely to detect infected animals when Ct values of 30–33 and higher are obtained. Occasional outliers are expected, as the infection can be focal, and tissues for PCR represent a larger sample than a single histology section. Based on previous testing using end-point PCR, it was assumed that sensitivity of PCR was higher and prevalence in positive sites would typically be 30% or higher by PCR than by histology. The qPCR confirms this observation and provides a threshold of higher risk for false-negative results by histology. However, in an effort to confirm qPCR findings, slides can be reviewed, additional slides created, alternative methods such as in situ hybridization can be used, 17 and confirmation of initial molecular results can be determined by sequencing.
Molecular testing applied in surveillance programs and for declaration of disease freedom suggests a requirement to maximize detection using the test with a higher DSe to detect the parasite prior to development of disease. In determining fitness for purpose of the molecular tests, decision makers must not only be prepared for positive molecular results with no visual confirmation but be ready to implement actions to prevent inadvertent spread of the parasite to areas with environmental conditions that may cause disease.
Footnotes
Acknowledgements
We wish to thank Dr. Frank Berthe for initial guidance in this project and Dr. Charles Caraguel for helpful discussions. We also wish to recognize the contribution of participating analysts, Michelle Maillet, Michel Goguen, and Jeannette Arseneault (Fisheries and Oceans Canada); Dr. Grant Spearman (Nova Scotia Department of Fisheries and Aquaculture); Dr. Dave Groman (Aquatic Diagnostic Services, Atlantic Veterinary College [AVC]) and analysts (Department of Pathology & Microbiology (Mollusc Health), AVC), as well as Robert Merritt (New Brunswick Department of Agriculture, Aquaculture and Fisheries).
Authors’ contributions
All authors contributed to conception and design of study, and to acquisition, analysis, and interpretation of data. N Gagné and C McClure drafted the manuscript, and M Stephenson and A Veniot reviewed the draft. N Gagné critically reviewed the manuscript. All authors gave final approval and agree to be accountable for all aspects of the work in ensuring that questions relating to the accuracy or integrity of any part of the work are appropriately investigated and resolved.
a.
Steri 250 bead sterilizer, Sigma Aldrich, St. Louis, MO.
b.
QIAamp DNA mini kit, Qiagen Inc., Mississauga, Ontario, Canada.
c.
Multiskan Spectrum, Thermo Scientific, Vantaa, Finland.
d.
CAS-1200N, Corbett Research, Eight Mile Plains, Queensland, Australia.
e.
Platinum PCR Supermix, Life Technologies, Austin, TX.
f.
StrataClone PCR cloning kit and SoloPack PCR cloning competent cells, Agilent Technologies Inc., Santa Clara, CA.
g.
GeneJET plasmid miniprep kit, Thermo Scientific, Vilnius, Lithuania.
h.
AmpliTaq Gold mix, Life Technologies, Austin, TX.
i.
FideliTaq PCR master mix 2×, Affymetrix Inc., Santa Clara, CA.
j.
2× Brilliant SYBR Green qPCR master mix, Agilent Technologies Inc., Santa Clara, CA.
k.
SYBR Green master mix, Life Technologies, Austin, TX.
l.
Mx3000P real-time thermocycler, Agilent Technologies Inc., Santa Clara, CA.
m.
TaqMan probe, Applied Biosystems Inc., Foster City, CA.
n.
TaqMan Gene Expression master mix with UDG, Life Technologies, Austin, TX.
o.
NanoDrop 2000, Thermo Scientific, Wilmington, DE.
p.
Stata 13, StataCorp LP, College Station, TX.
Declaration of conflicting interests
The author(s) declared no potential conflicts of interest with respect to the research, authorship, and/or publication of this article.
Funding
The author(s) disclosed receipt of the following financial support for the research, authorship, and/or publication of this article: This study was financially supported by operational funds from the Department of Fisheries and Oceans Canada.