
Abstract
The pronounced fragility that characterizes swine erythrocytes is likely to produce a variable degree of hemolysis during blood sampling, and the free hemoglobin may then unpredictably bias the quantification of several analytes. The aim of this study was to evaluate the degree of acceptability of values obtained for several biochemical parameters at different levels of hemolysis. Progressively increased degrees of physical hemolysis were induced in 3 aliquots of 30 nonhemolytic sera, and the relative effects on the test results were assessed. To define the level of hemolysis, we used both visual estimation (on a scale of 0 to 3+) and analytical assessment (hemolytic index) and identified the best analytical cutoff values for discriminating the visual levels of hemolysis. Hemolysis led to a variable and dose-dependent effect on the test results that was specific for each analyte tested. In mildly hemolyzed specimens, C-reactive protein, haptoglobin, β1-globulin, β2-globulin, α1-globulin, γ-globulin, sodium, calcium, and alkaline phosphatase were not significantly biased, whereas α2-globulin, albumin, urea, creatinine, glucose, total cholesterol, aspartate aminotransferase, alanine aminotransferase, gamma-glutamyl transferase, nonesterified fatty acids, bilirubin, phosphorus, magnesium, iron, zinc, copper, lipase, triglycerides, lactate dehydrogenase, unbound iron-binding capacity, and uric acid were significantly biased. Chloride and total protein were unbiased even in markedly hemolyzed samples. Analytical interference was hypothesized to be the main source of this bias, leading to a nonlinear trend that confirmed the difficulty in establishing reliable coefficients of correction for adjusting the test results.
Introduction
Swine erythrocytes appear to be more fragile compared with those of other domestic species, with the exception of sheep. 13 This phenomenon has been mainly attributed to different physical characteristics (e.g., size and shape) and biochemical properties of cells (e.g., antioxidant activity). Therefore, the conditions during blood sampling, transportation, and storage are critical for the suitability of the blood samples taken from swine. Despite adherence to best practices by well-trained personnel, the average percentage of markedly hemolyzed samples can be as high as 7–8% (Di Martino G, et al. Effetto dell’età e del sesso su alcuni parametri ematici correlati allo stress in suini pesanti all’ingrasso [Age and gender effect on some blood parameters related to stress in fattening heavy pigs]. In: Proceedings of XXXVII SIPAS Annual Meeting, Piacenza, Italy. 2011. In Italian). Furthermore, data obtained in a routine surveillance study of 780 pigs revealed a rate of markedly hemolyzed samples as high as 20% among those taken between the end of the weaner phase and the beginning of the finishing period (Di Martino G, unpublished results).
The presence of cell-free hemoglobin in serum, most typically attributable to in vitro (spurious) hemolysis, affects the quantification of several hematological and biochemical parameters in human medicine. 6 Hemolysis is a complex process associated with a number of potential interfering factors, including the release of intracellular substances, artifactual dilution, analytical interference, and release of proteolytic enzymes.4,6 Despite the large amount of data gathered in human medical studies, in which hemolyzed specimens exhibited a prevalence of up to 3–4% among all diagnostic samples, 6 information about the potential biasing of biochemical profile and acute phase protein (APP) results due to hemolysis is limited in veterinary medicine to few studies.2,12,15 This is a critical issue because APPs offer useful nonspecific information regarding the health status of animals, and APPs may be biomarkers of poor welfare in swine. 16
Because of the lack of information about the potential biasing of diagnostic test results by spurious hemolysis, veterinary diagnostic laboratories generally provide warnings about the presence of mild hemolysis in their medical reports, whereas samples with moderate or frank hemolysis are considered unsuitable and are rejected. 7 The method used to assess the content of cell-free hemoglobin in veterinary samples varies among veterinary diagnostic laboratories, but it typically involves using a visual score of 0 to 3+, which follows the current recommendations for evaluating hemolysis in human samples. 7 Notably, hemolysis in samples is a critical issue for experimental studies of farmed and laboratory pigs, in which it is often impossible (at time of slaughter) or ethically questionable (according to the principles of replacement, reduction, and refinement) to repeatedly collect blood from the same individual. It is therefore essential to ensure a high degree of sample quality, thus limiting the need to recollect blood from animals. The aim of this study was to assess the bias due to hemolysis in the values for leading biochemical parameters, C-reactive protein (CRP) and serum haptoglobin (Hp), and to compare the visual and automated methods of assessing the degree of hemolysis in swine serum samples.
Materials and methods
At the abattoir, 6 fattening pigs (sex ratio 1:1, castrated males) from 6 batches were randomly selected during 3 different slaughtering days (i.e., 2 batches per day were sampled). The animals were crossbred commercial heavy pigs (Landrace × Large White) of ~41 weeks of age, weighing 170 ± 9 kg. The pigs were declared in good health status by official Veterinary Services and delivered for human consumption. The carcasses did not present any evidence of meat abnormalities, joint lesions, pneumonia, pleurisy, pericarditis, gastric ulcers, tail biting, or ear biting. None of the livers showed evidence of either gross lesions or abnormalities in shape, size, and consistency. All procedures and animal care were performed in compliance with Council Regulation (EC) n. 1099/2009.
Blood was drawn from a jugular incision (without needle), placed into 10-mL serum tubes, a and then divided into 4 equal aliquots (A, B, C, and D). No particular efforts were made to minimize the risk of spurious hemolysis to reproduce routine practice. The samples were immediately transported to the reference lab and were centrifuged at 2,400 × g for 10 min at room temperature to obtain the separation of serum from the clot. Six of the collected samples received a visual score of 1+ for hemolysis and were excluded because they were unsuitable according to our study design (i.e., only hemolysis-free samples were to be used for testing the biasing of test results caused by an increasing degree of hemolysis). Thirty of the original samples were included in this study. The B, C, and D aliquots of each animal’s sample were subjected to a progressively increased level of physical stress (i.e., rotary shaking) to generate a degree of hemolysis that was visually scored as 1+, 2+, or 3+, according to a reference colorimetric scale. 7 The samples were then re-centrifuged and immediately analyzed, and the analytical imprecision (i.e., percent coefficient of variation [CV%], shown in Table 1) of the values for the tested parameters was sufficiently limited to allow testing in a single analytical run rather than in duplicate. The intra-assay imprecision was determined by testing 10 replicates of 1 pool of 10 routine samples in a single analytical run. The same pool was used to determine the interassay imprecision by testing in duplicate on 5 different days. The pool was frozen into aliquots, and vials were only thawed as required for each analytical run in order to prevent potential variation as a result of repeated freeze–thaw cycles.
List of methods used for the biochemical parameters analyzed in the swine serum samples.*
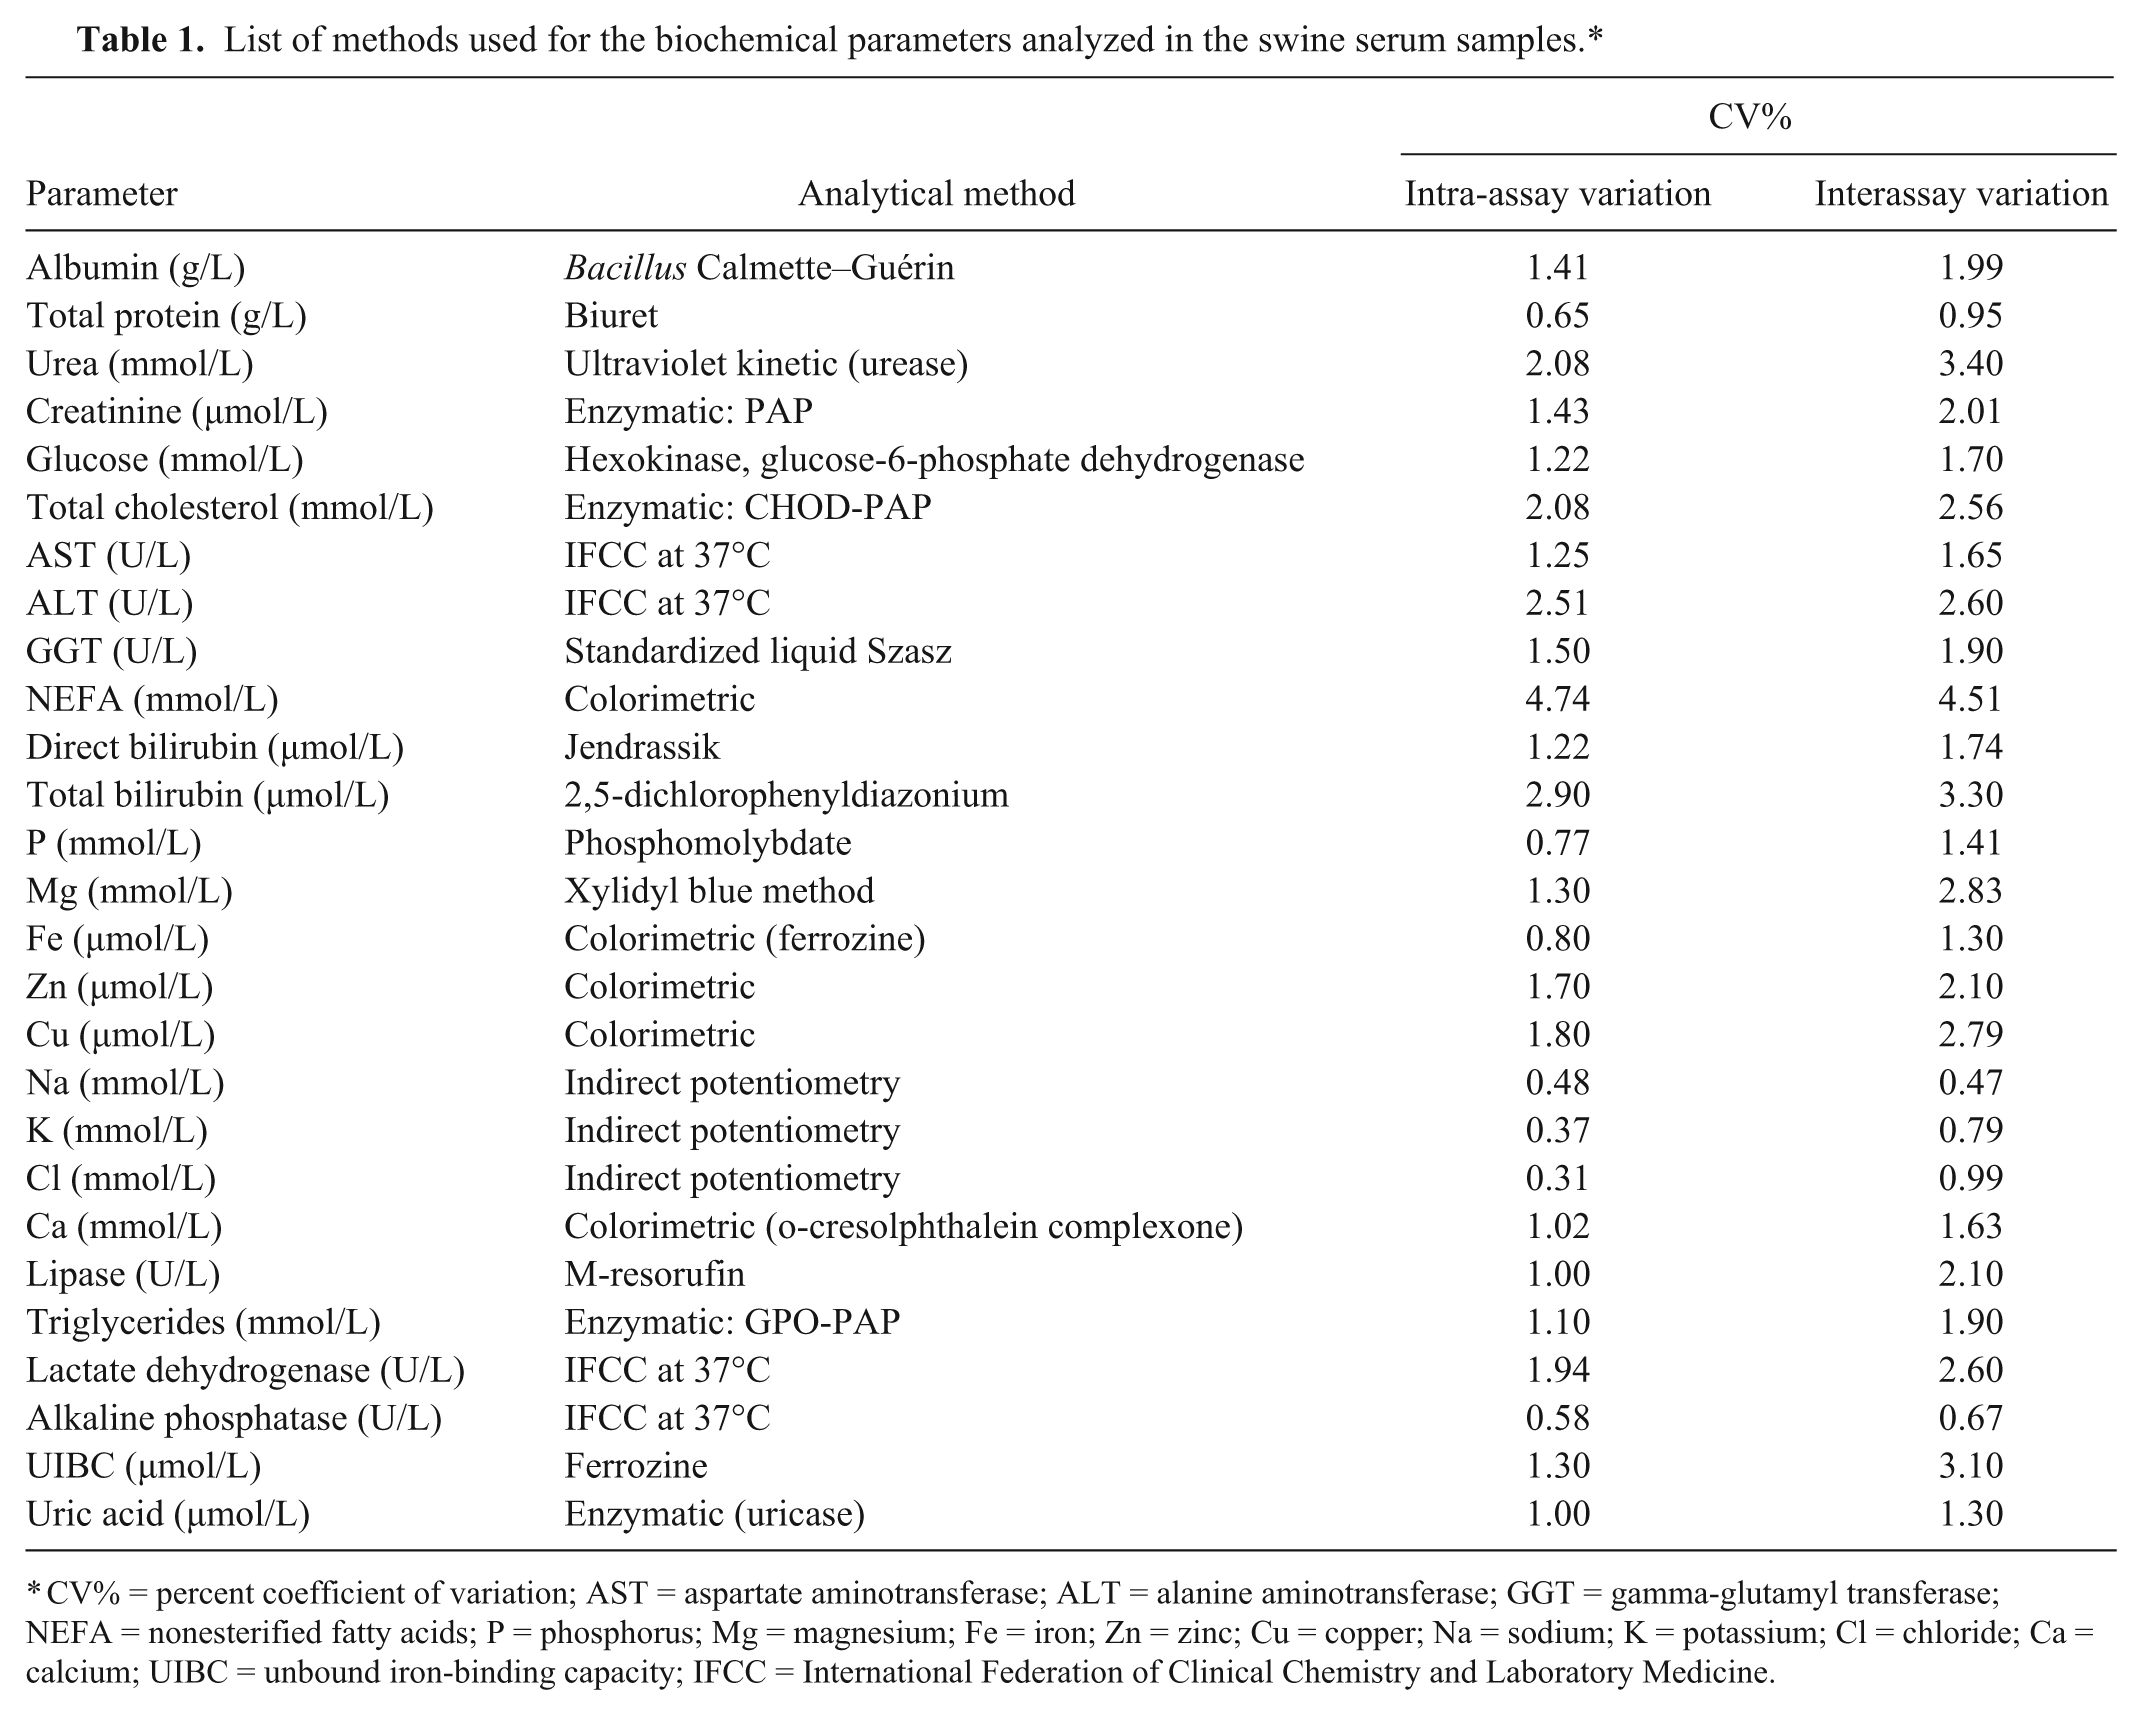
CV% = percent coefficient of variation; AST = aspartate aminotransferase; ALT = alanine aminotransferase; GGT = gamma-glutamyl transferase; NEFA = nonesterified fatty acids; P = phosphorus; Mg = magnesium; Fe = iron; Zn = zinc; Cu = copper; Na = sodium; K = potassium; Cl = chloride; Ca = calcium; UIBC = unbound iron-binding capacity; IFCC = International Federation of Clinical Chemistry and Laboratory Medicine.
The concentration of Hp was determined using a commercial enzyme-linked immunosorbent assay (ELISA) kit. b The concentration of CRP was also determined using a commercial ELISA kit. c The percentages of the protein fractions were determined using semiautomated electrophoresis d in an 0.8% agarose gel. e The hemolytic index and all of the values for the biochemical parameters (Table 1) were determined using the same instrument f according to the manufacturer’s specifications and using proprietary reagents, with the exception of the content of nonesterified fatty acids (NEFA), which was measured using a commercial reagent. g The hemolytic index was determined from bichromatic readings at 570/600 nm. The highly significant correlation between this index and the concentration of cell-free hemoglobin as determined using a cyanmethemoglobin reference assay was established in a previous study using human blood. 10
The receiver operating characteristic (ROC) curve analysis was applied to identify the best cutoff analytical values for discriminating the visual levels of hemolysis (0 vs. 1+; 1+ vs. 2+; 2+ vs. 3+). For each comparison, the sensitivity (Se), specificity (Sp), and the area under the curve (AUC) with the 95% confidence interval (95% CI) were calculated. The Wilcoxon signed rank test was used to assess the between-aliquot differences. The data analyses were performed using a statistical software program. h
Results
According to the ROC curve analysis, a cutoff of 36 mg/dL provided the best sensitivity (1.00) and specificity (1.00) in differentiating levels 0 and 1+ (AUC: 1.00; 95% CI: 1.00–1.00). A cutoff of 72 mg/dL provided the best sensitivity (1.00) and specificity (0.97) in differentiating levels 1+ and 2+ (AUC: 0.99; 95% CI: 0.99–1.00). A modest overlap was found between the 2+ and 3+ levels of hemolysis, with discriminatory cutoff values of 127 mg/dL (Se: 1.00; Sp: 0.70) and 177 mg/dL (Se: 0.80; Sp: 1.00), respectively (AUC: 0.97; 95% CI: 0.93–1.00).
The median values for the various parameters tested are shown (with the interquartile range) in Table 2, as are the effects of the progressively increasing levels of hemolysis on these values (expressed as the estimated median of the differences relative to that at level 0). Interestingly, 23 of the 34 parameters tested were significantly biased at the 1+ visual level of hemolysis, which corresponds to ~31.6 μmol/L (i.e., 51 mg/dL) of cell-free hemoglobin. With an increasing level of hemolysis, the number of parameters with significantly biased values increased, reaching 27 out of 34 at the 2+ visual level of hemolysis (corresponding to ~70.1 μmol/L of cell-free hemoglobin; i.e., 113 mg/dL) and 30 out of 34 at the 3+ visual level of hemolysis (corresponding to ~133.4 μmol/L of cell-free hemoglobin; i.e., 215 mg/dL). The quantification of potassium was not estimable at the 2+ visual level in 10 out of 30 samples, and at the 3+ visual level in 22 out of 30 samples, because the resulting concentration was over the limit of linearity for the method (10 mmol/L).
Effect of hemolysis on the quantification of 34 clinical chemistry analytes in 30 healthy slaughtered pig sera.†
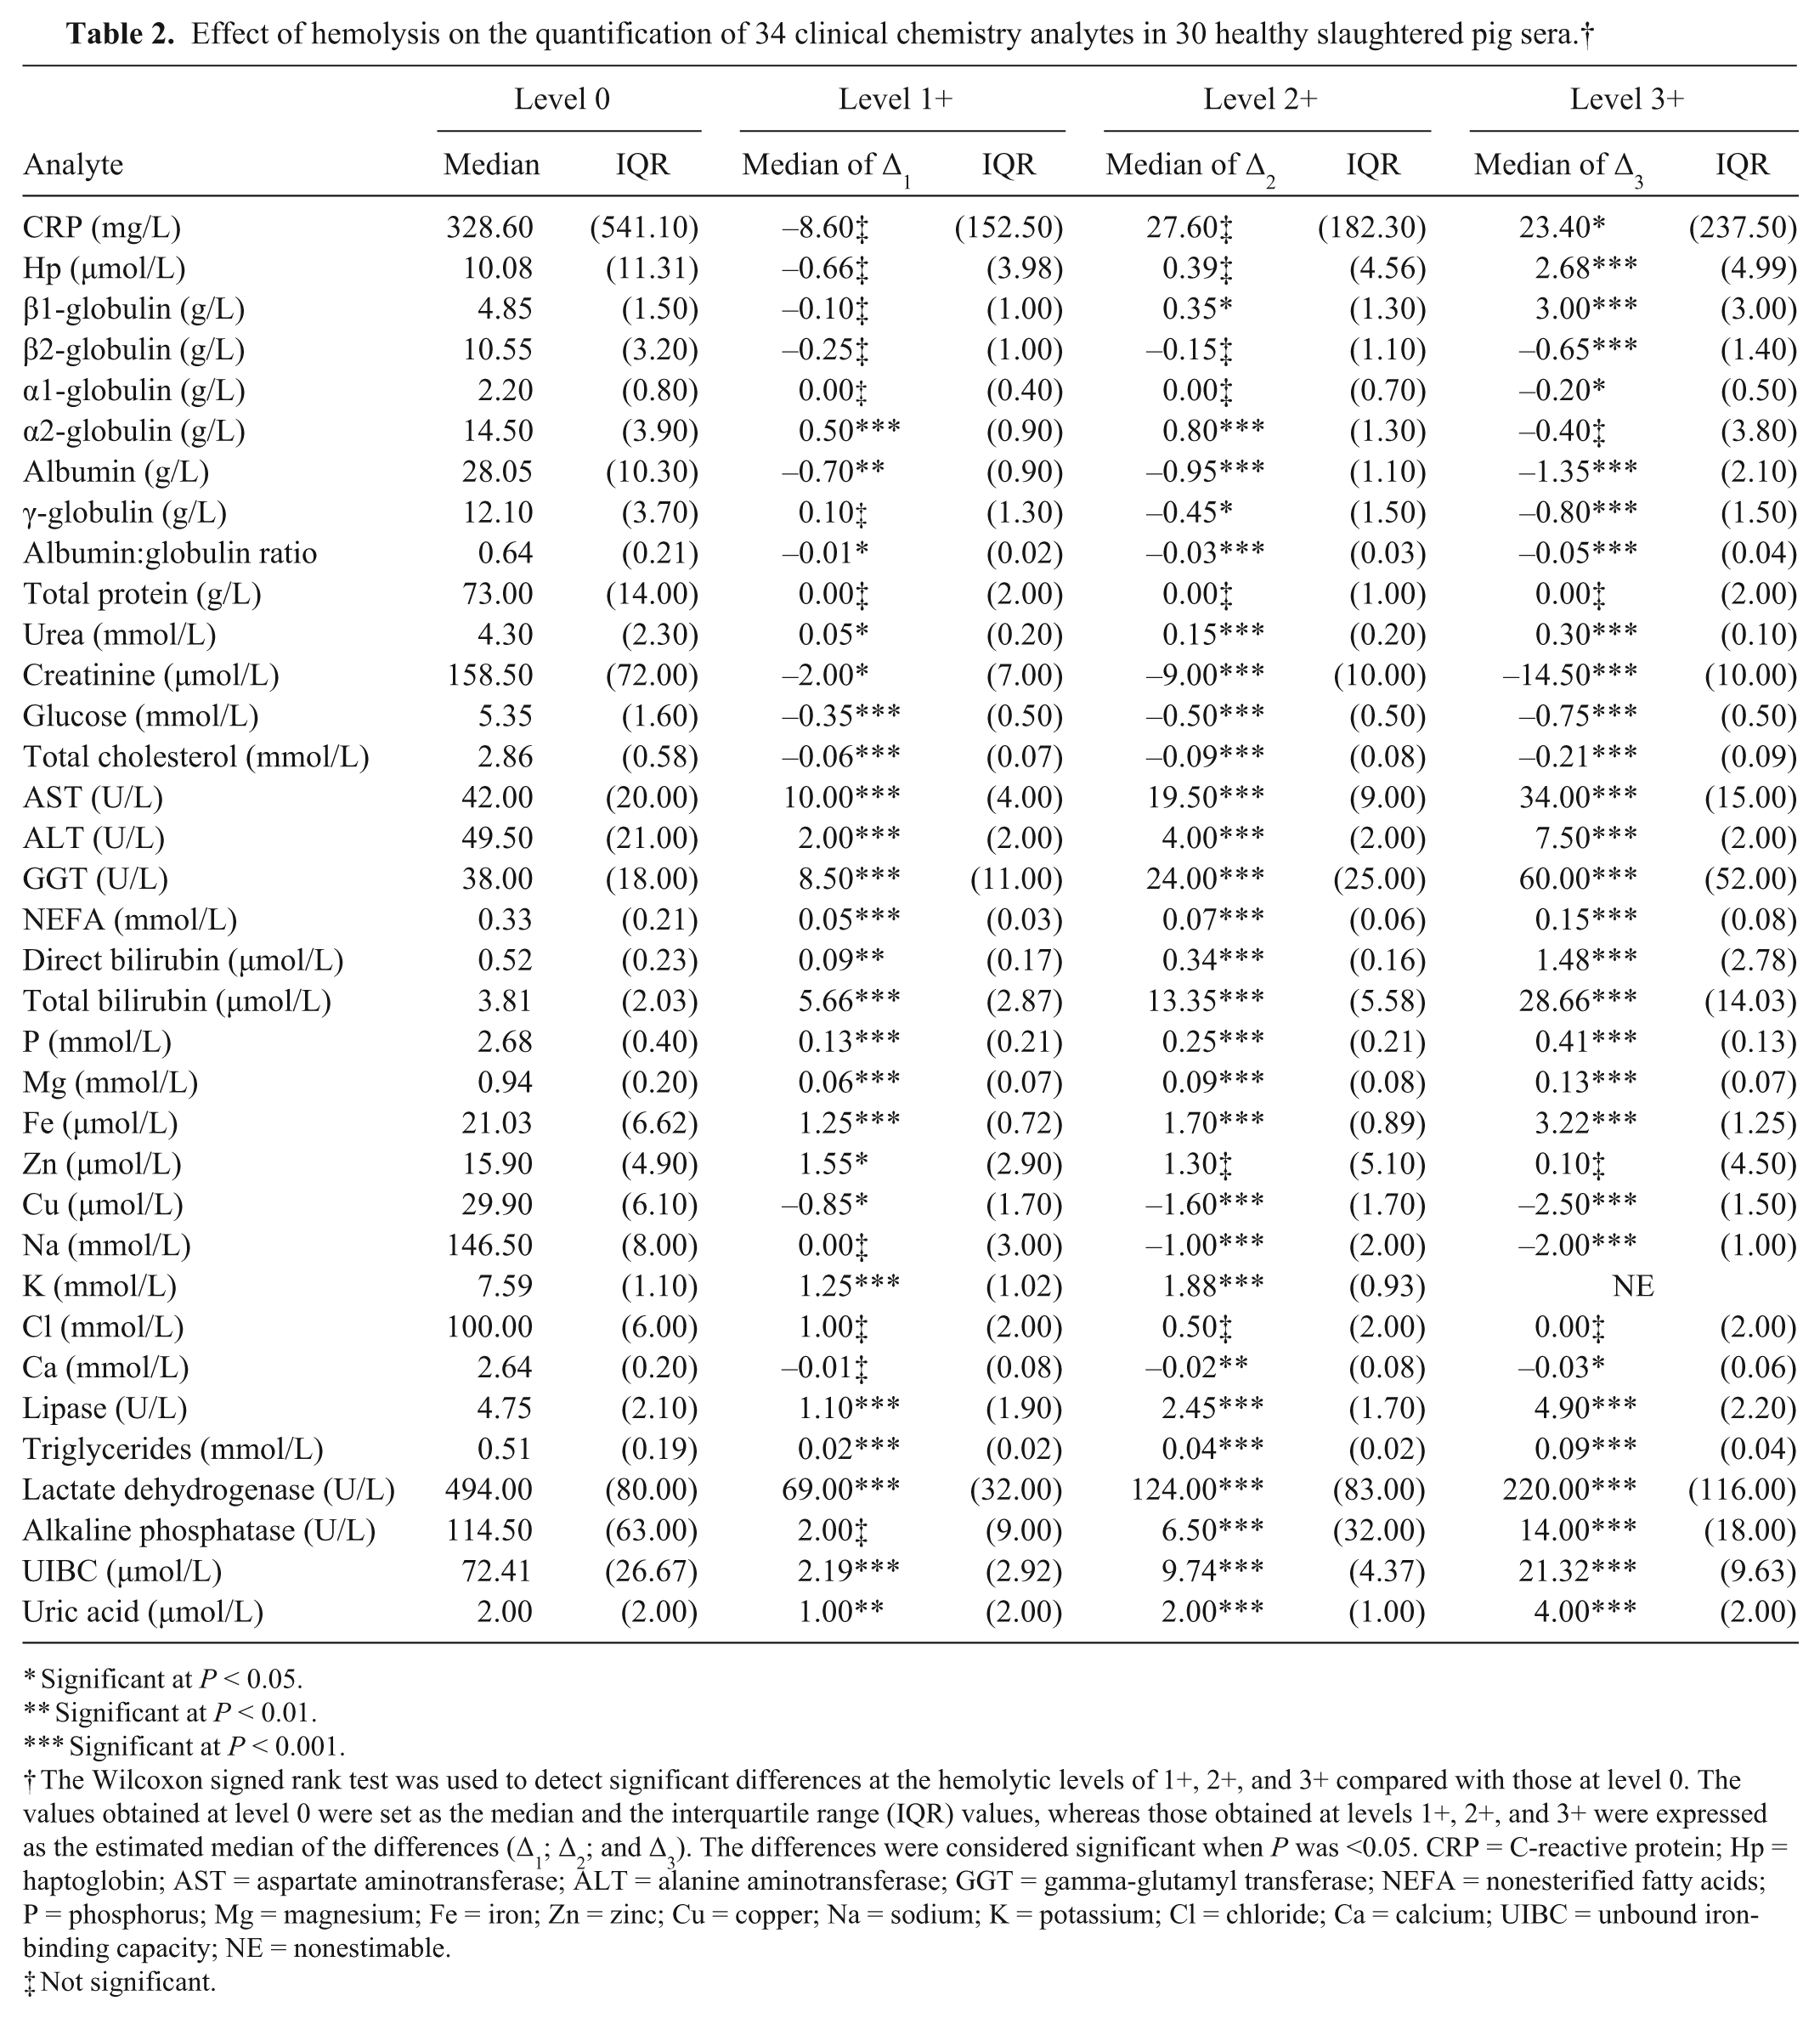
Significant at P < 0.05.
Significant at P < 0.01.
Significant at P < 0.001.
The Wilcoxon signed rank test was used to detect significant differences at the hemolytic levels of 1+, 2+, and 3+ compared with those at level 0. The values obtained at level 0 were set as the median and the interquartile range (IQR) values, whereas those obtained at levels 1+, 2+, and 3+ were expressed as the estimated median of the differences (Δ1; Δ2; and Δ3). The differences were considered significant when P was <0.05. CRP = C-reactive protein; Hp = haptoglobin; AST = aspartate aminotransferase; ALT = alanine aminotransferase; GGT = gamma-glutamyl transferase; NEFA = nonesterified fatty acids; P = phosphorus; Mg = magnesium; Fe = iron; Zn = zinc; Cu = copper; Na = sodium; K = potassium; Cl = chloride; Ca = calcium; UIBC = unbound iron-binding capacity; NE = nonestimable.
Not significant.
Discussion
The first important outcome of this study is the substantiation of earlier evidence showing that swine erythrocytes are extremely fragile, as attested by the remarkable number of hemolyzed samples that had to be excluded from this study immediately after collection (6/36; 16.7%) due to the presence of hemolysis at the level of 1+. In human studies, spurious hemolysis is frequently observed when samples are collected from catheters, 8 due to the remarkable difference in pressure between the cannula and the evacuated blood containment tubes, regardless of the specific composition of the cannula. 18 In our study, hemolysis could not be attributed to an obvious effect of venipuncture, so the most reasonable explanation includes the turbulent outflow from the jugular incision 18 or stress related to the transport and slaughtering of the animals. 1
The second important finding of this investigation is that visual assessment may be reliably used to score the degree of hemolysis in swine serum samples, which establishes a practical method for evaluating sample quality in settings where automated assessment of the hemolytic index is unpractical or unfeasible. The visual score exhibited optimal performance in differentiating nonhemolyzed from slightly hemolyzed samples and in distinguishing slightly hemolyzed from mildly hemolyzed samples. A weaker performance was observed in differentiating mildly and distinctly hemolyzed samples. Nevertheless, this feature should be regarded as a minor practical drawback because the values for the vast majority of the tested parameters (27/34; 80%) were already biased in the presence of a visual degree of hemolysis of 2+. These results substantially agree with those previously published in human medicine. 9
As predicted from the evidence gathered in studies of human blood, 6 the biasing of laboratory tests due to hemolysis was heterogeneous and mainly depended on the relative degree of hemolysis and the type of parameter tested. A complete description of the hemolysis-based biasing of the results for different analytes compared with that observed in previous studies in pigs,2,15 dogs, 12 and humans3,5,6,11,19 is shown in Table 3. The CRP and Hp contents were significantly overestimated only in the presence of a high level of hemolysis (3+; i.e., 133.4 μmol/L or 215 mg/dL), and this finding is consistent with previous data showing that the interference of hemolysis was limited in immunoassays compared to photometric and electrophoretic assays. 17 Accordingly, the electrophoretic assays of α2-globulins were significantly affected starting at a very low degree of hemolysis (i.e., 1+; 31.6 μmol/L or 51 mg/dL). The albumin content was substantially underestimated in hemolyzed specimens, exhibiting a negative correlation with the level of hemolysis. This finding appears to differ from those of human studies, which reported a minor biasing of this parameter in the presence of cell-free hemoglobin. 11
Effects of in vitro hemolysis on the quantification of several hematological analytes in the serum of healthy slaughtered heavy pigs and possible explanations drawn from previous studies in humans.*
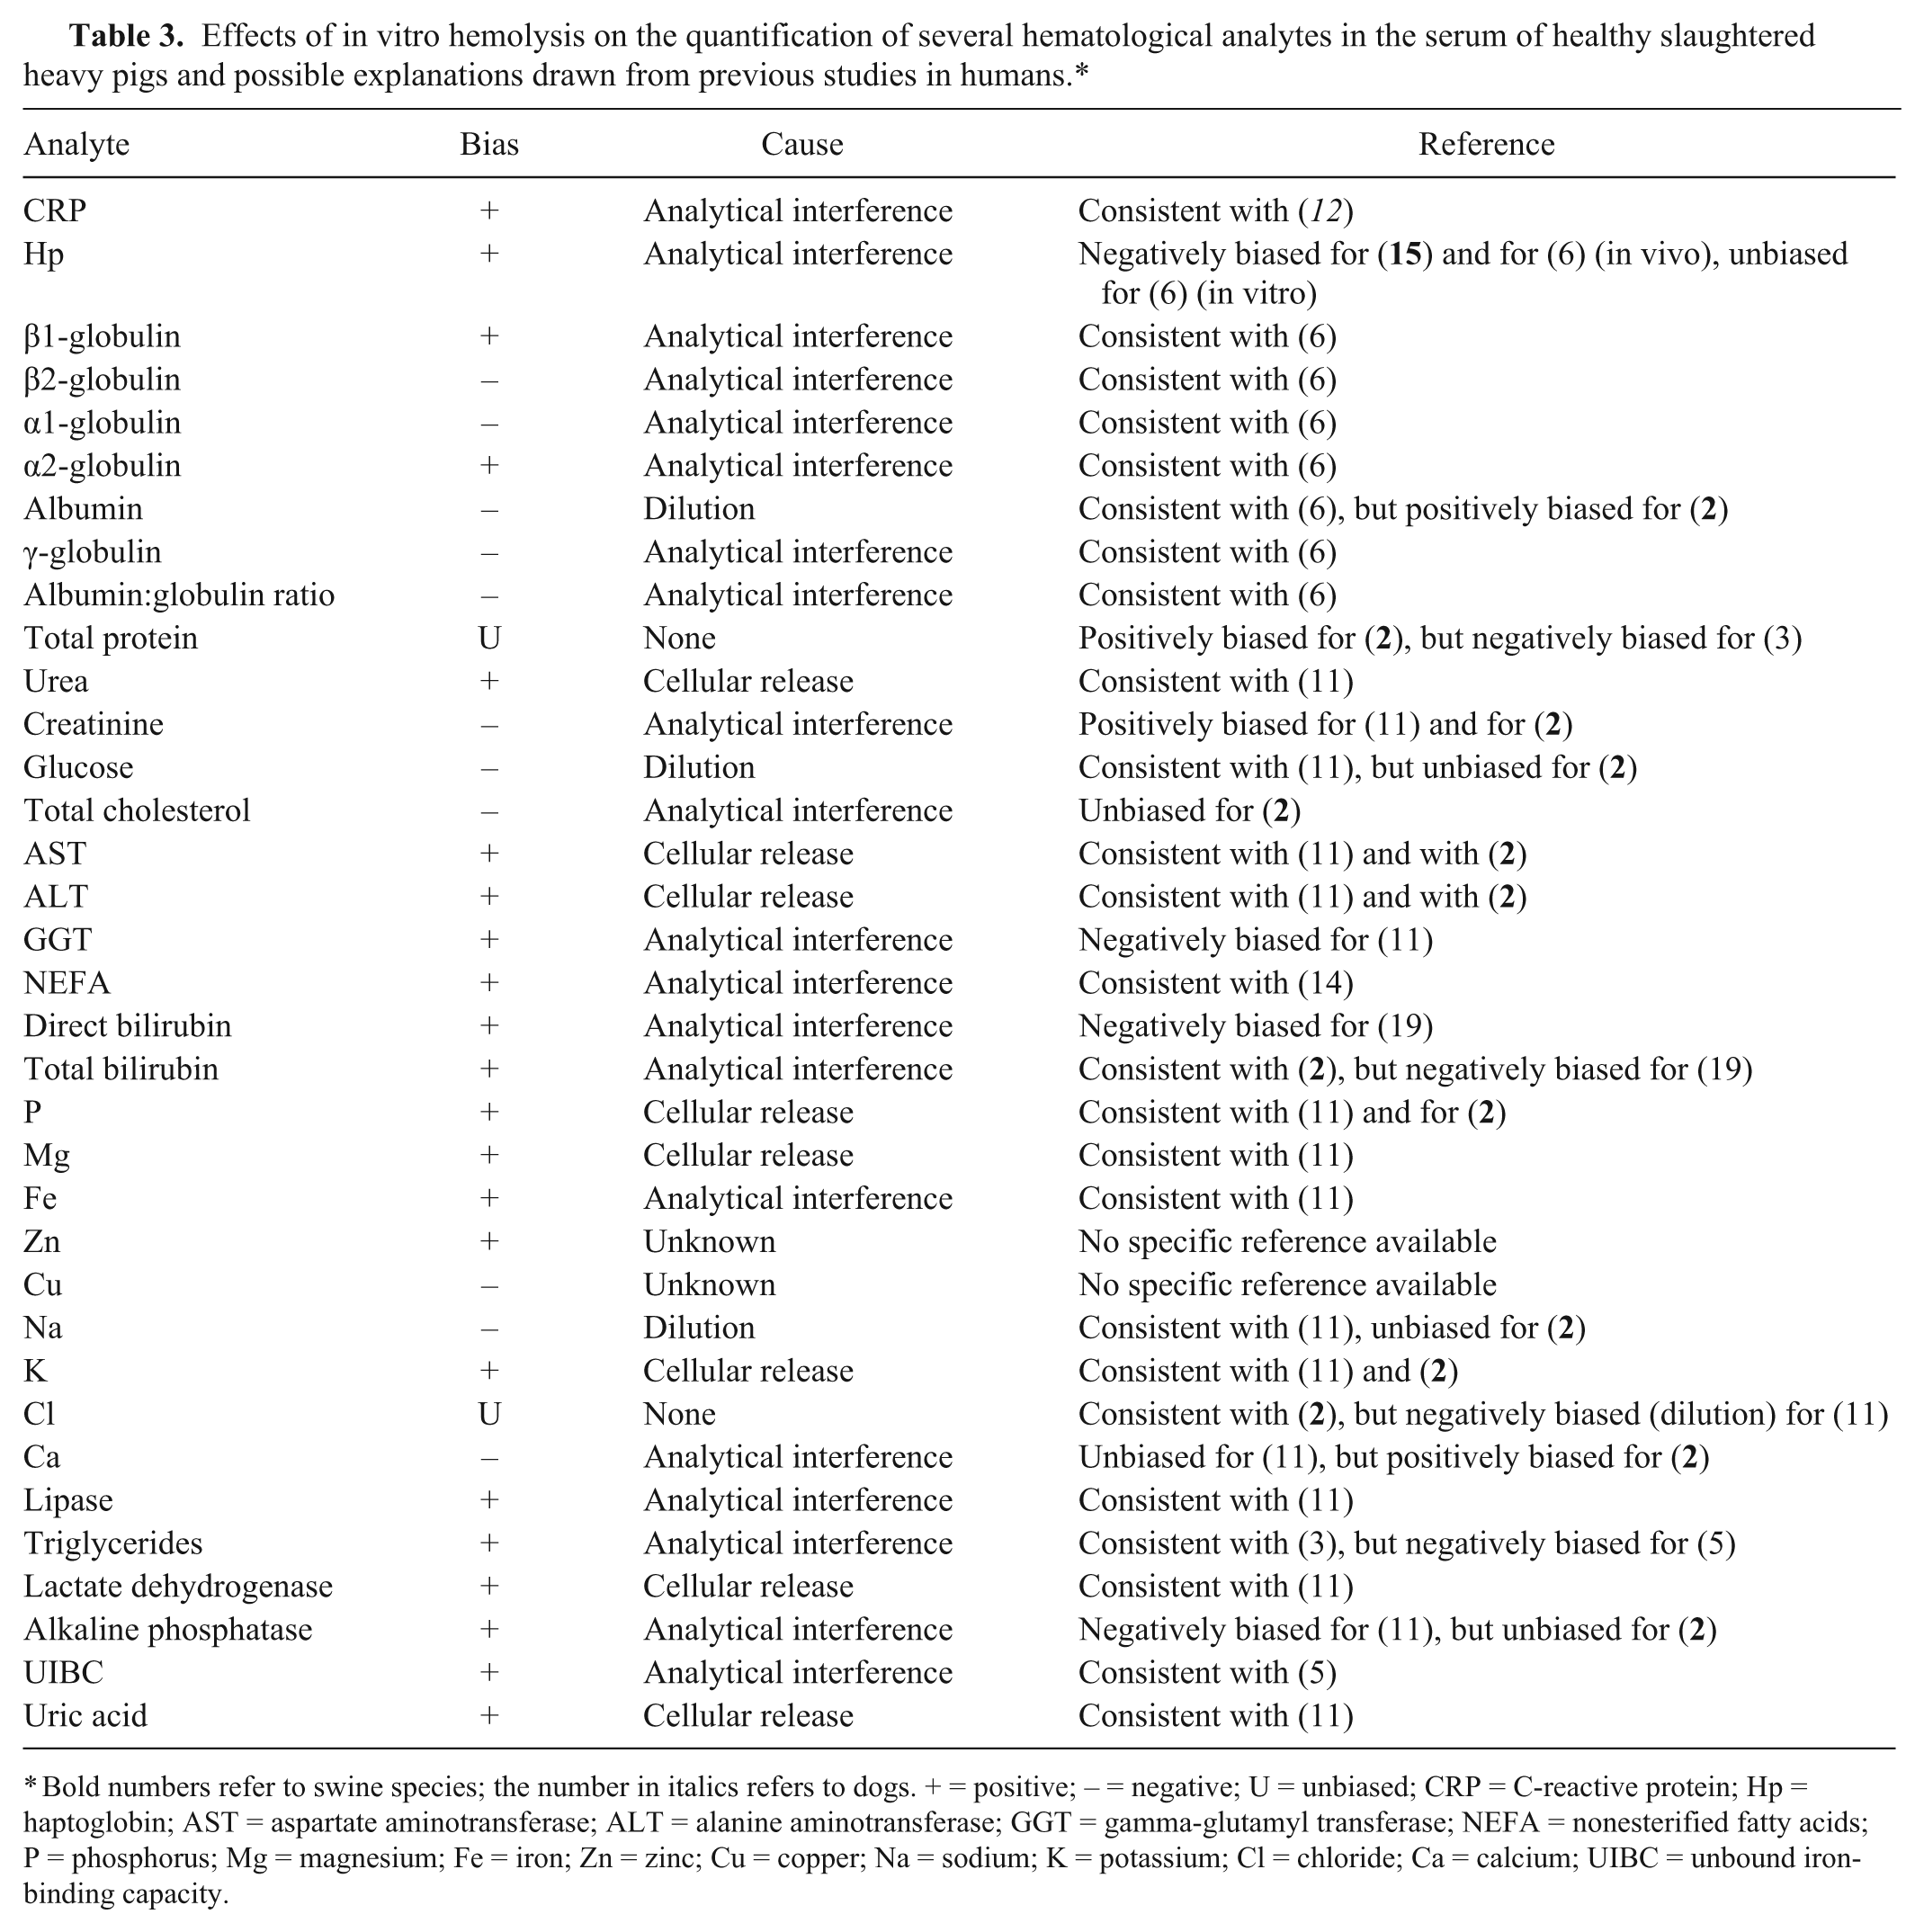
Bold numbers refer to swine species; the number in italics refers to dogs. + = positive; – = negative; U = unbiased; CRP = C-reactive protein; Hp = haptoglobin; AST = aspartate aminotransferase; ALT = alanine aminotransferase; GGT = gamma-glutamyl transferase; NEFA = nonesterified fatty acids; P = phosphorus; Mg = magnesium; Fe = iron; Zn = zinc; Cu = copper; Na = sodium; K = potassium; Cl = chloride; Ca = calcium; UIBC = unbound iron-binding capacity.
The peculiar trend of the α2-globulins and zinc values, in which the interference of hemolysis appeared to be significant only in the presence of low levels of hemolysis, is in agreement with the previously observed nonlinear correlation between the content of cell-free hemoglobin and these parameters, thus confirming the challenge of determining objective coefficients for correcting test results for the degree of hemolysis.6,11 The hemolysis-based biasing of the protein fraction values might be explained by the presence of diffuse bands that ultimately hinder the separation of different analytes. As previously described, 20 Hp-hemoglobin complexes move between the α2- and β-globulin fractions, while free hemoglobin migrates as a diffuse band in the β-globulin fraction. This occurrence might contribute to a significant interference in α2-globulin determination at the 1+ and 2+ visual levels of hemolysis and a significant interference in β1-globulin and β2-globulin determination at the 3+ visual level of hemolysis.
Limited information is currently available concerning hemolysis-based interference in laboratory testing of swine samples. Regarding previously published data, one study 15 compared 30 hemolyzed and nonhemolyzed samples (in vivo, without grading the level of hemolysis) and reported a negative correlation between the Hp values and hemolysis (P = 0.0001). In contrast, an increase in the Hp value was observed in hemolyzed samples in the present study, which was significant only in the presence of a very high degree of hemolysis (i.e., 3+; 215 mg/dL of cell-free hemoglobin). Previously reported data for humans 6 confirm that Hp quantification is negatively biased by in vivo hemolysis, but indicate that the Hp level is not influenced by spurious hemolysis. In fact, in vitro Hp-hemoglobin complexes that form on the destruction of erythrocytes cannot be rapidly cleared from the circulation by monocytes and tissue macrophages, as would occur in vivo. 6
Taken together, the results of our study indicate that hemolysis is an important source of bias in biochemical analyses of swine blood samples. The nonlinear biasing of values for the various parameters tested appears to be multifactorial. In the case of certain analytes, we were also able to identify reliable thresholds of interference that might be used in deciding whether a swine sample is suitable for testing. Based on the current study, the value of CRP, Hp, β1-globulin, β2-globulin, α1-globulin, γ-globulin, sodium, calcium, and alkaline phosphatase are not significantly biased in mildly hemolyzed specimens (1+; 31.6 μmol/L or 51 mg/dL), whereas α2-globulin, albumin, urea, creatinine, glucose, total cholesterol, aspartate aminotransferase, alanine aminotransferase, gamma-glutamyl transferase, nonesterified fatty acids, bilirubin, phosphorus, potassium, magnesium, iron, zinc, copper, lipase, triglycerides, lactate dehydrogenase, unbound iron-binding capacity, and uric acid values can be considered biased. Chloride and total protein can be considered unbiased even in markedly hemolyzed samples.
Footnotes
Acknowledgements
We are grateful to Dr. Fiorenzo Signor (Ulss 3 of Bassano) for his support of the activities at the abattoir.
a.
Vacutest Kima Srl, Arzergrande, Padua, Italy.
b.
Phase haptoglobin, Tridelta Development Ltd., Maynooth, County Kildare, Ireland.
c.
Phase porcine CRP, Tridelta Development Ltd., Maynooth, County Kildare, Ireland.
d.
Hydrasys LC, Sebia, Evry Cedex, France.
e.
Hydragel 30 Protein, Sebia, Evry Cedex, France.
f.
Cobas C 501 System, Roche Diagnostics GmbH, Mannheim, Germany.
g.
NEFA, Randox Laboratories Ltd., Crumlin, United Kingdom.
h.
SAS version 9.1, SAS Institute, Cary, NC.
Declaration of conflicting interests
The author(s) declare no conflicts of interest with respect to the research, authorship, and/or publication of this article.
Funding
The author(s) disclosed receipt of the following financial support for the research, authorship, and/or publication of this article: The Regione del Veneto “Direzione Prevenzione U.C. Sanità Animale e Igiene Alimentare” (DGRV 3594/10) and the Italian Ministry of Health (RC IZSVe 10/13).