
Abstract
Infectious bronchitis virus (IBV; Avian coronavirus) causes acute respiratory and reproductive and urogenital diseases in chickens. Following sequence alignment of IBV strains, a combination of selective primer sets was designed to individually amplify the IBV wild-type and vaccine strains using a multiplex amplification refractory mutation system reverse transcription polymerase chain reaction (ARMS RT-PCR) approach. This system was shown to discriminate the IBV wild-type and vaccine strains. Moreover, an ARMS real-time RT-PCR (ARMS qRT-PCR) was combined with a high-resolution analysis (HRMA) to establish a melt curve analysis program. The specificity of the ARMS RT-PCR and the ARMS qRT-PCR was verified using unrelated avian viruses. Different melting temperatures and distinct normalized and shifted melting curve patterns for the IBV Mass, IBV H120, IBV TW-I, and IBV TW-II strains were detected. The new assays were used on samples of lung and trachea as well as virus from allantoic fluid and cell culture. In addition to being able to detect the presence of IBV vaccine and wild-type strains by ARMS RT-PCR, the IBV Mass, IBV H120, IBV TW-I, and IBV TW-II strains were distinguished using ARMS qRT-PCR by their melting temperatures and by HRMA. These approaches have acceptable sensitivities and specificities and therefore should be able to serve as options when carrying out differential diagnosis of IBV in Taiwan and China.
Introduction
Infectious bronchitis virus (IBV; Avian coronavirus) is a positive-sense, single-stranded RNA virus that belongs to the Coronaviridae family, is distributed worldwide, and causes significant losses to the poultry industry. 18 The virus is highly contagious and causes acute respiratory, reproductive, and urogenital symptoms. 13 Vaccinated poultry may still be infected by serologically distinct strains of IBV. 29
The genome of this enveloped virus consists of approximately 27,000 base pairs (bp), and encodes 4 structural proteins, namely the spike protein (S), the membrane protein (M), which is associated with virus assembly and budding, the nucleocapsid protein (N), which packages the viral genome, and the envelope protein (E).2,27 The S protein is located at the exterior surface of the envelope of IBV and is cleaved into S1 and S2 subunits during maturation. 1 Because the epitopes eliciting neutralizing antibodies are widely distributed within the S protein sequence, as little as 2% variation in amino acid sequence, either by mutation or recombination, can lead to a new IBV serotype.3,16 Importantly, 2 exclusively Taiwan groups of IBV, Taiwan group I (TW-I) and Taiwan group II (TW-II), have been shown to co-circulate with the vaccine strains in the field. 19 It is thought that the IBV TW-II strain has been introduced into China through the legal and/or illegal trading of chickens as well as spread via wild birds.3,19 An IBV infection generally lasts for 3–10 days, thus an effective and rapid typing of IBV outbreaks, even in vaccinated flocks, is beneficial and will help with the conducting of the proper procedures needed to control the spread of the disease.3,26
Although serotyping of IBV can be achieved by hemagglutination inhibition, virus neutralization, and enzyme-linked immunosorbent assays, nucleic acid–based methods remain feasible options because of their advantages of reliability and rapidity. 20 As a possible alternative to restriction enzyme digestion, hybridization, or nucleotide sequencing, reverse transcription polymerase chain reaction (RT-PCR) has been developed to detect IBV. When the RT-PCR target was within the conserved parts of the M, N, and S1 genes, RT-PCR could be used for the group detection of IBV.5,18 In terms of genotyping, most efforts have been concentrated on IBV genes within regions that differentiate between the wild-type and vaccine strains. This approach usually involves designing primers based on the unique characteristics of wild-type and vaccine strains used in each geographic region. For example, in Australia, a deletion of the 3′-untranslated region (3′-UTR) of the IBV gene that is only present in the Australian IBV vaccine strain and not in field isolates is used to discriminate the IBV vaccine and wild-type strains using RT-PCR. 20 However, the divergent regions between the IBV TW-I, IBV TW-II, IBV Mass, and IBV H120 strains stretch from nucleotide positions 168 to 207 and 351 to 369 of the S1 gene, rather than involve the 3′-UTR region. 24 A multiplex RT-PCR was developed that uses a combination of specific primers targeting the S1 gene, and this system has been found to be useful for the effective differential diagnosis of IBV in Taiwan. 3
Since 2008, RT-PCR combined with the high-resolution melting (HRM) analysis (HRMA) has been used to detect several viruses, including Infectious bursal disease virus and Influenza A virus, and viruses within the genera Norovirus and Capripoxvirus.8,17,28 The melting temperature (Tm) and the patterns of the HRM curves that are generated by denaturation of the various amplicons along a temperature gradient can be used to discriminate genetic variations in virus strains. 6 Accordingly, a RT-PCR assay combined with HRMA has also been reported for the Australian IBV wild-type and vaccine strains based on the hypervariable region of 3′-UTR.9,10 This system was developed relatively easily because the difference between the Australian IBV wild-type and vaccine strains consists of a long nucleotide deletion. However, the discriminatory potential of the traditional PCR and HRMA may not be adequate for the IBV vaccine and wild-type strains in Taiwan because, in addition to a limited numbers of nucleotide polymorphisms, nucleotide deletions between the strains are far fewer. Interestingly, the limited numbers of nucleotide polymorphisms and nucleotide deletions similar to wild-type strains in Taiwan were also found in the wild-type IBV strains in Japan and China after multiple sequence alignments.19,21 Since 2010, a novel approach, multiplex amplification refractory mutation system polymerase chain reaction (ARMS PCR), which incorporates specific ending 3′-nucleotides in primers, has been used for the genotyping of wild-type and vaccine strains of virus.4,23 Therefore, the aim of the current study was to develop 2 systems, namely ARMS RT-PCR and ARMS real-time RT-PCR (ARMS qRT-PCR) combined with HRMA, for the detection and differential diagnosis of IBV. After an alignment of the IBV vaccine and wild-type strains that have been isolated since 1992 in Taiwan, Japan, and China, the most conserved sequences present in the IBV vaccine and wild-type strains were used to design primers. These approaches targeted both the main vaccine strains that are in use in Taiwan and China as well as the wild-type strains that are present in Taiwan and China.
Materials and methods
Viruses, vaccines, and preparation of viral RNA
The reference IBV Mass a and IBV H-120 b strains as well as field isolates of IBV TW-I and TW-II genotypes were provided from the avian disease laboratory of the Department of Veterinary Medicine, National Chung Hsing University (Taichung, Taiwan). The strains were confirmed by RT-PCR and sequencing analysis. 11 Tissue homogenates were prepared from trachea and kidney samples, and 0.3 ml of these homogenates was then used directly for extraction of viral RNA or inoculated into 10-day-old specific pathogen–free embryonated eggs. The IBV vaccines were cultured in chicken embryonic kidney cells as needed. Allantoic fluid from the inoculated eggs and samples of the infected cell lysate were collected after at least 48 hr and then stored at −80°C. Next, clarified tissue homogenate (200 μl), allantoic fluid, or cell lysate were mixed with an equal volume of TRIzol reagent, c and RNA was extracted according to the manufacturer’s instructions. The precipitated RNA was dissolved in diethylpyrocarbonate-treated (DEPC) double-distilled water (DDW). All background information on the various virus samples is presented in Table 1.
Details of the samples used (both field samples and culture fluid of commercial Infectious bronchitis virus [Avian coronavirus] vaccines) and the results of testing with a multiplex reverse transcription polymerase chain reaction (multiplex RT-PCR), a multiplex amplification refractory mutation system reverse transcription polymerase chain reaction (ARMS RT-PCR), and an ARMS real-time RT-PCR (ARMS qRT-PCR) combined with high-resolution melting analysis (HRMA) in Taiwan. The results of the mean melting temperature (Tm) ± standard deviation from the ARMS qRT-PCR combined with HRMA and by sequencing of the ARMS RT-PCR products are also presented.*

TW = Taiwan; NA = not available.
Samples provided by the Animal Health Research Institute.
No differentiation was made between the Infectious bronchitis virus Mass and H120 strains.
PCR primers used in current study
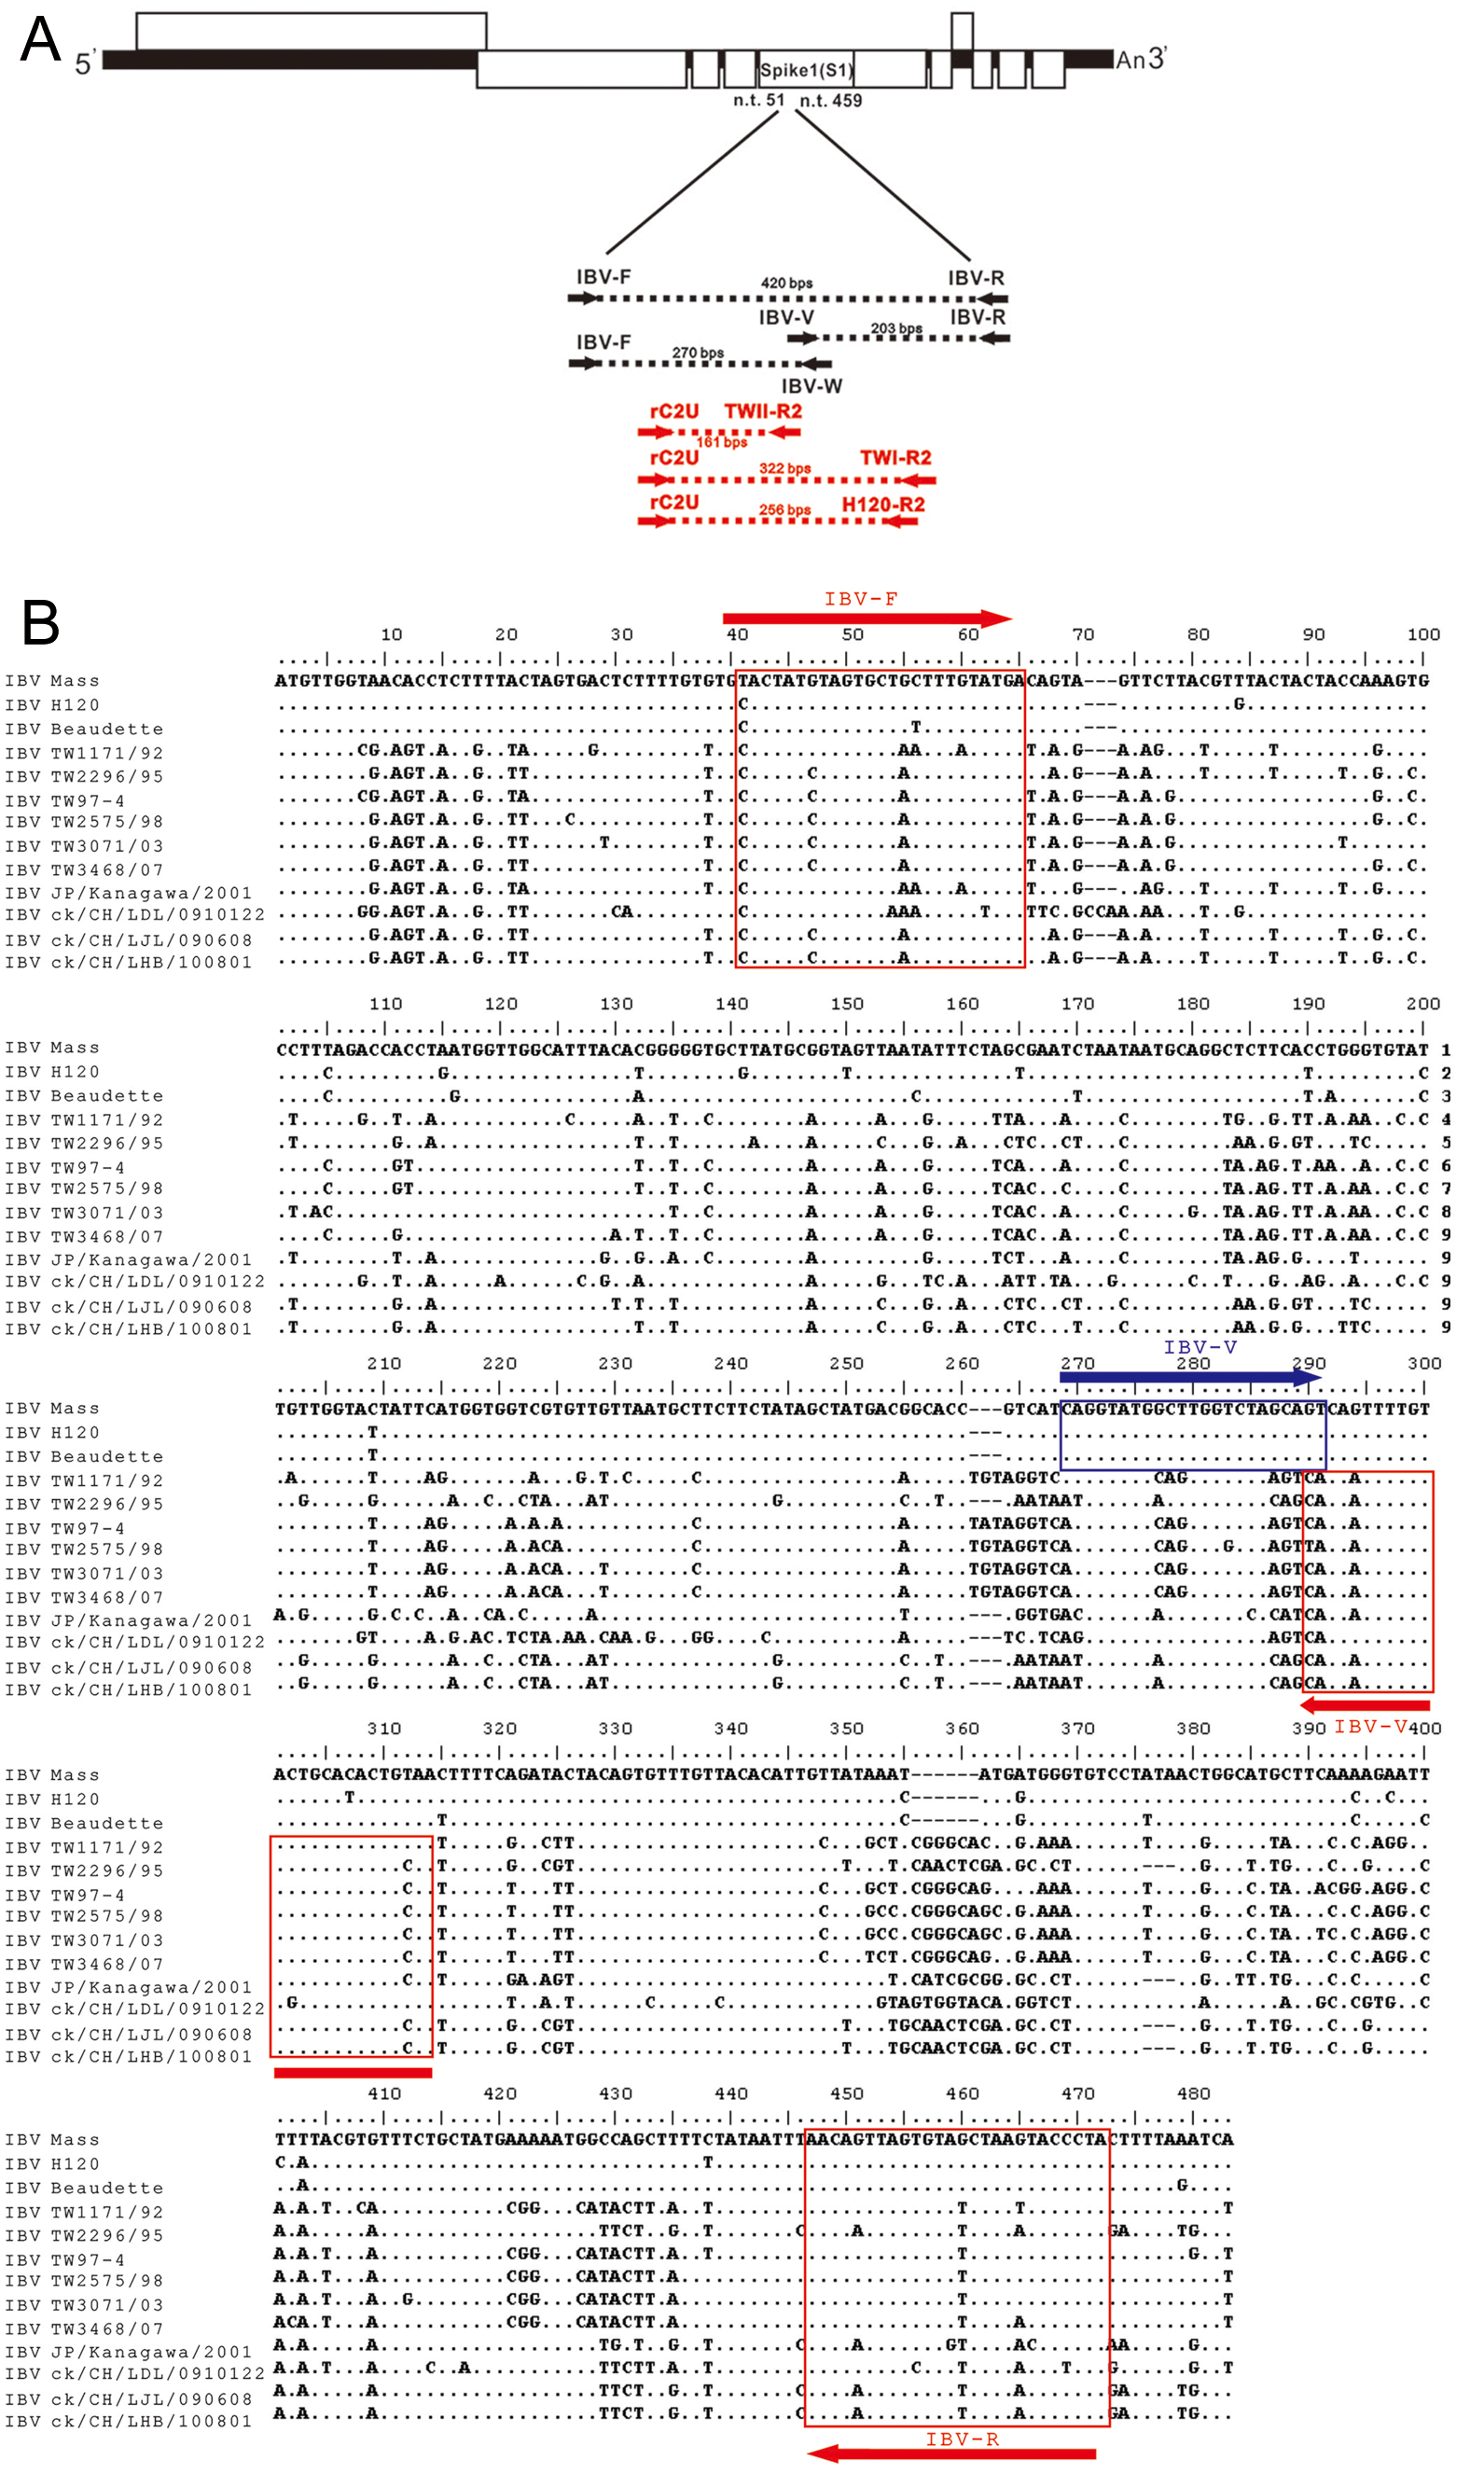
The rC2U, TWI-R2, TWII-R2, and TWH120-R2 primers targeting the S1 gene of IBV have been previously described. 3 The expected sizes of the amplified products for the IBV H120, TW-I, and TW-II strains are 256, 322, and 161 base pairs (bp), respectively. An alignment of the S1 genes of the IBV group was performed and used the following IBV strains: Mass (GenBank accession no. EU359657); H120 (EU822341); Beaudette (NC_001451); Taiwan group strains including TW1171/92 (DQ646406), TW 2296/95 (DQ646404), TW 97-4 (AY296742), TW 2575/98 (DQ646405), TW 3071/03 (AY606319), and TW 3468/07 (EU822336); JP/Kanagawa/2001 strain (from Japan; AB120650); and strains from China including ck/CH/LDL/0910122 (HM194640), ck/CH/LJL/090608 (HM194676), and ck/CH/LHB/100801 (JF330898). Based on this alignment, IBV-F and IBV-R primers were designed to act as the universal primers for all IBV strains while IBV-V and IBV-W primers were designed to target the IBV vaccine and wild-type strains, respectively. A schematic figure with the position of the primers and the size of amplified products is presented in Figure 1A. The sequence alignments of all IBV strains for these primers together with detailed information on the primers can be found in Figure 1B and Table 2, respectively.
Primers used in the current study for the detection of Infectious bronchitis virus (IBV) in Taiwan.
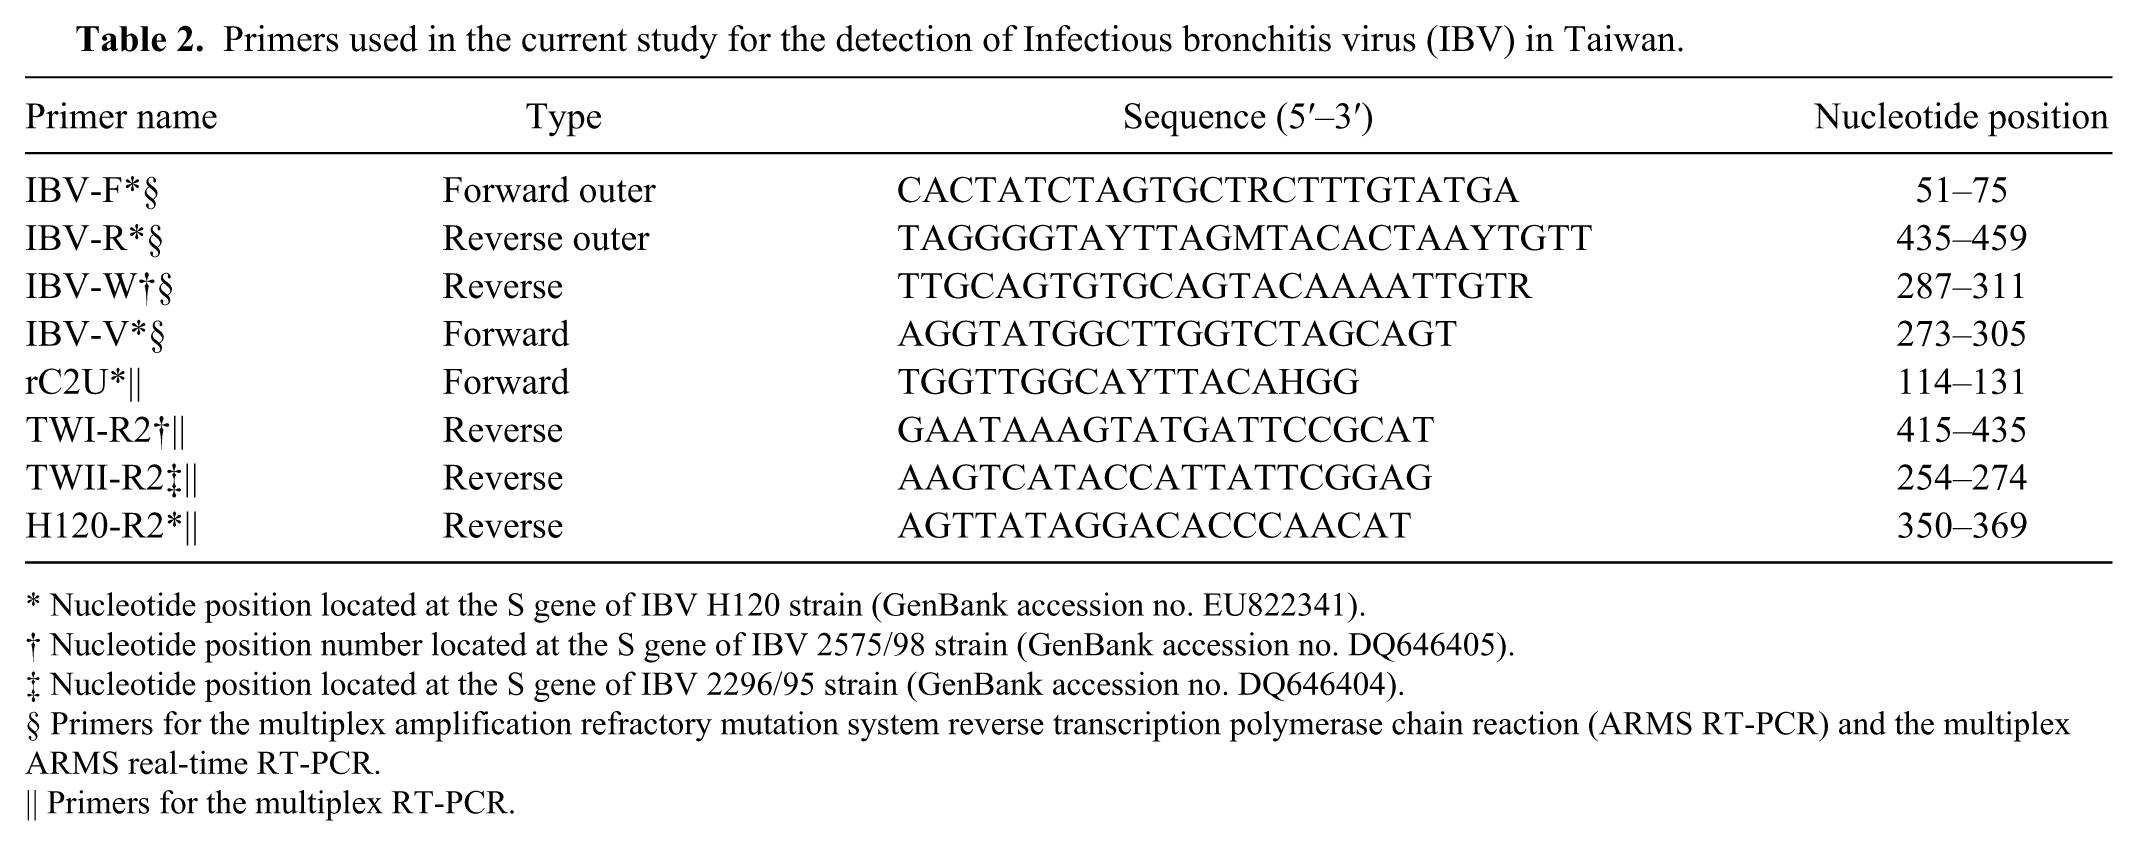
Nucleotide position located at the S gene of IBV H120 strain (GenBank accession no. EU822341).
Nucleotide position number located at the S gene of IBV 2575/98 strain (GenBank accession no. DQ646405).
Nucleotide position located at the S gene of IBV 2296/95 strain (GenBank accession no. DQ646404).
Primers for the multiplex amplification refractory mutation system reverse transcription polymerase chain reaction (ARMS RT-PCR) and the multiplex ARMS real-time RT-PCR.
Primers for the multiplex RT-PCR.
Multiplex RT-PCR, ARMS RT-PCR, and construction of IBV standard plasmid
For ARMS RT-PCR, the extracted RNA was mixed with 10 mM of random hexamer, heated to 65°C for 5 min, and then incubated on ice. The total reaction volume was 24 μl and consisted of 4 μl of 0.1 M dithiothreitol (DTT), 20 units of ribonuclease inhibitor, 8 μl of 5× first-strand synthesis buffer, 400 units of M-MLV reverse transcriptase, d and 8 μl of RNA extract. The reaction was incubated at 37°C for 50 min and then 70°C for 10 min. The total reaction volume for the ARMS RT-PCR was 25 μl and contained 1.5 mM MgCl2, 10 μM deoxyribonucleotide triphosphate (dNTP), 2.5 μl of 10× PCR buffer, 2.5 units of Taq polymerase, 4 μl of complementary (c)DNA, and either 1 of 4 different combinations of primer pairs. The 4 different primer combinations were IBV-F and IBV-R (each 0.4 μM), IBV-F and IBV-W (each 0.4 μM), IBV-V and IBV-R (each 0.4 μM), and IBV-F (0.4 μM), IBV-R (0.4 μM), IBV-W (0.2 μM), and IBV-V (0.2 μM). The PCR program consisted of 95°C for 5 min, followed by 32 cycles of 95°C for 30 sec, 53°C for 30 sec, and 72°C for 30 sec, as well as a final extension at 72°C for 10 min. For the multiplex RT-PCR, the total reaction volume of 25 μl consisted of 5 μl of the extracted RNA, 8 units of ribonuclease inhibitor, 0.5 μl of Taq polymerase, 5 μl of 5× buffer, 10 μM of each dNTP, 20 units of reverse transcriptase, d the rC2U primer (0.5 μM), the TWI-R2 primer (0.5 μM), the TWII-R2 primer (0.5 μM), and the H120-R2 primer (0.5 μM) as previously described. 2 The RT-PCR program consisted of 37°C for 50 min, 98°C for 30 sec, 35 cycles of 98°C for 30 sec, 58.4°C for 30 sec, and 72°C for 30 sec, as well as a final extension at 72°C for 10 min. The products of the PCR (4 μl) were analyzed by 2% agarose gel electrophoresis.
The PCR products amplified using the IBV-F and IBV-R primers were cloned into a commercial vector e followed by transformation into Escherichia coli cells. f Bidirectional sequencing analysis was performed on the positive clones. For the standard samples, pGEM-T–Easy-M, pGEM-T–Easy-H, pGEM-T–Easy-TW-I, and pGEM-T–Easy-TW-II, which respectively contain the partial S1 genes of IBV Mass, IBV H120, IBV TW-I, and IBV TW-II strains, were constructed and verified.
Preparation of IBV RNA by in vitro transcription
Initially, 2 μg of pGEM-T–Easy-M, pGEM-T–Easy-H, pGEM-T–Easy-TW-I, and pGEM-T–Easy-TW-II plasmids were individually linearized with the EcoRI enzyme. g Viral RNA was produced by a commercial kit h containing 10 mM DTT, 20 units of RNase inhibitor, 0.5 mM ribonucleotide triphosphates (NTPs), and 15 units of T7 RNA polymerase at 37°C for 1 hr. The RNA was extracted with water-saturated phenol and subsequently precipitated with isopropanol at −70°C for 18 hr after DNAse I i treatment at 37°C for 15 min. After removal of any remaining NTPs using a commercial reagent, j DEPC-treated DDW was used to dissolve the RNA. The RNA concentration was measured spectrophotometrically, and the copy number was calculated using the following equation: 1 optical density at 260 nm (OD260) = 40 μg/ml.
The sensitivity and specificity tests of ARMS RT-PCR and ARMS qRT-PCR
To measure sensitivity, the transcribed IBV for each IBV strain (Mass, H120, TW-I, and TW-II) including a dilution series of 5 × 10⁴, 5 × 10³, 5 × 10², 50, and 5 copies (per 0.5 ml) were tested by ARMS RT-PCR using a combination of the IBV-F and IBV-R primers, a combination of the IBV-F and IBV-W primers, a combination of the IBV-V and IBV-R primers, and a combination of the IBV-F, IBV-R, IBV-V, and IBV-W primers. The ARMS qRT-PCR was tested in a similar manner using the same dilution series of the transcribed RNA. To measure specificity, cDNA (5 × 10⁴ copies/strain) from a mixture of the IBV H120 vaccine strain, the IBV Mass vaccine strain, the IBV TW-I strain, and the IBV TW-II strain, Newcastle disease virus (NDV), avian Influenza A virus (AIV), Marek’s disease virus (MDV), Avian reovirus (ARV), Infectious bursal disease virus (IBDV, Avian encephalomalacia virus (AEV), and Avian poxvirus (APV) were examined by ARMS RT-PCR. For ARMS qRT-PCR, cDNA (5 × 10⁴ copies/strain) from a mixture of the IBV Mass vaccine and IBV TW-I strains, a mixture of the IBV H120 vaccine and IBV TW-II strains, IBV Mass vaccine strain, IBV H120 vaccine strain, IBV TW-I strain, IBV TW-II strain, NDV, AIV, MDV, ARV, IBDV, AEV, and APV were examined by ARMS qRT-PCR. For the ARMS RT-PCR and ARMS qRT-PCR testing, negative controls were included in each assay.
ARMS qRT-PCR coupled with HRMA
For ARMS qRT-PCR with HRMA, the PCR mixture consisted of 0.4 μM IBV-F, 0.4 μM IBV-R, 0.2 μM IBV-W, and 0.2 μM IBV-V primers, 12.5 μl of a PCR master mix with EvaGreen, k and 4 μl of cDNA product. The PCR program consisted of 95°C for 5 min, followed by 36 cycles of denaturation at 95°C for 10 sec, annealing at 50°C for 20 sec, and extension at 72°C for 20 sec. The high-resolution melting analysis was performed within 2 min from 65°C to 85°C with an increment of 0.05°C per sec after qRT-PCR. A HRM algorithm was produced using commercial software l in order to provide an analysis of the melting profiles. The Tm value for each strain was determined based on traditional melt curve analysis. A hundred and 0 points were arbitrarily set for the highest and lowest fluorescence values, respectively, to create a best-fit line for the normalization of the raw data. The normalization regions between 70°C and 82°C were analyzed. The IBV Mass, IBV H120, IBV TW-I, and IBV TW-II strains were included in each assay as standards to allow differential diagnosis. The mean Tm ± standard deviation (SD) value for each sample was calculated. In addition to the normalized melting curve, a shifted melting curve (difference graph) was generated by subtracting the melting curve amplified using the IBV TW-I strain from the curve of products amplified from all samples and all standard strains, including the IBV Mass, IBV H120, and IBV TW-II strains.
Detection of IBV from field samples
A total of 35 samples were either collected from chicken farms located in Taiwan (samples 1–27) or provided by the Taiwan Animal Health Research Institute (samples 28–32), and all available information on these samples is shown in Table 1. RNA was extracted from each sample and used in the ARMS RT-PCR for genotyping. In addition, the RNA was also used in the ARMS qRT-PCR genotyping assay (in triplicate) and the cDNA amplified from the RNA by the ARMS RT-PCR using a combination of the IBV-F and IBV-R primers was also subjected to sequence analysis. The mean Tm ± SD value for each sample was calculated.
Results
Sensitivity of ARMS RT-PCR and ARMS qRT-PCR for detection of IBV
When the transcribed RNA was amplified using the IBV-F and IBV-R primers, the size of the PCR product was the expected 420 bp and the detection limit was 5 copies of RNA (per 0.5 ml sample; Fig. 2A). The sizes of the PCR products amplified using the IBV-F and IBV-W primers and the IBV-V and IBV-R primers were the expected 270 and 203 bp, respectively, and all the detection limits were also 5 copies of RNA (per 0.5 ml of sample; Fig. 2B, 2C). When the transcribed IBV RNA was amplified with ARMS RT-PCR by using the IBV-F, IBV-R, IBV-V, and IBV-W primers, the sizes of the products were the expected 420, 270, and 203 bp, respectively, and the detection limit was also 5 copies of RNA (per 0.5 ml of sample; Fig. 2D).
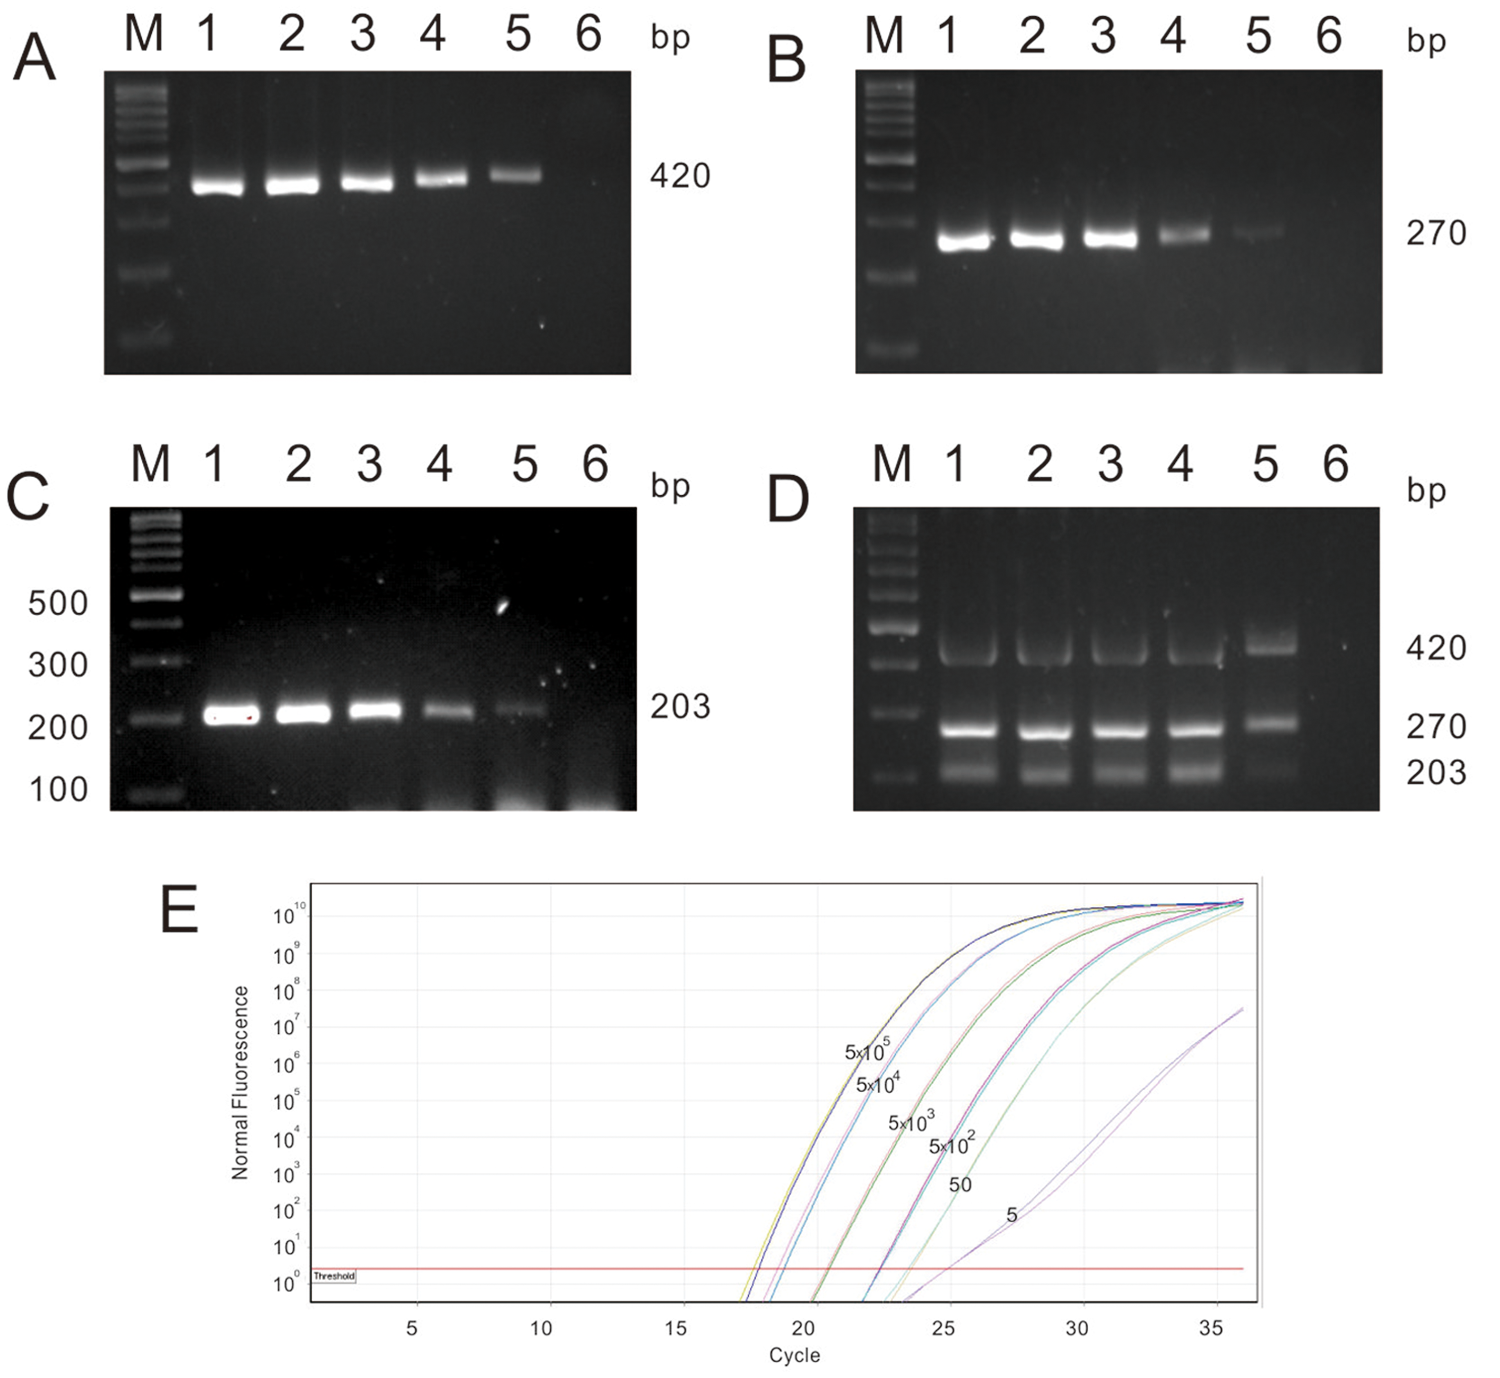
The sensitivity of multiplex amplification refractory mutation system reverse transcription polymerase chain reaction (ARMS RT-PCR) for the detection of Infectious bronchitis virus (IBV; Avian coronavirus). Lane M: DNA markers; lanes 1–5: a dilution series of 5 × 10⁴, 5 × 10³, 5 × 10², 50, and 5 copies of transcribed IBV RNA as templates, respectively; lane 6: negative control.
In the ARMS qRT-PCR, sigmoid curves, consisting of an exponential rise followed by a plateau, were obtained during the successful amplifications of positive samples. The average threshold cycle values of 20.17 ± 0.01, 21.19 ± 0.08, 22.63 ± 0.1, 23.68 ± 0.03, and 25.64 ± 0.28 were obtained from 5 × 10⁴, 5 × 10³, 5 × 10², 50, and 5 copies of a mixture of transcribed IBV Mass RNA, IBV H120 RNA, IBV TW-I RNA, and IBV TW-II RNA per 0.5 ml of sample, respectively. Based on the result of the average threshold cycle value for the negative control, the cutoff value was 26.13. These findings suggest that the sensitivity when detecting IBV RNA using ARMS qRT-PCR was 5 copies per 0.5 ml of sample (Fig. 2E). Taken together, the results demonstrated that the ARMS RT-PCR approach has the same sensitivity as the ARMS qRT-PCR assay.
Specificity of ARMS RT-PCR and ARMS qRT-PCR combined with HRMA for detection of IBV
Three fragments of 420, 270, and 203 bp were obtained by the amplification of a mixture of the IBV H120, IBV Mass, IBV TW-I, and IBV TW-II strains using ARMS RT-PCR. A mixture of different IBV strains was used to simulate the co-circulation of the IBV vaccine and wild-type strains in the field. The RNA from NDV, AIV, MDV, ARV, IBDV, AEV, and APV was not amplified (Fig. 3A).
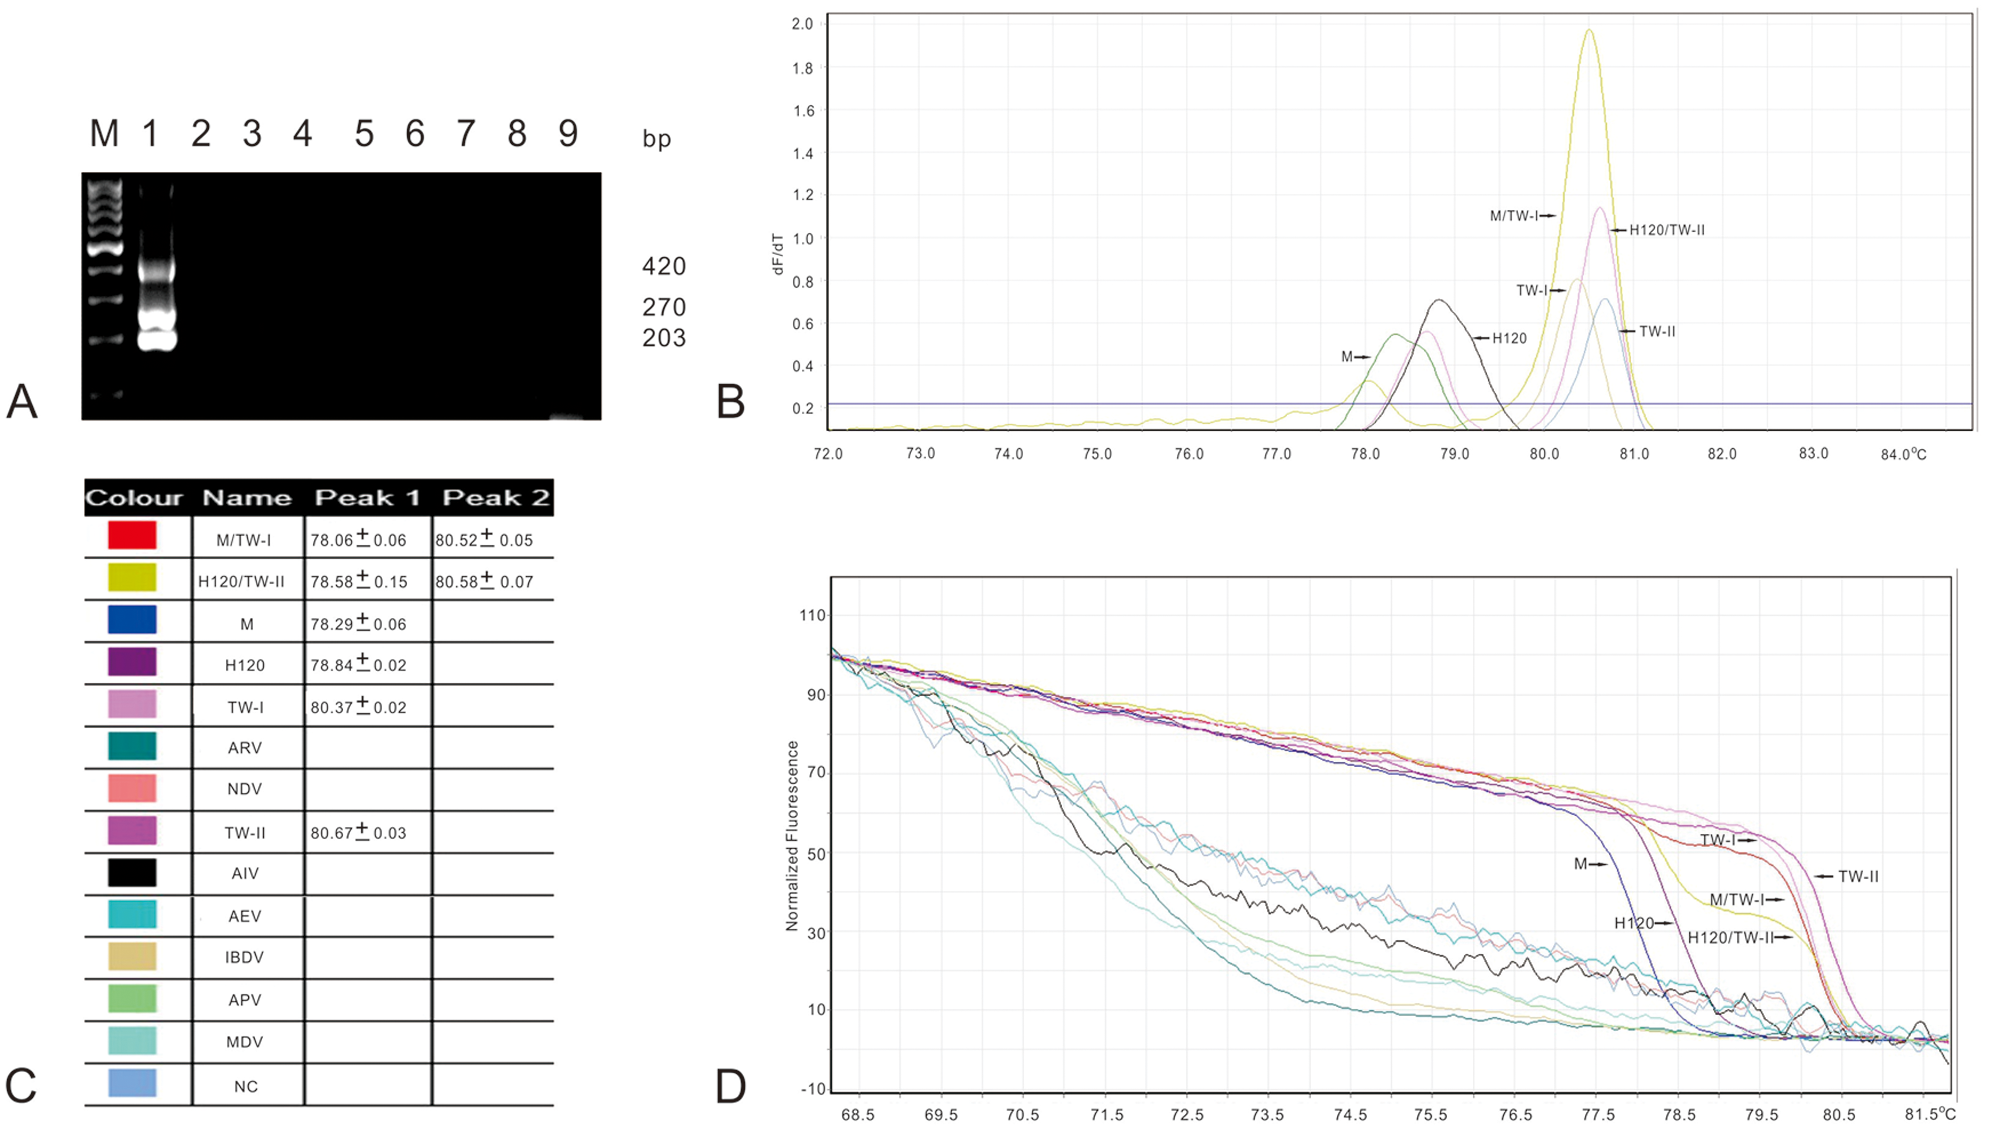
When the IBV strains including Mass, H120, TW-I, TW-II, a mixed sample of the Mass and TW-I strains, and a mixed sample of the H120 and TW-II strains were examined by using ARMS qRT-PCR, the productive amplifications were obtained and characterized as melting peaks. The mean Tm ± SD values from the triplicate samples for IBV Mass strain, IBV H120 strain, IBV TW-I strain, and IBV TW-II strain were 78.29 ± 0.06°C, 78.84 ± 0.02°C, 80.37 ± 0.02°C, and 80.67 ± 0.03°C, respectively. Both a mixed sample of the IBV Mass and IBV TW-I strains and a mixed sample of the IBV H120 and IBV TW-II strains had a dual Tm of 78.06 ± 0.06°C plus 80.52 ± 0.05°C and a double Tm of 78.58 ± 0.15°C plus 80.58 ± 0.07°C, respectively. Dual-peaked melting curves were observed for both the mixed sample of the IBV Mass and IBV TW-I strains and the mixed sample of the IBV H120 and IBV TW-II strains (Fig. 3B, 3C). These results indicate that there are distinct differences between the IBV vaccine and IBV wild-type strains. Fluorescent transition was not seen for NDV, AIV, MDV, ARV, IBDV, AEV, and APV when their HRMA results were analyzed. The specificity of this assay was verified owing to the melting peak and fluorescent conversion were not founded in the negative controls (Fig. 3D). When the IBV Mass, IBV H120, IBV TW-I, and IBV TW-II strains were used, different normalized and shifted melting curves were obtained. The relative positions of melting curves from left to right sides were the IBV Mass, IBV H120, IBV TW-I, and IBV TW-II strains. Distinct patterns of melting curves were seen, which crossed from left to right, when a mixed sample of the IBV Mass and IBV TW-I strains and a mixed sample of the IBV H120 and IBV TW-II strains were used (Fig. 3D).
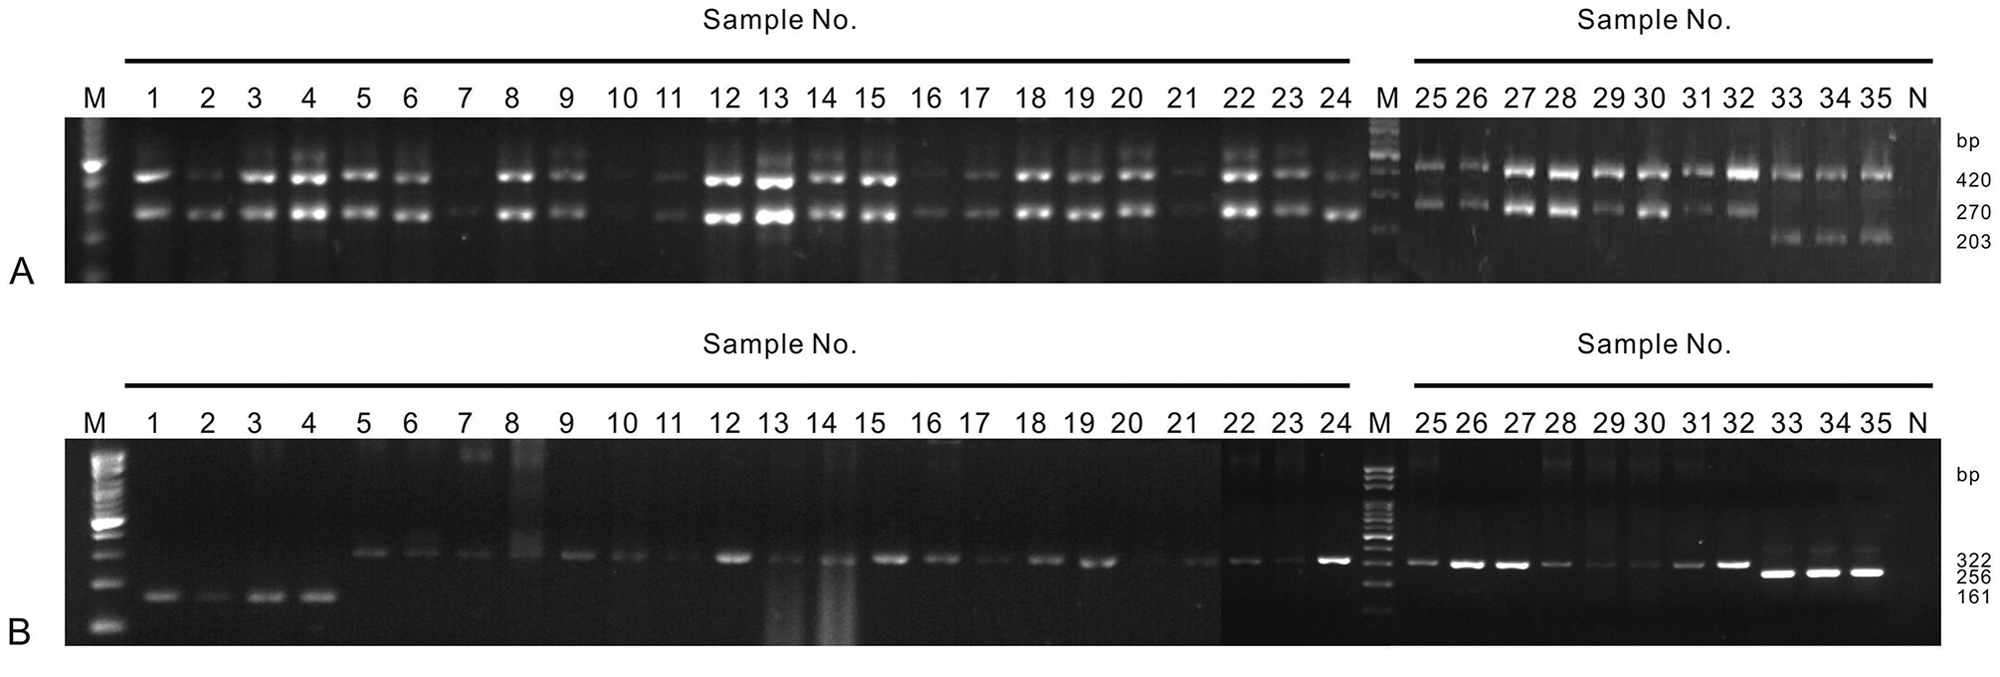
Comparison of results obtained using ARMS RT-PCR, ARMS qRT-PCR combined with HRMA, multiplex RT-PCR, and by sequencing
Among the 35 samples examined, all were positive for IBV by ARMS RT-PCR, ARMS qRT-PCR combined with HRMA, and multiplex RT-PCR. Three samples (samples 33–35) were genotyped as the IBV vaccine strains by ARMS RT-PCR and multiplex RT-PCR. For these 3 samples, the products were, as expected, 420 and 203 bp for the ARMS RT-PCR (Fig. 4A) and 256 bp for the multiplex RT-PCR (Fig. 4B). No differentiation between the IBV Mass and IBV H120 strains was possible using the multiplex RT-PCR. The remaining 32 samples (samples 1–32) were genotyped as the IBV wild-type strains by ARMS RT-PCR and the sizes were, as expected, 420 and 270 bp (Fig. 4A). Four samples (samples 1–4) and 28 samples (samples 5–32) were genotyped as the IBV TW-II and TW-I strains, respectively, by multiplex RT-PCR. The sizes for the IBV TW-II and TW-I strains were 161 and 322 bp, respectively, as expected (Fig. 4B).
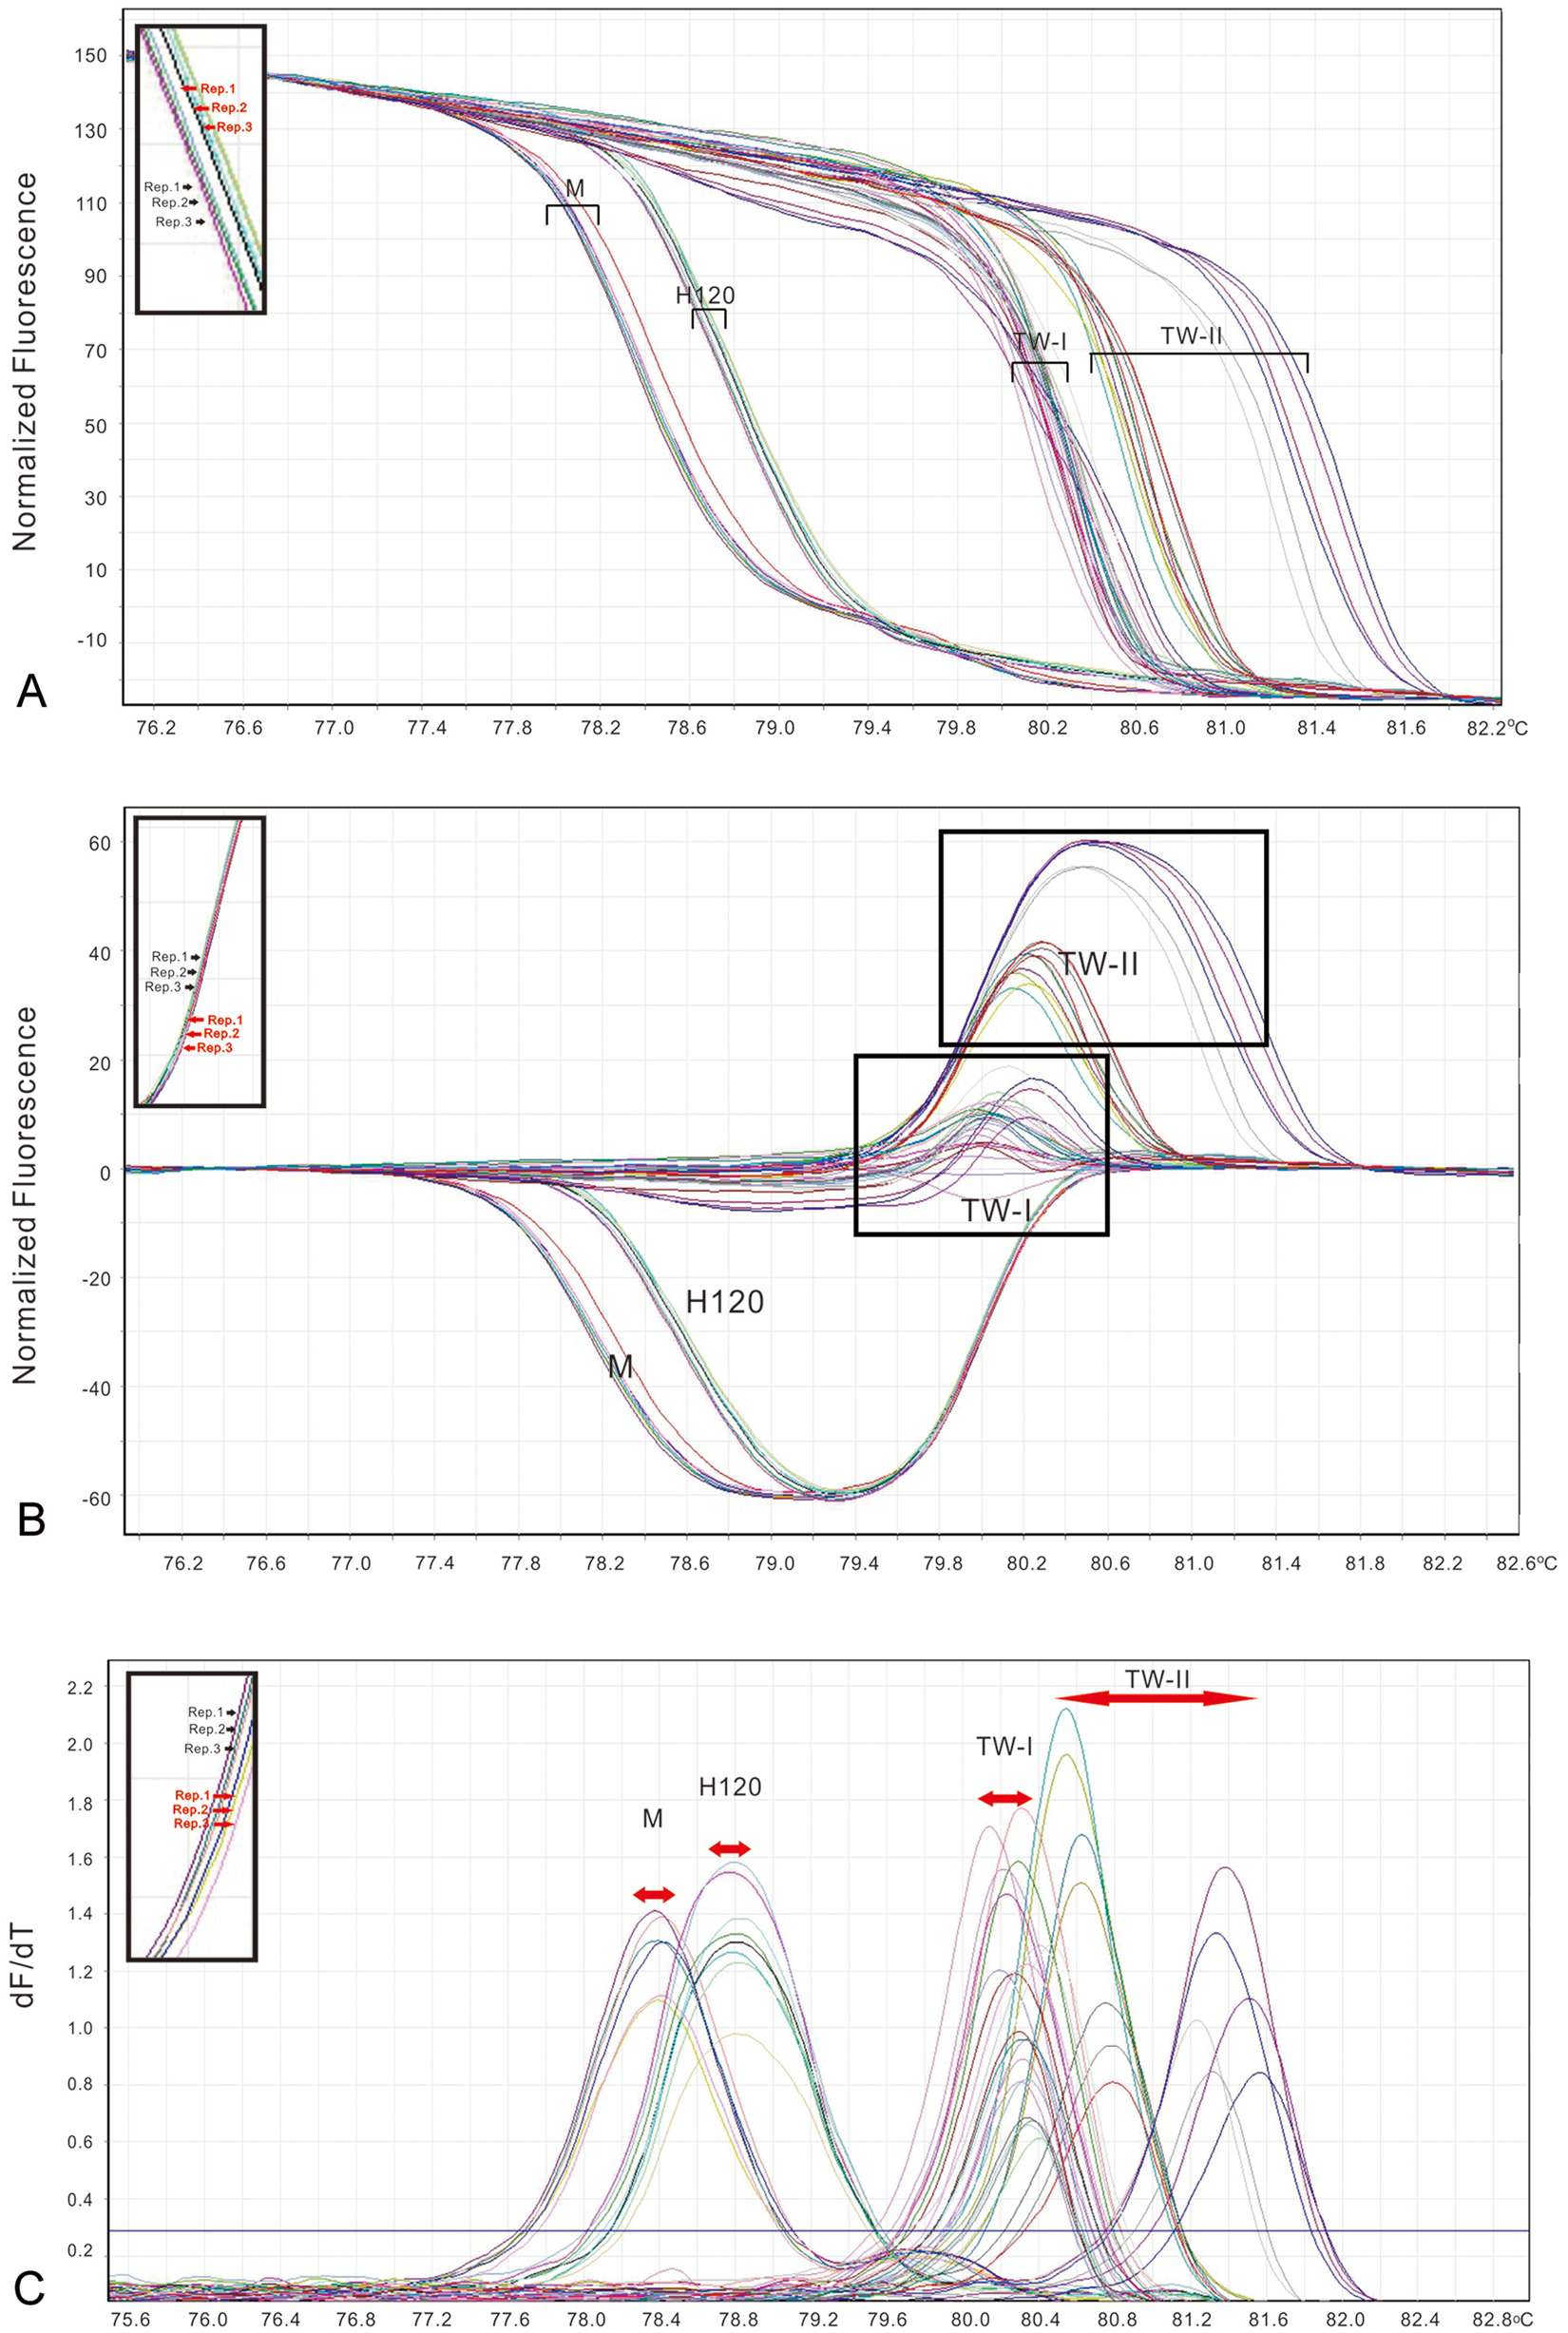
For the ARMS qRT-PCR, 4 genotypes, namely the IBV Mass, IBV H120, IBV TW-1, and IBV TW-II strains, were identified from left to right relative to each other based on the normalized curve approach (Fig. 5A). When all samples were plotted against the IBV TW-I strain to obtain an average plot, a classification into the 4 genotypes, namely the IBV Mass, IBV H120, IBV TW-I, and IBV TW-II strains, was obtained; furthermore, the shifted melting curves were able to separate these strains better (Fig. 5B). Based on the relative distributions and shapes of the HRM curves, sample 33, samples 34 and 35, samples 5–32, and samples 1–4 were genotypes as the IBV Mass, IBV H120, IBV TW-I, and IBV TW-II strains, respectively. These results are consistent with those obtained by sequence analysis. The Tm values of samples 1–4, samples 5–32, sample 33, and samples 34–35 were 80.79 ± 0.07–81.49 ± 0.06°C, 79.99 ± 0.05–80.46 ± 0.03°C, 78.36 ± 0.02°C, and 78.68 ± 0.04–78.8 ± 0.08°C, respectively, which suggested that the distinct range of Tm values for each IBV strain was observed (Fig. 5C). Therefore, the mean Tm values ± 3 SD of all samples for each IBV strain may serve as the defined ranges. Using this approach, the defined Tm values for the IBV Mass, IBV H120, IBV TW-I, and IBV TW-II strains were 78.33 ± 0.17°C, 78.75 ± 0.3°C, 80.27 ± 0.34°C, and 80.96 ± 1.08°C, respectively (Fig. 5C).
A representative result of samples detected by amplification refractory mutation system real-time reverse transcription polymerase chain reaction (ARMS qRT-PCR).
The results of genotyping the field samples by ARMS RT-PCR, multiplex RT-PCR, ARMS qRT-PCR combined with HRMA, and sequencing were in agreement (Table 2). Twenty-eight IBV TW-I samples were found and were identical; these samples were different from the 4 IBV TW-II samples, which were also identical to each other.
Discussion
Because there is no complete cross-protection against the IBV TW-I and TW-II strains when bird flocks are vaccinated with the IBV Mass vaccine and IBV H120 vaccine strains, 12 there is a co-circulation of both the wild-type and vaccine strains in Taiwan and China. This means there is a need to differentiate infected from vaccinated birds. A deleted region of the 3′-UTR of the N gene of IBV vaccine strain in Australia has been used as a practical option for this differentiation.9,10 This option is not useful in Taiwan because no such difference between the IBV vaccine strains and wild-type strains is found in Taiwan, as different vaccine strains of IBV are used. There are 2 hypervariable regions (HVRs) at nucleotide positions 168–207 and 351–369 located within the S1 gene of IBV. 21 For the multiplex RT-PCR, the rC2U primer was designed to target the conserved sequences of the IBV H120 vaccine, IBV TW-I, and IBV TW-II strains, which are outside the HVR.3,24 On the other hand, the differential primers for the IBV H120 vaccine, IBV TW-I, and IBV TW-II strains target positions located within the HVR, a region that is prone to genetic mutations. 3 However, efforts were made to avoid these issues when designing the primers for ARMS RT-PCR. The IBV-F and IBV-R primers were used as the universal primers for the conserved regions based on the sequence alignment of a range of IBV strains. Thus, the IBV-F and IBV-R primers served as group-specific primers and were specially targeted toward IBV strains from East Asia. The IBV vaccine strains and wild-type strains are able to be amplified using the 3′-end of the IBV-V primer and the IBV-W primer, respectively. The IBV vaccine and avirulent (Beaudette) strains are able to be amplified by the IBV-V primer, and all IBV wild-type strains, including the IBV Taiwan strains, the IBV China strains, and the IBV JP/Kanagawa/2001 strain, are able to be amplified by the IBV-R primer. Thus, both the IBV-V and IBV-W primers are able to serve as genotype-specific primers. This is different to the study of Chen and Wang 3 where only genotype-specific primers were used, and those primers were not able to differentiate the IBV Mass and IBV H120 strains.
The minimum amount of IBV that can be detected by multiplex RT-PCR ranged from 1 to 5 fg, which is equivalent to 103 copies of IBV RNA.3,29 However, the detection limit of the ARMS RT-PCR was 5 copies of IBV RNA per 0.5 ml of sample. This may be because the template DNA is augmented by the outer primers that act in parallel during the amplification, which leads to a process that is somewhat similar to that of nested PCR. To faithfully imitate the situation when field samples are used, the sensitivity of the ARMS RT-PCR was measured using a combination of the IBV vaccine and wild-type strains. The results, which are consistent with a previous study, 3 indicate that the sensitivity of the ARMS RT-PCR was not affected by a mixture of different IBV strains being present and that no mutual interferences between the primers were observed. As well, the assay detected IBV in all 35 field samples. The multiplex RT-PCR and HRMA that was developed specifically for the Australian IBV wild-type and vaccine strains is based on a single RT-PCR reaction and no information on the sensitivity of this test is available.9,10
Traditional melting curve analysis based on SYBR Green should be able to discriminate nucleotide sequence differences that involve insertions and/or deletions. However, the resolving power of this approach when the sequence differences involve nucleotide substitutions is usually not satisfactory because such substitutions only bring about limited changes in the melting temperature values. 28 Therefore, the HRMA method developed in the current study used the saturating dye EvaGreen. This dye is able to intercalate between every single nucleotide of the amplicons without any drawbacks such as signal fading during the early phase of melting analysis. 30 The main basis of RT-PCR and HRMA for IBV developed in Australia is the series of significant deletions of various lengths up to 205 bp that occur between strains. These deletions provide enough difference to be reflected in the Tm values.9,10 Using primers outside the variable regions, the PCR products of the Australian assay can be used to readily differentiate Australian strains by HRMA and their genotype confidence percentages (GCPs).9,10 However, the consistency of average HRM GCPs may depend on the quantity of template cDNA, and this is likely to be a problem when clinical samples such as trachea, kidney, and allantoic fluids are used. This is because there are variable amounts of virus in the samples as well as differences in the nonspecific inhibitors and salts present, all of which may affect both reverse transcription and amplification from the RNA. 25 Hence, an adjustment in the amount of cDNA template so that all samples are within a narrow range seems to be important for the reliability of such an assay. 10
In contrast to the situation in Australia, the IBV wild-type and vaccine strains in Taiwan show only limited polymorphisms with only short deletions of up to 8 bp. 20 These differences are not likely to result in sufficient differences in Tm values when using traditional RT-PCR and HRMA. Similar difficulties in other viruses have been circumvented by the addition of unlabeled probes, the use of snap primers, and the use of multiplex PCR, to better separate Tm values and to produce more distinct melting curve profiles.7,22 The ARMS qRT-PCR approach belongs to the latter strategy. When the Tm values derived from HRMA performed in the current study are examined, the IBV vaccine strains (78.29 ± 0.06°C and 78.84 ± 0.02°C) can be readily distinguished from the IBV wild-type strains (80.37 ± 0.02°C and 80.67 ± 0.03°C). As long as reference samples are included in the HRMA for each independent analysis, the HRMA profile can distinguish variants with differences in Tm values as little as 0.15°C. 17 This can be achieved by the use of average of HRM GCPs. However, variations in Tm values and discrepancies in GCPs were found among the tested samples in the current study when using ARMS qRT-PCR combined with HRMA. Despite the yield of RT-PCR products being increased via the nested PCR–like platform, which should also help to reduce any possible interference by nonspecific inhibitors, sometimes variations in the amount of IBV template, although to a lesser extent, may still remain. It is also difficult to exclude the possibility that other polymorphisms within the HVR are present within the area amplified by the conserved sequences targeted by the ARMS qRT-PCR primers, and this may partly lead to a higher variation in the Tm values of the IBV TW-II samples.14,15 Therefore, a new strategy was developed as part of the present study, which consisted of a comparison of the Tm value of each sample with the distinct range of Tm value of each reference strain or a comparison of the normalized melting curve profiles that consist of a combination of peaks of different shapes, sizes, heights, widths, and number. The relative distribution patterns of the normalized HRM curves offer a feasible approach to the genotyping of IBVs that circulate in Taiwan. The present results were consistent with those from previous multiplex RT-PCR assays and those obtained by sequencing analysis. Moreover, the classification of 4 genotypes of IBV strains in Taiwan, namely Mass, H120, TW-I, and TW-II strains, was also achieved. The reproducibility of these systems was established using 35 field samples tested in triplicates.
As early as 20 years ago, both thermocyclers and real-time thermocyclers have become commonplace in many diagnostic laboratories. Because of the absence of postreaction processing, only a short time of less than 5 hr is needed to carry out the whole process. The rapidity and the low cost of both the ARMS RT-PCR and the ARMS qRT-PCR approaches, which need US$15 per samples compared with US$20 for a regular sequencing reaction make them good options when carrying out differential diagnosis of IBVs, especially in China and Taiwan. Even though the present systems are unlikely to be developed as a universal diagnostic approach for IBV worldwide due to the high variability of viruses across different geographic areas, the general methodology has a high applicability in specific geographical areas like Taiwan and China and can also be adapted to other viruses.
Footnotes
Acknowledgements
The authors thank Professor Po-Chung Chang for providing the standard strains of IBV TW-I and TW-II.
a.
Intervet Co., Boxmeer, The Netherlands.
b.
ABIC Ltd, Beit Shemesh, Israel.
c.
MD Co., Taipei, Taiwan.
d.
Protech Technology Enterprise Corp., Taipei City, Taiwan.
e.
pGEM-T vector, Promega Corp., Madison, WI.
f.
DH5α component cells, Promega Corp., Madison, WI.
g.
Promega Corp., Madison, WI.
h.
Riboprobe in vitro transcription systems, Promega Corp., Madison, WI.
i.
Promega Corp., Madison, WI.
j.
Sephadex G-50 column, Amersham Biosciences, Piscataway, NJ.
k.
Qiagen GmbH, Hilden, Germany.
l.
Rotor-gene Q series software, Qiagen GmbH, Hilden, Germany.
Declaration of conflicting interests
The author(s) declare no potential conflicts of interest with respect to the research, authorship, and/or publication of this article.
Funding
The author(s) received no financial support for the research, authorship, and/or publication of this article.