
Abstract
To understand the mechanistic basis of innate immunity against the infectious bronchitis virus (IBV), the gene transcription profile of pattern recognition receptors (PRRs) in SPF chicken tissues infected with an IBV-M41 strain was examined. IBV infection induced mRNA transcription of TLRs, RLRs, and NODs. TLR7, MyD88, TRAF6, MDA5, LGP2, and NLRC5 were stimulated, as well as mRNA activation of the downstream genes of NF-κB and IRF3. And mRNA for the pro-inflammatory cytokines of interferon-α (IFN)-α, IFN-β, tumor necrosis factor-α (TNF-α), and interleukin-1β (IL-1β) showed over-expression. The IBV load in tissues gradually reduced. These results suggested that the three kinds of PRRs signaling pathways and innate immune cytokine were induced after IBV infection.
Introduction
Infectious bronchitis (IB), caused by the infectious bronchitis virus (IBV), is a highly contagious disease of chickens. IBV initially enters the avian host through the respiratory tract and causes destruction of the epithelium, which leads to respiratory distress.1,2 Depending on the strain, IBV also invades other epithelial surfaces such as the urinary tract, the digestive tract, and the oviduct. 3
Three types of pattern recognition receptors (PRRs) have been involved in the recognition of pathogen-associated molecular patterns, namely the membrane-bound Toll-like receptors (TLRs), retinoic acid-inducible gene-I (RIG-I)-like receptors (RLRs), and the nucleotide-binding oligomerization domain (NOD)-like receptors (NLRs). The recognition triggers a series of signaling cascades that culminate in activation of transcriptional factors such as nuclear factor-κB (NF-κB) and interferon regulatory factor (IRF), which induces numerous downstream genes encoding a broad range of inflammatory cytokines, chemokines, complement factors, and interferons (IFNs). 4 Receptors such as TLR3, TLR7, TLR2/6, MDA5, and LGP2, initiate the local trachea immune response upon recognition of IBV.5–7 NLRC5 belongs to NLRs, its recognition and role in chickens following infection with IBV remain unclear. The activated PRRs trigger the production of type I IFN for preventing viral replication and diffusion. 8 Virulent IBV elicits a strong immune response in chickens and increased expression of pro-inflammatory cytokines in the tracheal tissue. The expression of pro-inflammatory cytokines was involved in recruiting polymorphs and mononuclear leukocytes to the primary infection site. 9 The highest upregulation of interleukin 6 (IL6), IL1β, and IFNγ coincided with highest viral load and microscopic lesions. 10 RNA sequencing–based analysis of the spleen showed T cell activation and proliferation following IBV infection of chickens. 11 Transcriptome was analyzed for chicken kidney tissue following IBV infection. 12 Even so, the knowledge for systemic signaling pathways’ response to IBV in chicken is absent, which would help in further understanding of the immune pathogenic mechanism of avian coronaviruses.
Materials and methods
Ethics statement
All procedures have been approved by the Veterinary Sciences Animal Care Committee of the Beijing University of Agriculture (No. 20140012).
Virus
The M41 strain of IBV was obtained from China Institute of Veterinary Drug Control (Beijing, China). The virus was propagated in 10-day-old specific pathogen–free (SPF) embryonated chicken eggs via the allantoic sac route. The titer of 50% embryo infectious dose (EID50) was determined in embryonated chicken eggs according to standard procedures.
Experimental design
Two groups of SPF chickens (White Leghorn lineage) were housed in separated positive pressure isolators. At 20 days of age, one group was experimentally infected via intranasal routes with 10 2.0 EID50/bird of the IBV M41 strain in an isolator. Another group was used for negative control, which was mock infected with SPF allantoic fluid and maintained under the same conditions. Five chickens per interval from each group were sacrificed at 3, 4, 6, 8, and 10 days post-infection (DPI), respectively. Blood, trachea, lung, kidney, and spleen tissues samples were collected from each group. The blood was centrifuged, the supernatant serum was collected. A portion of tissue samples was immediately frozen and kept at −70°C until further usage. At the same time, the tissues were prepared for gross lesion analysis and histopathology. 10
Real-time quantitative reverse transcription polymerase chain reaction
The RNA was extracted from tissues of experimental chickens using Trizol Reagent (Invitrogen Biotech. Co., Ltd, Shanghai, China) following the manufacture’s instruction. The RNA was qualitated on a 1% gel and quantified by ultraviolet (UV) absorbance at 260 nm (A260). The extracted RNA was converted to cDNA using the reverse transcriptase and Oligo(dT) primers (Invitrogen Biotech. Co., Ltd, Shanghai, China).
The relative quantification of messenger RNA (mRNA) expression of target genes in tissues was determined by real-time quantitative reverse transcription polymerase chain reaction (real-time qRT-PCR) with the SYBR Green I marker. The reaction mixture contained 2.0 µL of cDNA, 10.0 µL of 2 × SYBR Green I mix (Beijing Kangwei Biotech. Co., Ltd, Beijing, China), and 10 pmol of primers specific for each gene (Table 1) in a final volume of 20 µL. The amplification reaction included a preincubation step at 95°C for 10 min. This reaction was followed by 40 cycles of amplification, including denaturation at 95°C for 15 s, annealing at 55°C–60°C for 60 s, and extension at 72°C for 30 s. Following amplification, a melting curve analysis was performed by raising the incubation temperature from 65°C to 95°C in 0.2°C step with a hold of 1 s at each increment. The PCR primers used were according to the references, or designed according to sequences deposited in GenBank using Primer 3 software (Table 1).
The Primer Sequences Used in the SYBER Green I Real Time PCR.

F: forward; R: reverse.
The relative expression of genes, except the viral load, in the samples of infected chickens was quantified as the fold change relative to the negative control group at the same time point. 13 The relative viral load was expressed in terms of the β-actin. The gene expression from each sample was standardized using the Cq value of the β-actin RNA for the same sample. 13 The mean values ± standard deviation (SD) (n = 5) of individual group were calculated. All analyses were conducted using GraphPad software (version 6.0).
Pro-inflammatory cytokine bioassay and MDA analysis
Tumor necrosis factor α (TNF-α) and IL-1β concentrations in serum were measured using commercially available enzyme-linked immunosorbent assay (ELISA) kits with lowest limit of detection at 7.8, 4.5 ng/L, respectively, from R&D systems. MDA was determined using MDA kit from Nanjing Jiancheng Co. Ltd. according to the manufacturer’s instructions.
Results
Clinical and pathological observations
There were no clinical signs, gross or histological pathologic lesions observed in the negative control group for all tested post-infection intervals. While the IBV-challenged group began to show clinical signs in scattered patterns on the 2 DPI. By the 3 DPI, most of the chickens of IBV-challenged group developed non-specific signs, such as huddling together and drooping wings. The clinical signs showed at 4 DPI were more serious and typical, including closing eyes, stretching of the neck, and panting hard. The severity of lesions and clinical signs decreased significantly or recovered by 10 DPI. Histopathology changes included loss of cilia and epithelial cells, degeneration of glands, inflammatory infiltrate of the mucosa and inflammatory infiltrate of the adventitia (Figure 1). The degree of hurt in turn was bronchi, lung, kidney, and spleen.

Microscopic changes in the trachea and lung of chicken infected with IBV. (a) and (c) the trachea and lung control group and (b) and (d) the infected group.
Relative IBV load
The N gene of IBV in tissues was detected negative by real-time qRT-PCR. The relative IBV load calculated as the N gene vs. β-actin increased to nearly fourfold in the trachea and lung at 3–6 DPI (Figure 2), and then gradually decreased. Additionally, significant positive correlations were observed between the viral load and the tissue histopathology grade.

The relative IBV load in tissues.
The mRNA expression of the TLR7 pathway
IBV-infected chicken had significantly higher TLR 7 mRNA expression in the trachea and lung tissues compared to the uninfected controls (Figure 3(a)). The TLR7 mRNA expression in the trachea reached a peak level at 6 DPI, while the peak level in the lung was observed at 8 DPI, and the TLR7 mRNA expression in the kidney and spleen exhibited down-regulation between 2 and 4 DPI, and gradually increased after 6 DPI.

The mRNA expression of the signal pathways, type I IFN and pro-inflammatory cytokine: (a) TLR7, (b) MyD88, (c) TRAF6, (d) MDA5, (e) LGP2, (f) NLRC5, (g) NF-KB, (h) IRF3, (i) IFN-α, (j) IFN-β, (k) TNF-a, and (l) IL-1β.
The mRNA expression data for MyD88 and TRAF6 (downstream genes of TLR7) are illustrated in Figure 3(b) and (c), respectively. The MyD88 and TRAF6 mRNA expression was similar to the TLR7 expression in the lung and kidney, and reached a peak level at 6 DPI, while there was no significant change in the spleen.
The mRNA expression of the RLRs and NLR pathways
IBV infection caused an over-expression of the MDA5 (Figure 3(d)) gene in the trachea and lung, which reached peak at 4 DPI and then gradually decreased, but still remained above the tissue levels of the negative control group through 10 DPI. The LGP2 (Figure 3(e)) and NLRC5 (Figure 3(f)) also were over-expressed following IBV infection in the trachea and lung tissues at all time points, and reached peak at 3 DPI and 4 DPI, respectively, and gradually decreased at 10 DPI in chicken tissues compared to the negative control. LGP2 expression in lung tissue showed symmetrical peak with the peak time at 4–6 DPI.
The mRNA expression of the IRF3 and NF-κB pathways
IRF3 (Figure 3(h)) was up-regulated in the trachea and lung, and reached peak level at 8 DPI. NF-κB (Figure 3(g)) gene expression gradually increased with time in the trachea, lung, and kidney tissues; the highest level of relative expression was 10-fold in the lung at 10 DPI, followed by the kidney and trachea. Compared with other genes, over-expression of the NF-κB gene occurred the latest during the experimental time frame.
Expression of mRNA for IFN and pro-inflammatory cytokines
IBV infection increased the mRNA expression of IFN-α, IFN-β, IL-1β, and TNF-α (Figure 3(i)–(l)). The levels of over-expressed IFN-α and IFN-β, after peaking at 3 DPI, declined gradually. The expression level of IL-βhad a similar trend with IFN-α and IFN-β. The expression level of TNF-α gradually climbed and peaked at 6–8 DPI, then declined. Pro-inflammatory transcripts evaluated in this study were significantly up-regulated in tissues of the trachea and lung, followed by the kidney. The highest levels of relative expression were approximately two- to threefold higher than those negative control birds.
Cytokine assay and MDA analysis
The negative control chickens kept baseline level of expression throughout the experiment. The infected chickens showed increase in TNF-α, IL-1β, and MDA from 3 DPI, with onward levels being significantly higher than the negative control chickens (P < 0.01) (Figure 4).
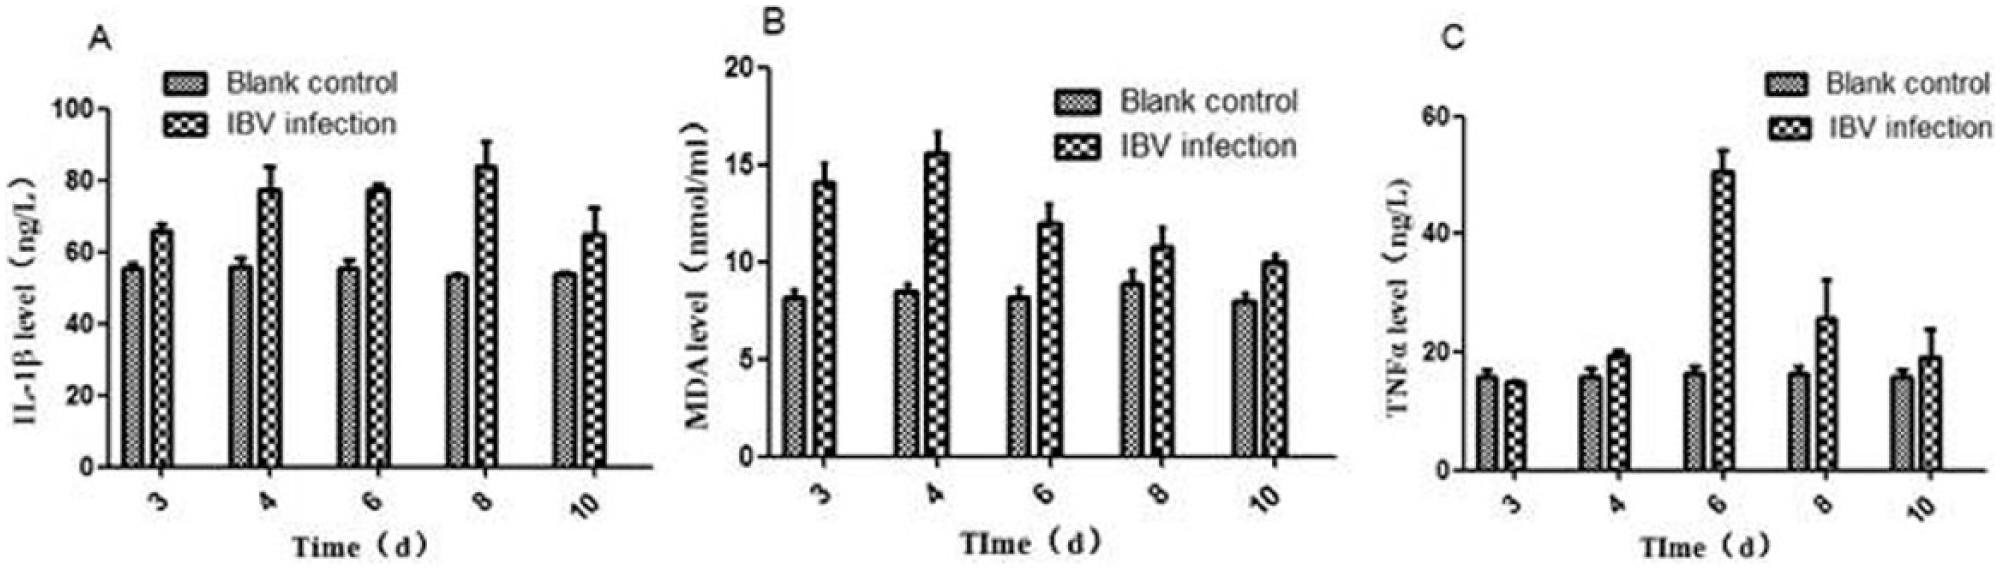
The cytokines and MDA levels, (a) IL-1β and (c) TNF-α were measured using ELISA kits, (b) MDA was determined using MDA kit.
Discussion
In the preliminary study, we had infected SPF chicken using 102, 104, and 106 EID50; the three dosages induced 100% morbidity, and zero mortality. The following test, we used the 102 EID50 for infection dosage. We monitored the severe histopathological lesions and high IBV loads in the trachea during early stages of the infection; the tissue lesion and viral load showed positive correlation. Tracheal mucosa is the primary target for IBV invasion. 10 The replication of IBV generated massive viral RNA, including ssRNA, dsRNA, and other RNA intermediates, which are recognized by the relative PRRs and lead to activation of various signaling pathways. We examined the mRNA dynamics of TLR7, MDA5, LGP2, NLRC5, and downstream signaling molecules at different phases in the four tissues of IBV-infected chickens. The increased expression of TLRs, RLRs, and NLRs and the downstream signaling molecules of IRF3 and NF-κB genes indicates initiation of the host immunity response. The downstream signal transduction of NF-κB and IRF3 was activated and over-expressed, and finally induced IFN and the production of inflammatory cytokines. The mRNA and protein levels of type I IFN were up-regulated and increased during the same period. The combination of the IBV load in tissues and induction of the PRRs and their downstream IFNs and pro-inflammatory cytokines suggests that the host performed immunity response may play an important role in inhibition of the IBV replicate in tissues. IB disease is a transient infection and the innate immune response is reasonable enough to fight against the IBV infection. The inflammation is under control.
NLRC5 belonging to the NLR family is another intracellular receptor. The knockdown of NLRC5 expression negatively mediated gene expression of IFN-α and IFN-β in the chicken HD11 cell line, 14 and it was likely that NLRC5 played a positive role in the regulation of IFN-α and IFN-β expression. 15 In this study, NLRC5 and the downstream gene expression of the NF-κB, IFNs (IFN-α and IFN-β) and IL-1β were up-regulated by IBV infection. The role of chicken NLRC5 in response to IBV infection needs to be further studied.
In summary, IBV infection activates three types of PRRs, including TLR7, MDA, LGP2, and NLRC5. IBV infection further triggers activation of the transcription factors IRF3 and NF-κB, and over-expresses adaptive antiviral genes such as IFN, but also pro-inflammatory cytokines. These responses were accompanied with reduction of the relative IBV load in chicken tissues. Additionally, NLRC5 signaling pathway was activated and its role in IBV viral invasion needs to be further studied.
Footnotes
Declaration of conflicting interests
The author(s) declared no potential conflicts of interest with respect to the research, authorship, and/or publication of this article.
Funding
This research was supported by the National Science Fund of China (31372485), the National key research and development program (2016YFD0501307), and Open Project Program of Beijing Key Lab of Traditional Chinese Veterinary Medicine at Beijing University of Agriculture(kf2016036). We thank Ross C. Beier for the language improvement.