
Abstract
The application of variable-number tandem repeats (VNTR) genotyping of Mycobacterium avium subsp. paratuberculosis isolates to assist in investigating incidents of bovine Johne’s disease in a low-prevalence region of Australia is described in the current study. Isolates from a response to detection of bovine Johne’s disease in Queensland were compared with strains from national and international sources. The tandem application of mycobacterial interspersed repetitive unit (MIRU) and multilocus short sequence repeats (MLSSR) genotyping identified 2 strains, 1 that infected cattle on multiple properties with trace-forward histories from a common infected property, and 1 genotypically different strain recovered from a single property. The former strain showed an identical genotype to an isolate from India. Neither strain showed a genotypic link to regions of Australia with a higher prevalence of the disease. Genotyping has indicated incursions from 2 independent sources. This intelligence has informed investigations into potential routes of entry and the soundness of ongoing control measures, and supported strategy and policy decisions regarding management of Mycobacterium avium subsp. paratuberculosis incursions for Queensland.
Keywords
Johne’s disease (JD, paratuberculosis) is a wasting disease of ruminants caused by pathological tissue changes in response to infection with Mycobacterium avium subsp. paratuberculosis (MAP). Johne’s disease was detected in November 2012 in a Brahman stud beef cattle herd (Q2012) in a central region of the State of Queensland, Australia. Central Queensland is a subtropical area considered to have a very low prevalence of JD. With the objective of preventing further spread of JD, a large program of tracing cattle movements and investigating and controlling risk of infection has been conducted. This program involved 280 properties, 75% of which have been resolved as low-risk either by risk assessment, testing, or by destocking and decontamination. Testing included histology and culture of samples from slaughtered trace-forward cattle (378 animals from 78 properties), culture with direct polymerase chain reaction (PCR) on fecal samples from live trace-forward cattle (111 animals on 26 properties), and pooled fecal samples from in-contact cattle (13,467 animals from 42 herds).
Results to date from this large-scale response indicate that there has been a small amount of spread of infection, which is being contained. Infection with MAP has been confirmed from samples collected at slaughter in 5 trace-forward animals in Queensland, but 3 of these animals appeared to have been in early-stage infection and unlikely to be excreting infectious levels of MAP prior to death. The in-contact animal cohorts of the other 2 infected trace-forward animals have been destocked to slaughter to eliminate risk of infection. Mycobacterium avium subsp. paratuberculosis infection was detected also by pooled fecal samples from in-contact, rather than trace-forward, cattle on another property (Q2013) where, out of 63 pools, 3 tested positive.
Identifying the sources of MAP infection for each of the Q2012 and Q2013 properties is important in understanding the potential extent of spread and the soundness of ongoing control measures. Identifying the phylogenetic relationship of the MAP isolated from Q2012 and Q2013 with known MAP strains (from previous incursions in Queensland, from other regions of Australia where bovine JD is more prevalent, and from other countries) may indicate the source of infection.
Over the past 12 years there have been a number of typing methods for MAP described in the literature, but often these are inadequate for meaningful epidemiological studies at the strain level. However, reports of multilocus sequence repeats show high levels of typing discrimination: high multiples of short repeated units 1 (multilocus short sequence repeats [MLSSR], analogous to eukaryotic microsatellites) and longer repeated units with a low number of repeats. Of the latter, a series of mycobacteria-specific repeats have been identified 16 (mycobacterial interspersed repetitive units [MIRUs]). When both are applied in tandem, the combined discrimination has been reported as extremely high 17 and, therefore, this approach was selected as the more likely laboratory procedure to identify the source of the Queensland isolates and determine if they represent 1 or multiple incursions. Such information is highly desirable for supporting strategy and policy decisions regarding management of the incursion(s) and continuation of Queensland’s protected status.
A key to any successful typing project is access to sufficient and relevant reference samples. With the aim to identify a likely source of the Q2012 isolates, reference samples were sought that represented as much spatial, temporal, and strain diversity as practicable. In addition, isolates from a number of host species were included, as the potential for a cross-species source of Q2012 should not be eliminated. One hundred nine reference samples included the following: type strain (n = 1); previous isolates from occurrences in Queensland and traceable to the southern Australian states (n = 3); dairy cattle, beef cattle, sheep, avian, camelid, zoo exhibit, and human isolates from southern States (Victoria, n = 22, 7 spatially distinct areas; New South Wales, n = 14, 5 spatially distinct areas; and South Australia, n = 1); bovine environmental samples from spatially distinct regions within 15 U.S. states (n = 62); and isolates from 4 ruminant species in India (n = 7). The collection of isolates, including those that were kindly donated, are listed in Supplementary Table 1.
Isolates archived as freeze-dried cultures were reconstituted in 7H9C medium for 6–8 weeks at 37°C. All of the 15 isolates from the Q2012 response were similarly cultured in 7H9C medium. The liquid cultures were transferred to 7H10 slopes for further culture, and visible colonies were picked off into sterile nuclease-free water. Alternatively, cells were precipitated directly from the liquid medium using ethanol, then washed and resuspended in sterile nuclease-free water. Cell suspensions were heated to 95°C for 20 min. Additionally, heat-killed cell suspensions or DNA extracts were provided by the Australian States of Victoria (VIC) and New South Wales (NSW). Cell suspensions donated from the United States and from India were provided on commercial transport and storage cards a that were processed according to the manufacturer’s instructions.
The MIRUs were resolved following the published method, 16 with only minor modifications to primer annealing temperatures that were optimized for the chemistry and instrumentation used. Amplification of each MIRU locus was performed in separate reactions. The PCR mixtures contained 1× polymerase reaction buffer, b 5 µg of bovine serum albumin, c 1 U of Taq polymerase, b 5 pmol each of locus-specific forward and reverse primers, 17.25 µl of sterile nuclease-free water, and 1 µl of cell lysate or 1-mm2 dried card a section. Reactions were heated to 94°C for 5 min to activate the polymerase, then 40 cycles of 94°C for 30 sec, 58°C for 45 sec (except MIRU7 where annealing temperature was adjusted to 61°C), and 72°C for 45 sec, and a final extension of 72°C for 5 min. Amplification was resolved with 1.5% agarose gel electrophoresis. Amplicon sizes were determined through comparison with a commercial DNA size marker. d To confirm consistency between runs, each batch of samples tested included at least 1 sample that had been tested previously.
To reduce costs and time of testing, the published MLSSR technique 1 was modified to a multiplexed fragment analysis. Multiplexed reactions consisted of 1× PCR master mix e ; 5 µl of Q-solution e ; and either 0.5 pmol each of SSR1-F5′FAM, SSR1-R, SSR5-F5′FAM, SSR5-R, SSR7-F5′VIC, SSR7-R, SSR10-F5′PET, SSR10-R, SSR11-F5′VIC, and SSR11-R, and 1.5 pmol each of SSR6-F5′PET and SSR6-R for mix 1, or 0.5 pmol each of SSR3-F5′VIC, SSR3-R, SSR4-F5′NED, SSR4-R, SSR8-F5′NED, SSR8-R, SSR9-F5′FEM, and SSR9-R for mix 2; 2 µl of cell lysate or 1-mm2 dried card a section; and 3 µl of sterile nuclease water for mix 2 only. Reactions were heated for 15 min to 95°C to activate the polymerase, followed by 40 cycles of 94°C for 30 sec, either 55°C for 90 sec (mix 1) or 57°C for 90 sec (mix 2), 72°C for 45 sec, and a final extension at 60°C for 15 min. Reactions were diluted 1:300 (mix 1) or 1:10 (mix 2), and 2 µl denatured in 10 µl of formamide mixed with fragment size standards f prior to resolution by capillary electrophoresis. g Fragments were assigned to bins and panels using commercial software. h
Prior to testing all samples, the tests for MIRUs and MLSSRs were optimized and validated using 4 strains (ATCC19673T, 4-189451-3, 1A52354, and T3193). As part of this validation process, amplicons for each allele represented in these 4 samples were confirmed for repeat unit nucleotide sequence and copy number using dye termination sequencing. These sequences were compared with published sequence data, enabling “normalization” for subsequent combination of all data (subject to the number of loci studied in other reports). Previously published descriptions of MIRUs3,5,6,9,12,14,16,18 have not provided details of the length or sequence of the repeated units. Hence, the repeated units were identified using software designed to detect imperfect tandem repeated units within the sequence data. 2 As previously published analyses report MIRU3,5,6,9,10,14,16,18 and MLSSR1,3,5–7,10–13,17 alleles as copy number, the copy number was determined for the samples in the validation study from the nucleotide sequences and was then applied to all samples with a corresponding fragment length. Subsequent nucleotide sequencing of every fragment was not required unless the length inferred a fraction or otherwise unrecognized copy number. Such standardization enabled comparison of the data with all the published MIRU and MLSSR types in addition to the samples tested herein.
The copy number genotype data combined with published data was used to determine genetic distance and create a minimum spanning tree (MST). The analyses were performed in Arlequin v3.5.1.2, 4 and the MST was optimized for graphic interpretation using HapStar v0.5. 15 When genotypes were identical, with a genetic distance of zero, these samples were represented by a single node.
All 8 MIRU loci were polymorphic within the collection of samples tested; however, in some loci, there was 1 highly prevalent allele and only low frequencies of others that reduced the discriminatory power of those loci. For example, locus 32 had a copy number of 2 in all except 1 sample from the United States that showed a copy number of 0, locus 47 had a copy number of 3 in all samples except 1 of avian origin from VIC that had a copy number of 2, locus 10 had a copy number of 1 in all except 1 sample from India (sample identity C2) that had a copy number 0, and locus 3 had a copy number of 2 in all except 2 samples (the avian isolate and a cattle isolate from NSW) that had a copy number of 1. Other MIRU loci (292, X3, 25, and 7) were observed to have copy numbers showing substantially more variation between samples. Of particular interest was locus 25 where a copy number of 5 was observed in only Q2012 and the samples from India.
Ten of the reported 11 MLSSR loci were used in the current study. On application of fragment analysis, locus SSR21 was observed to be prone to substantial stutter fragments of equal intensity that could not be rectified using common techniques. As this affected reproducibility and confidence in interpretation, this locus was removed from the study. Of the 10 remaining loci, 1 (SSR3) was monomorphic for the collection of samples tested, 3 (SSR4, 5, and 10) had 1 very frequent allele with 1 or 2 instances only of variation, and the remaining 6 were sufficiently polymorphic that the number and frequency of alleles present contributed to differentiation between most samples. Stability of the SSR loci was inferred by the repeatability of the type strain genotype between the authors’ laboratory and previous reports from other institutions.1,17 This was in accordance with a previously reported study of stability of 4 of the SSR loci used herein following repeated culture, which reached similar conclusions that SSRs 1, 8, and 9 were mostly stable but SSR2 was sufficiently unstable to be problematic in epidemiological tracing applications. 8
All MAP isolates from animals traced directly from the Queensland property where infection was first detected in 2012 had identical MIRU and MLSSR types, and this common strain was labeled Q2012. An examination of each VNTR scheme separately showed that Q2012 MIRU type did not match any of the samples sourced from Australia or the United States and tested in the current study, or any previously reported MIRU type. However, similarity was noted with the isolates received from India, with 2 isolates (S5 and S2) showing identical MIRU type to Q2012. The Q2012 MLSSR type did not match any of the samples sourced from Australia but was similar to a published bovine isolate from Ohio, USA 1 classified as type “2” (it was not possible to obtain a sample for MIRU typing), and had an identical MLSSR profile to one of the Indian isolates (S5) that was identical also by MIRU typing.
Graphical interpretation of the MST is provided in Figure 1. The figure represents genetic distance between the combined MIRU and MLSSR types of all isolates from the present study and from the literature where both techniques were used. 17 In the main graphic, branch lengths are fixed, hence they represent relative genetic distances between 2 nodes (branch lengths have been manipulated in the insets, for ease of interpretation). Where genotypes were identical, with a genetic distance of zero, these samples were represented by a single node, detailed in Supplementary Table 1. Where an interim haplotype is required to infer a link between 2 nodes but this haplotype is missing from the sample set, the missing interim node is represented by an unfilled node. Subjectively defined clusters based on relative genetic distances between aggregates of nodes have been indicated for ease of interpretation, and are cross-referenced to Supplementary Table 1.
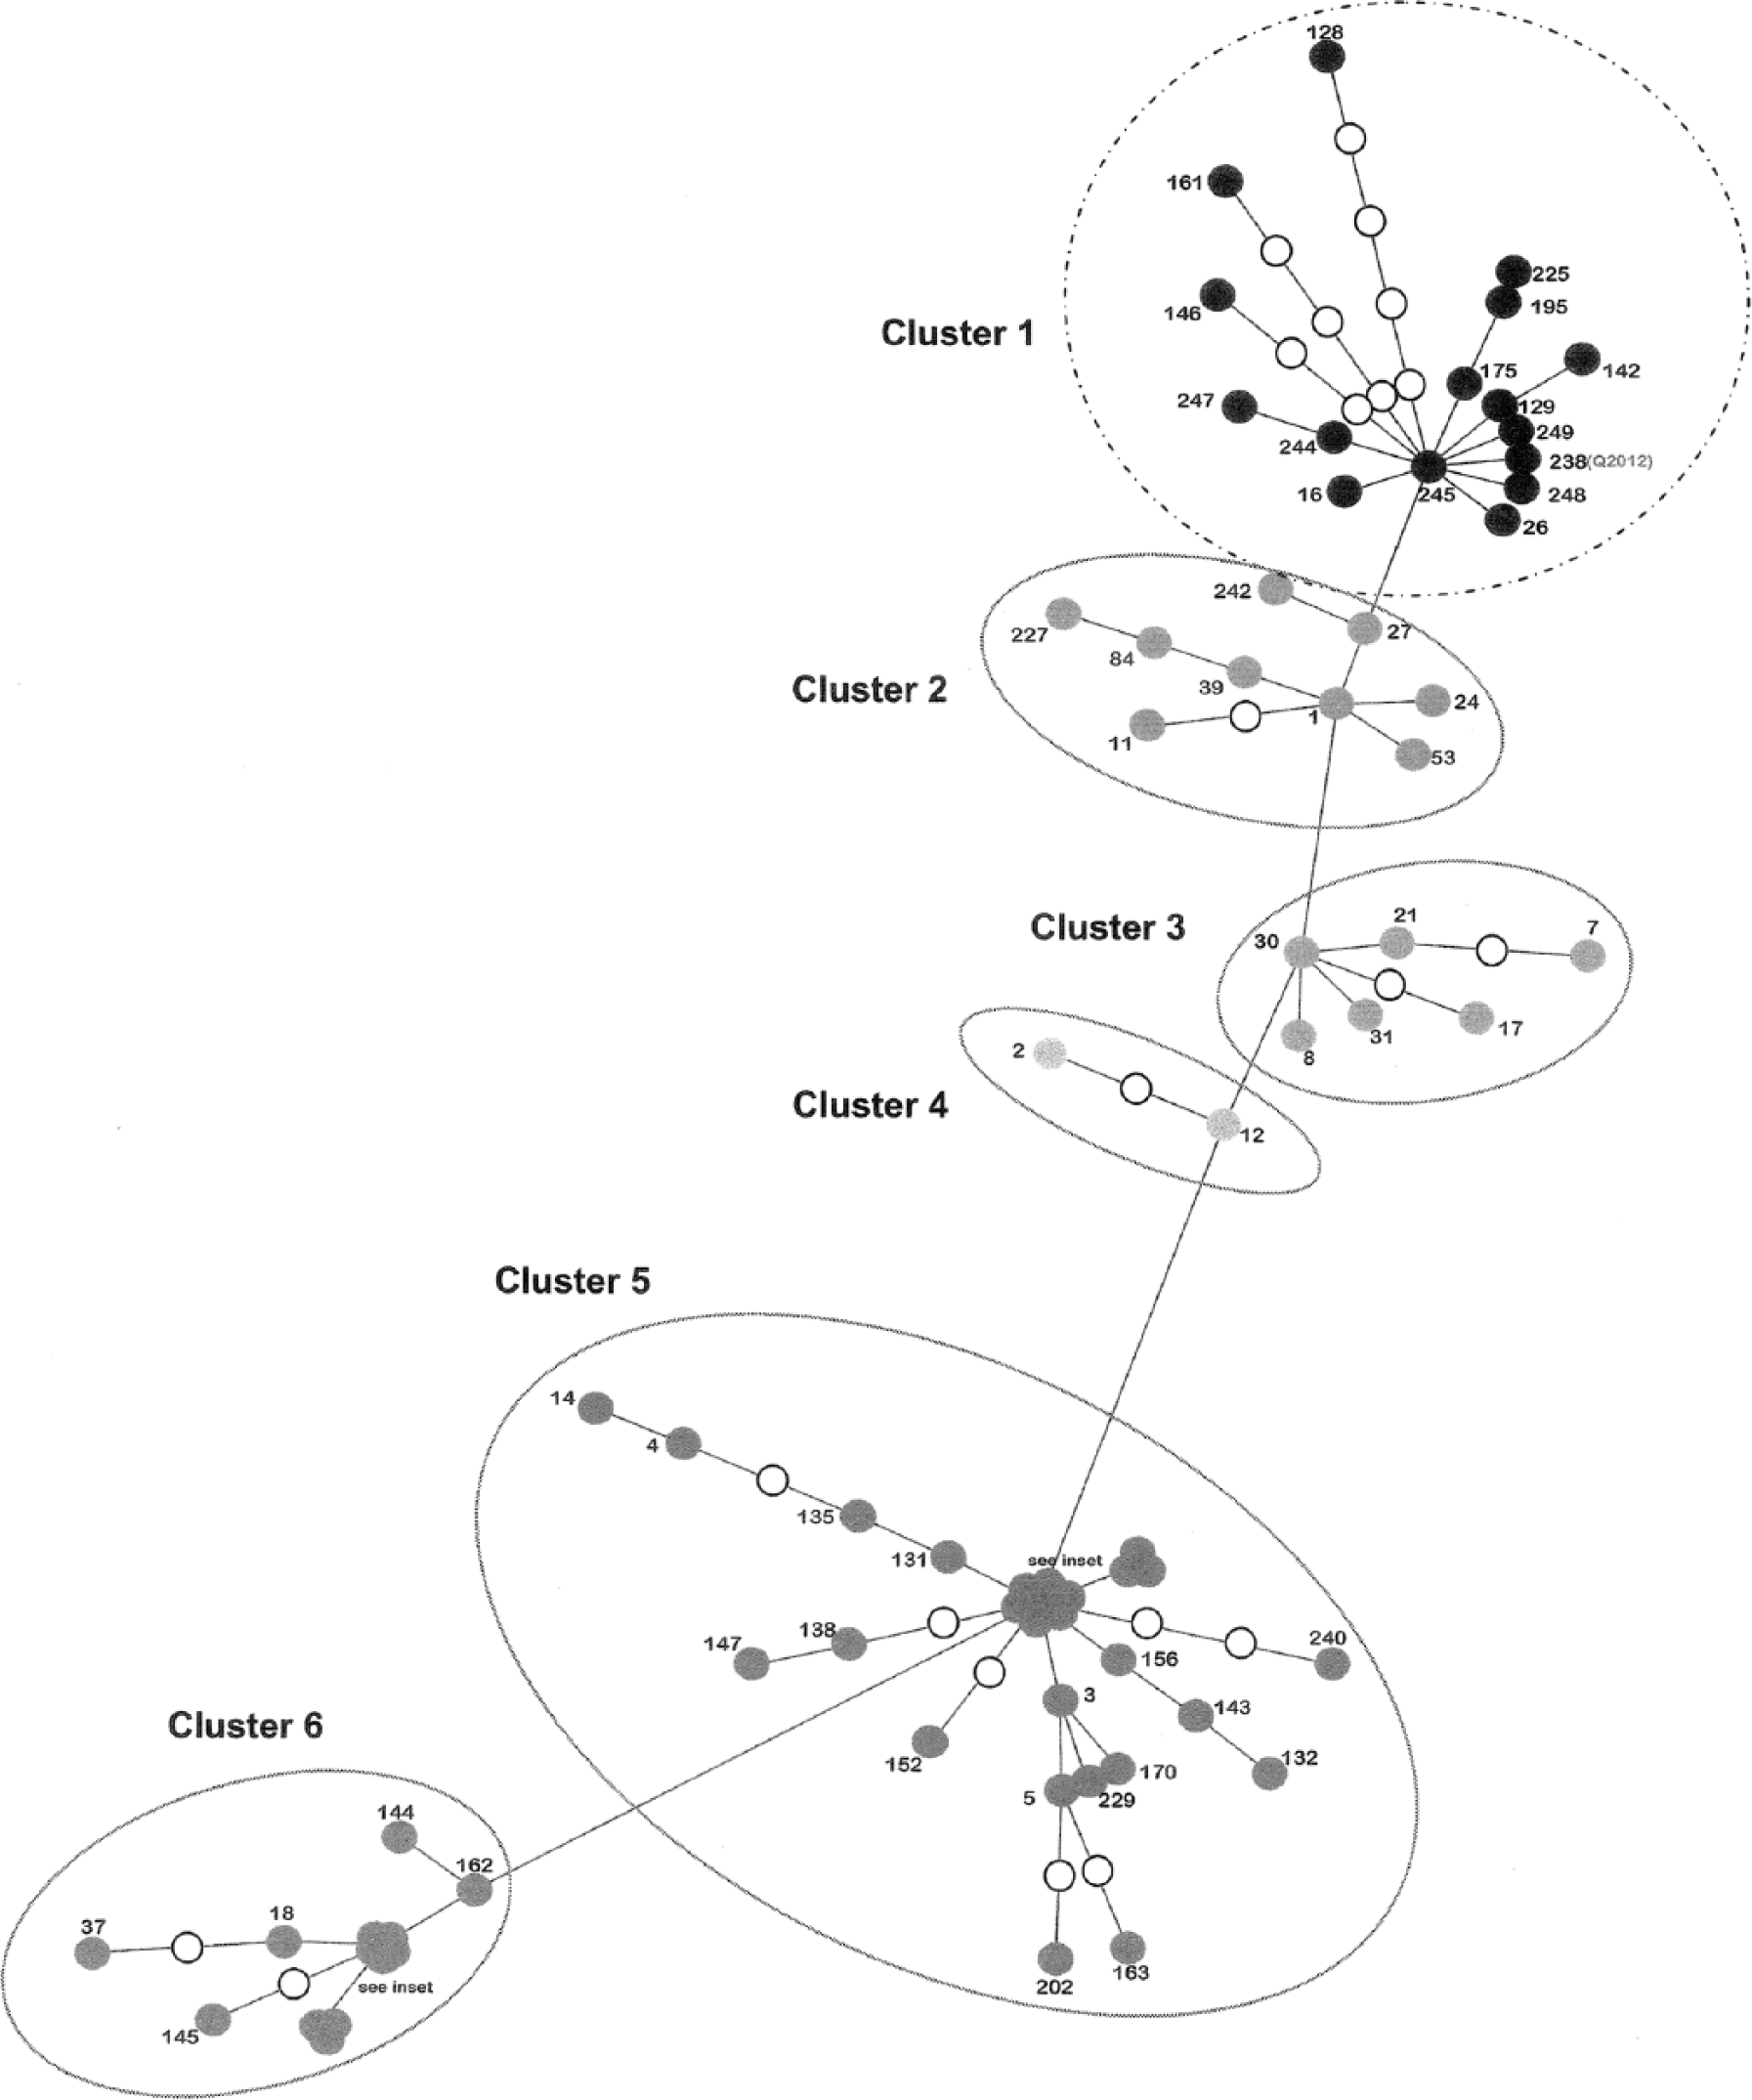
Branch lengths are fixed in the main graphic, representing relative genetic distances between 2 nodes (branch lengths have been manipulated in the insets, for ease of interpretation). Where genotypes were identical, with a genetic distance of zero, these samples were represented by a single node, detailed in Supplementary Table 1. Where an interim haplotype is required to infer a link between 2 nodes but this haplotype is missing from the sample set, the missing interim node is represented by an unfilled node. Subjectively defined clusters have been indicated for ease of interpretation.
The Q2012/Indian S5 genotype (node 238) is located in cluster 1 and shows a strong similarity to the other Indian isolates tested (nodes 244, 245, 247, 248, and 249). The cluster includes a very small proportion of the isolates from the United States, NSW, and VIC also (nodes 142, 146, 161, and 175), with branch lengths between these and node 238 tending to be longer than those between node 238 and the other isolates from India. The nearby cluster 2 represents mostly European isolates.
Clusters 3 and 4 consist of European isolates, with 1 node (21) including some South American isolates, and another (2) including 1 isolate from VIC. Cluster 5 includes ruminant samples predominantly from NSW, VIC, and the United States, with 4 nodes representing published data from France. Interestingly, the genotype represented by node 3 was found only in French cattle and 2 isolates from sheep in NSW. Cluster 6 is predominated by isolates from the United States, and includes 5 samples from NSW and VIC cattle cases and 2 samples from human cases in VIC.
The sample set included isolates of MAP from previous documented Queensland incursions. The isolates showed genotypic differences to Q2012, but similarities to genotypes from NSW and/or VIC. In most cases, these isolates were independently linked to these States by using trace-back data to movement of animals from NSW and/or VIC, hence the 2 processes were in accord. In Figure 1 (inset), 3 of these isolates are represented by node 157 and another by node 240 (both of which are in cluster 5).
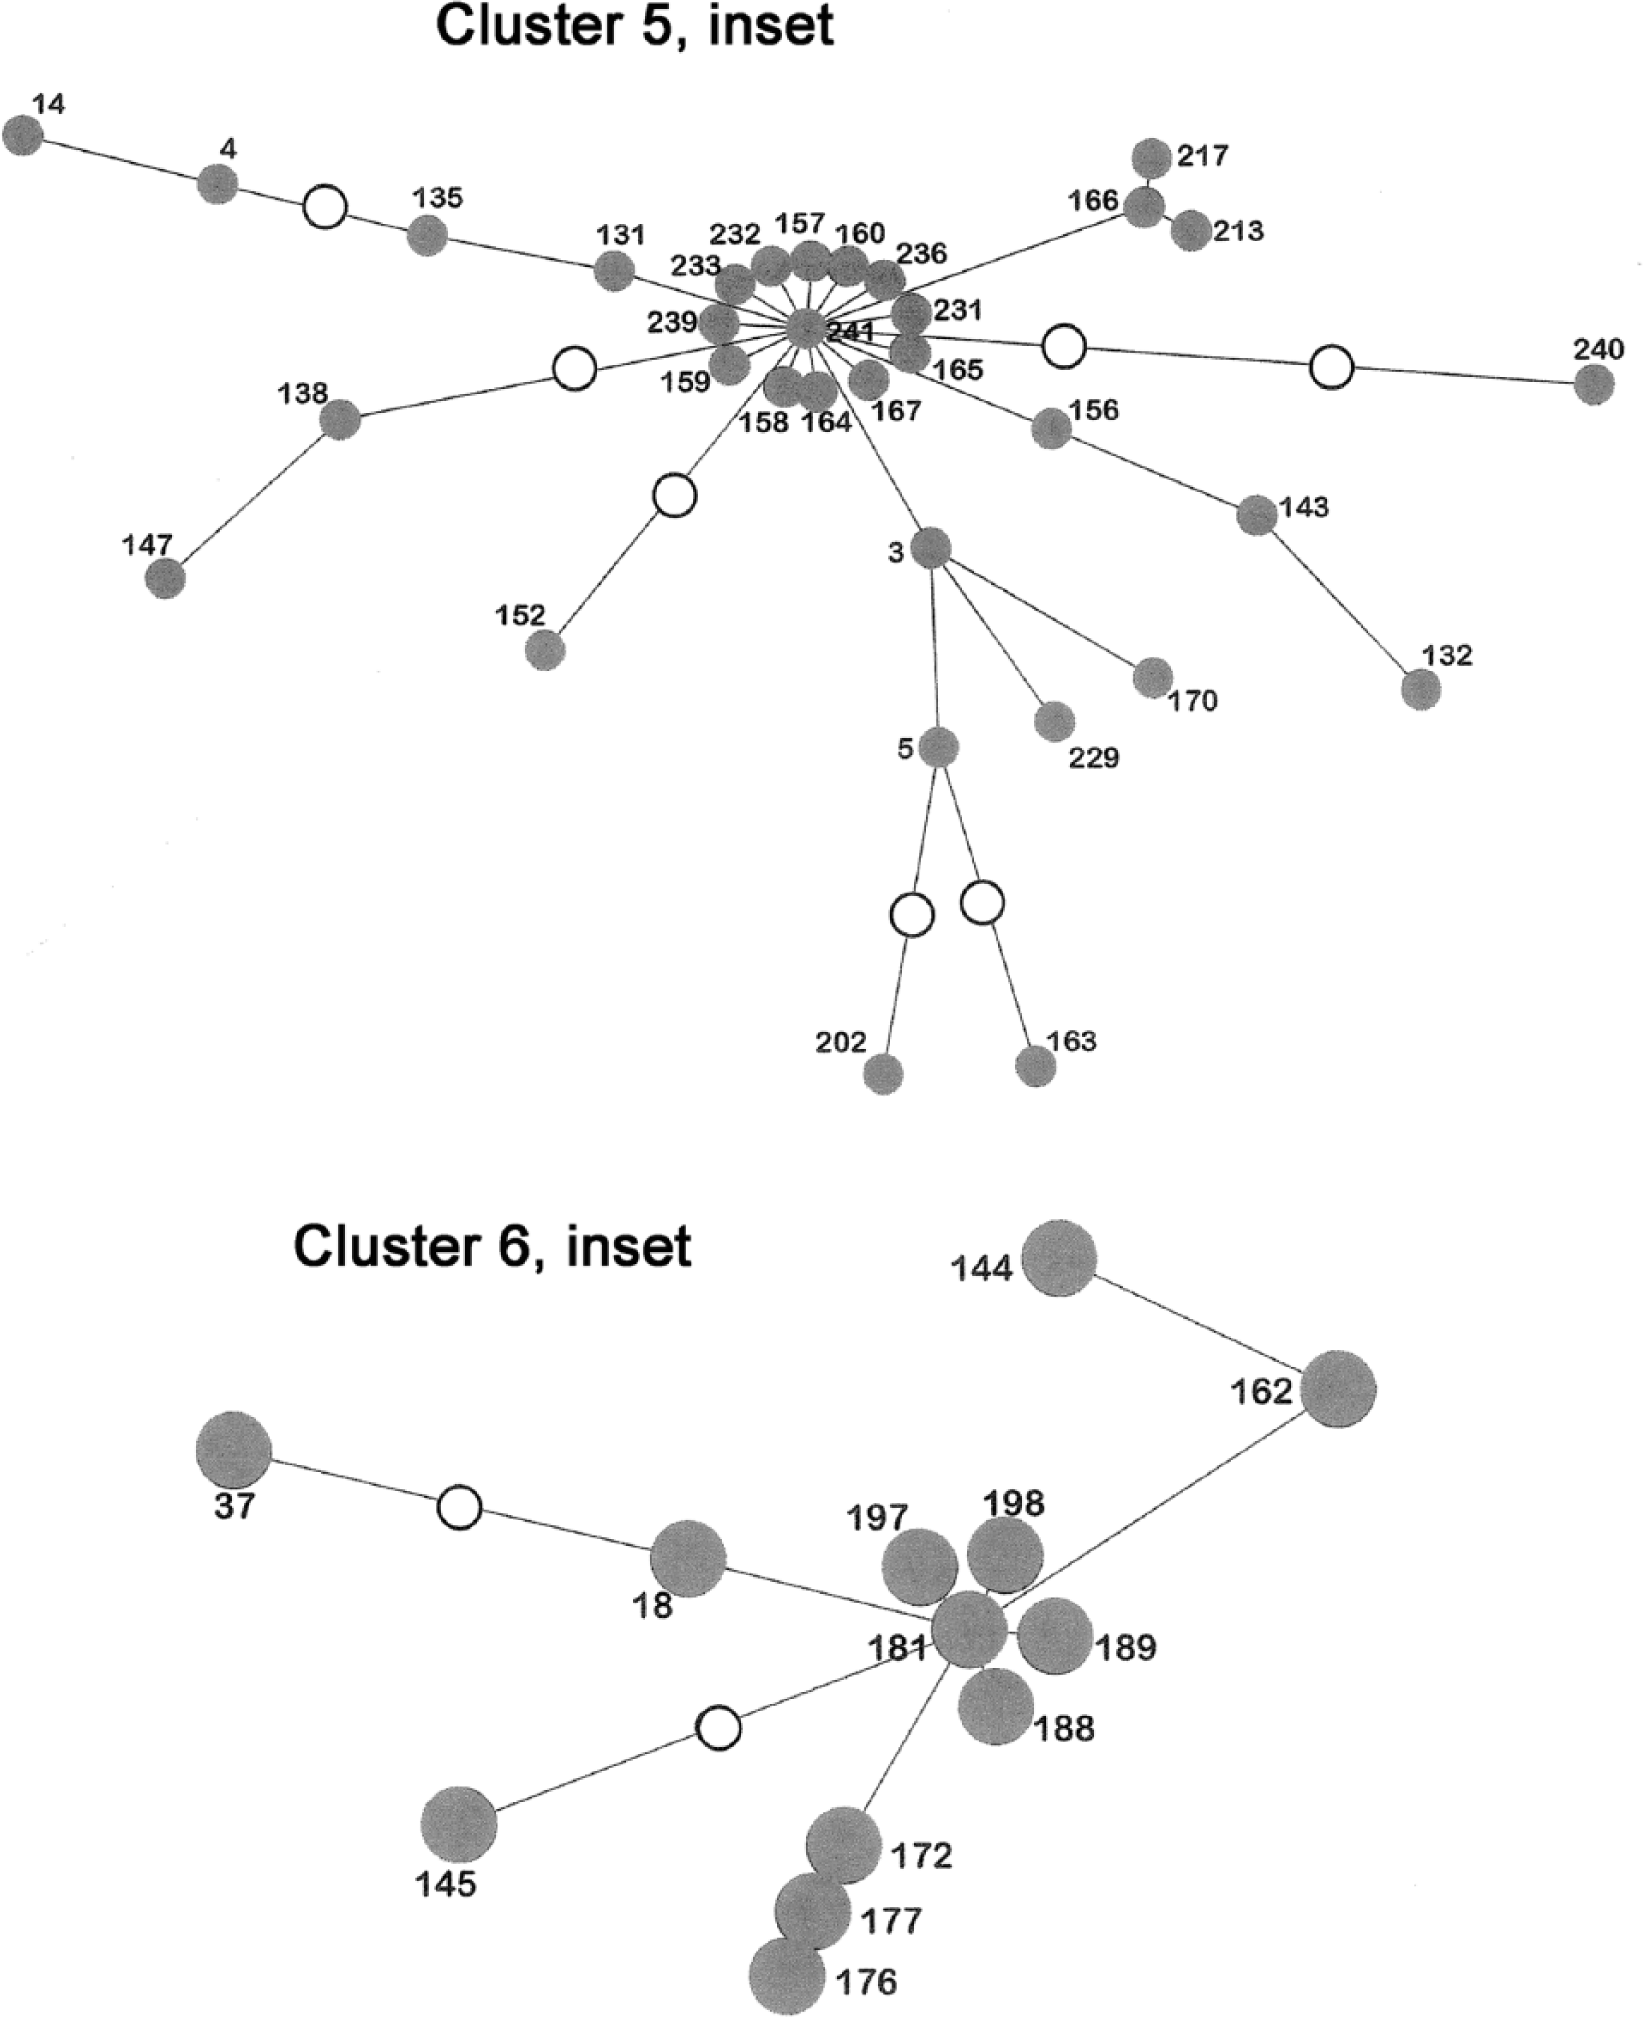
Insets from Figure 1, clusters 5 and 6.
The current study has presented one of the widest geographically spread studies of MAP isolates reported to date with regards to haplotypic diversity of previously described VNTR. In addition, this investigation of diversity has been applied to discriminate strains in an actual disease epidemiology response. The present study has demonstrated that, with some preliminary normalization tests, haplotype data generated in a single laboratory can be appended to corresponding data in the literature to expand the dataset, thereby increasing the depth of the study and the significance of a genotypic match. It must be noted that some studies5,7,10,13 have applied 1 or 2 MLSSR loci only, so potential haplotypic matches to these data must be treated with caution (such study data was not applied in the study described herein).
The current study has applied existing genetic technology to investigate the genetic relationship between 2 Queensland strains of MAP and against isolates from other geographic areas and livestock populations. The genotypes of Q2012 and Q2013 are sufficiently different to indicate that the isolates originated from independent sources. In a low-prevalence area, it might otherwise have been assumed that the Q2013 infections arose as a spread of infection from the Q2012 incursion or at least from a common source. Therefore, the results provided critical information and stimulate further epidemiological investigation toward identifying those sources. Moreover, the results emphasize the considerable epidemiological value of combining trace-forward activities with strain genotyping.
The only MAP strain that showed a complete match with Q2012 over all 18 loci was isolated from a goat by the Central Institute for Research on Goats in Makhdoom, India (S5). Interestingly, all isolates provided from India, irrespective of host species (goat, deer, sheep, or cattle) were sufficiently divergent from other strains tested that these isolates formed an apparent subcluster within cluster 1. This was more evident from the observed detection of rare and unique alleles than it was represented by the all-encompassing MST. For example, MIRU 25 (copy number 5) and MIRU 292 (copy number 2) were reported in the literature at very low frequency and only in the Indian isolates and Q2012 from the samples tested herein. The probability of unrelated isolates having both of these rare alleles is exceedingly low.
The identical haplotype between Q2012 and S5 and their low level of similarity to other Australian isolates infers that 1) Q2012 was introduced via either a direct source or an otherwise common link or reservoir between these isolates, and 2) Q2012 did not arise from a spread of infection from higher-prevalence areas of Australia. No definitive epidemiological link between India and the Q2012 incident has yet been established. Although the properties are stocked with Brahman breed cattle, this breed was introduced into Australia from the United States, and there is no recorded entry of cattle from India. Feral chital deer (Axis axis Erxleben, 1777) whose unrecorded origins for introduction into Australia likely included India (Australian Biological Resources Study, available at: http://www.environment.gov.au/biodiversity/abrs/online-resources/fauna/index.html) and rusa deer (Cervus timorensis Blainville, 1822) are known in the region around Q2012 but the incidence of MAP in these populations is completely unknown, and there is no reported cograzing of the feral animals and the affected cattle.
There were no genotypic matches to Q2013, either from samples tested in the present study or from published data. However, it is noteworthy that Q2013 is located in cluster 2 with published data from Europe, while MAP isolated from high-prevalence regions of Australia clustered into clusters 5 and 6 with isolates from the United States. The ability to apply strain-specific signatures provides a powerful method for comparison of any further isolates identified as potential sources, and also to investigate rapidly any possible forward movements from these incidents.
The tandem application of MIRU and MLSSR typing can be used to clarify origins and spread of MAP infection or movement of MAP-infected animals within and between geographic areas and livestock populations. Understanding the relatedness of infections provides a focus for epidemiological tracing of Queensland incursions. Identification of strain signatures provides a means of recognizing and mapping the spatial spread of each strain, and might be useful in identifying any breaches in local livestock movement restrictions. In low-prevalence and protected regions of Australia such as Queensland, this is highly useful information for supporting strategy and policy decisions regarding management of MAP incursions. More specifically, the recognition that Q2012 and Q2013 are 2 different strains shows that the link discerned between the 2 cases (movement of cattle from Q2012 and Q2013) was not the route of infection but that there were 2 independent incursions of MAP into Queensland. Additionally, genotyping results were consistent with a lack of any link with the more bovine JD-prevalent regions of Australia or with the United States, so although the sources for each of these incursions have not yet been identified, some costly, time-consuming, and potentially sensitive epidemiological investigations are unnecessary. The findings of the present study demonstrated also that there is no reason to reconsider the policies and procedures pertaining to movement controls between Queensland and the southern Australian states, as there is no evidence of a breach in the current procedures.
Footnotes
Acknowledgements
The authors are grateful to Dr. Ian Marsh (New South Wales Department of Primary Industries), Dr. Jacek Gwozdz (Victoria Department of Primary Industries), and Dr. Suelee Robbe-Austermann (National Veterinary Services Laboratory, U.S. Department of Agriculture, Iowa, USA) for kindly providing MAP isolates for this study. The authors thank also Dr. Janine Barrett (Biosecurity Queensland) for valuable editorial contributions. The authors thank the incident response directors Dr. Rick Symons (Biosecurity Queensland) and Dr. Allison Crook (Biosecurity Queensland) for their endorsement and for enabling and facilitating cooperation between laboratory and field operations.
a.
Whatman FTA Classic cards, GE Healthcare, Silverwater, New South Wales, Australia.
b.
MyTaq, Bioline (Aust) Pty Ltd, Alexandria, New South Wales, Australia.
c.
Fisher Biotec Pty Ltd, Wembley, Western Australia, Australia.
d.
EasyLadder I, Bioline (Aust) Pty Ltd, Alexandria, New South Wales, Australia.
e.
Multiplex PCR Mastermix, Qiagen Pty Ltd, Chadstone Centre, Victoria, Australia.
f.
Applied Biosystems LIZ600, Life Technologies Australia Pty Ltd, Mulgrave, Victoria, Australia.
g.
Applied Biosystems 3500xl genetic analyser, Life Technologies Australia Pty Ltd, Mulgrave, Victoria, Australia.
h.
GeneMarker v1.91, SoftGenetics LLC, State College, PA.
Declaration of conflicting interests
The author(s) declared no potential conflicts of interest with respect to the research, authorship, and/or publication of this article.
Funding
The work described was funded by the Queensland Government Department of Agriculture, Fisheries and Forestry.
References
Supplementary Material
Please find the following supplemental material available below.
For Open Access articles published under a Creative Commons License, all supplemental material carries the same license as the article it is associated with.
For non-Open Access articles published, all supplemental material carries a non-exclusive license, and permission requests for re-use of supplemental material or any part of supplemental material shall be sent directly to the copyright owner as specified in the copyright notice associated with the article.