
Abstract
A Bayesian latent class model was used to estimate the sensitivity and specificity of an immunoglobulin G1 serum enzyme-linked immunosorbent assay (Paralisa) and individual fecal culture to detect young deer infected with Mycobacterium avium subsp. paratuberculosis. Paired fecal and serum samples were collected, between July 2009 and April 2010, from 20 individual yearling (12–24-month-old) deer in each of 20 South Island and 18 North Island herds in New Zealand and subjected to culture and Paralisa, respectively. Two fecal samples and 16 serum samples from 356 North Island deer, and 55 fecal and 37 serum samples from 401 South Island deer, were positive. The estimate of individual fecal culture sensitivity was 77% (95% credible interval [CI] = 61–92%) with specificity of 99% (95% CI = 98–99.7%). The Paralisa sensitivity estimate was 19% (95% CI = 10–30%), with specificity of 94% (95% CI = 93–96%). All estimates were robust to variation of priors and assumptions tested in a sensitivity analysis. The data informs the use of the tests in determining infection status at the individual and herd level.
Deer farmers in New Zealand have been seeking to reduce the on-farm impact of paratuberculosis, caused by Mycobacterium avium subsp. paratuberculosis (Map). In contrast to the chronic disease syndrome seen in adult sheep and cattle, the highest incidence of clinical paratuberculosis or Johne’s disease is recorded in young (2 years old) farmed deer, which succumb rapidly to emaciation and death, often within weeks. Annual incidence of clinical disease has been seen at 20% in some herds, 8 while prevalence of infection has been estimated at 45% of animals and 59% of herds in the New Zealand farmed deer population. 13 This has potentially serious consequences for affected herds and for production across the industry. On farms believed to be free of infection, ensuring that replacements are sourced from herds of similar infection status is an important factor in maintaining that status. Herd classification programs may be set up to assist such herds, using diagnostic testing to support absence of infection in putatively uninfected herds. The approach requires an estimate of the accuracy of the currently available diagnostic tests, namely individual fecal culture (IFC) and an immunoglobulin G (IgG)1 serum enzyme-linked immunosorbent assay (ELISA), commercially marketed as the Paralisa.a,3
The test characteristics of IFC have not previously been established in the New Zealand deer population. Estimates of Paralisa sensitivity (Se; 91%) and specificity (Sp; 99.5%) have been published for clinically affected deer in the context of disease control. 3 However, there is limited data on the performance of the Paralisa in young and subclinically infected deer and for the target condition assessed in the current study (i.e., Map infection per se). The aim of the present study, therefore, was to estimate the Se and Sp of IFC and the Paralisa to identify young deer subclinically infected with Map. The unit of analysis was the individual, and the primary objective was to assess test accuracy for the purpose of demonstrating freedom from infection in a defined population. 19
The deer sampled for the study were phenotypically red deer (Cervus elaphus) and red-wapiti (Cervus elaphus canadensis) crossbreeds. Samples were sourced between July 2009 and April 2010 from a sampling frame of 241 herds participating in a national multispecies Johne’s disease and leptospirosis prevalence study involving a postal survey and on-farm sampling of a subset of responding farms (Verdugo C, Heuer C, Wilson PR: 2011, Association between paratuberculosis and production performance in New Zealand pastoral livestock. Proceedings of the Deer Branch of the New Zealand Veterinary Association, 28,pp. 145–149). For logistical and resource reasons, sample size was limited to 20 clinically normal yearlings (12–24 months old) from each of 20 South Island (SI) and 18 North Island (NI) herds. Deer herds were selected from the multispecies study herds from each island in the same proportions as those reporting clinical disease in the postal questionnaire (i.e., 25% of NI and 40% of SI samples were from deer herds that reported clinical disease). Paired blood and fecal samples were collected from each animal.
Fresh fecal samples, collected per rectum using a fresh glove for each sample, were transported in chilled insulated containers and cultured in liquid culture medium.b,18 Blood samples were collected by jugular venipuncture into 10-ml vacuum blood collection tubes, b using a new sterile needle for each animal, and transported in chilled insulated containers to Massey University (Palmerston North, New Zealand) where they were centrifuged at 1,512 × g for 15 min. Serum samples were drawn and tested with the Paralisa at the Disease Research Laboratory, Otago University (Dunedin, New Zealand), usually within 72 hr of collection. The Paralisa is an ELISA that uses 2 antigens, Map protoplasmic antigen and Map purified protein derivative, and an in-house anti-deer antibody. 3 Samples were scored positive if a cut-point of 50 ELISA units was reached for either antigen and were scored negative otherwise. Laboratory personnel were blinded to the source of the samples, and to the results of the other test.
A Bayesian latent class model was developed to estimate test Se and Sp. Briefly, Bayesian analysis combines existing knowledge, or prior information, about the parameters (e.g., test Se) with the data through a likelihood function to derive a posterior distribution. The median of the posterior distribution can then be used as an estimate, for example, of test Se. The latent class Hui–Walter model, 5 in which 2 tests are applied to 2 populations of differing prevalence, was further developed to handle 2-test data from multiple populations. 4 Deer from the North Island and South Island of New Zealand represented the 2 populations with differing herd-level Map infection prevalence, which has been estimated at 44% and 67% of NI and SI deer herds, respectively. 13 Model assumptions included independence of the 2 tests conditional on true infection status and constant test accuracy across the populations. Variation in prevalence among infected herds was incorporated by including herd as a random effect. Herds were allowed to have zero prevalence by using a zero-inflated probability model. The model was fitted using WinBUGS 7 and was run for 100,000 iterations, after discarding a burn-in period of 5,000.
Expert opinion from the laboratories applying the tests and data from previous field studies provided the prior information on test Se, test Sp, and herd-level prevalence in each island. Uncertainty about these values was modeled using independent beta prior distributions with parameters derived from the modal (most likely) values and 5th or 95th percentiles using the BetaBuster c software program. For example, the most likely value for IFC Sp was considered to be 98% and expert opinion was 95% certain that the value was greater than 95%, corresponding to beta (151.8, 4.08) distribution. Convergence of posterior iterates was assessed in WinBUGS by examining history plots and by specifying 3 sets of initial values and examining the Brooks–Gelman–Rubin plots and convergence statistic. Sensitivity analyses were conducted to assess the influence of the prior distributions on parameter estimates: a Uniform (0, 1) prior was used for the median herd-level prevalence and test Se, optimistic and pessimistic priors for test accuracy, and the prior estimate for the median within-herd prevalence was moved from 30% to 10%. Details of the model structure and the prior information are contained in the supplementary material to this article.
Data was available for 757 paired samples. Overall, 57 fecal samples (2 from the North Island and 55 from the South Island) were culture positive, and 53 serum samples (16 from the North Island and 37 from the South Island) were Paralisa positive. The herd-level results are summarized in Figure 1. The number of culture-positive samples in each herd ranged from 0 to 17, while the number of Paralisa positives ranged from 0 to 7. In samples (n = 259) originating from the 13 herds reporting at least 1 suspected or confirmed case of clinical Johne’s disease in 2006–2008, there were 23 IFC and 25 Paralisa positives. There were 34 IFC and 28 Paralisa positives in samples (n = 498) from the 25 herds that did not report suspicion or confirmation of clinical disease.
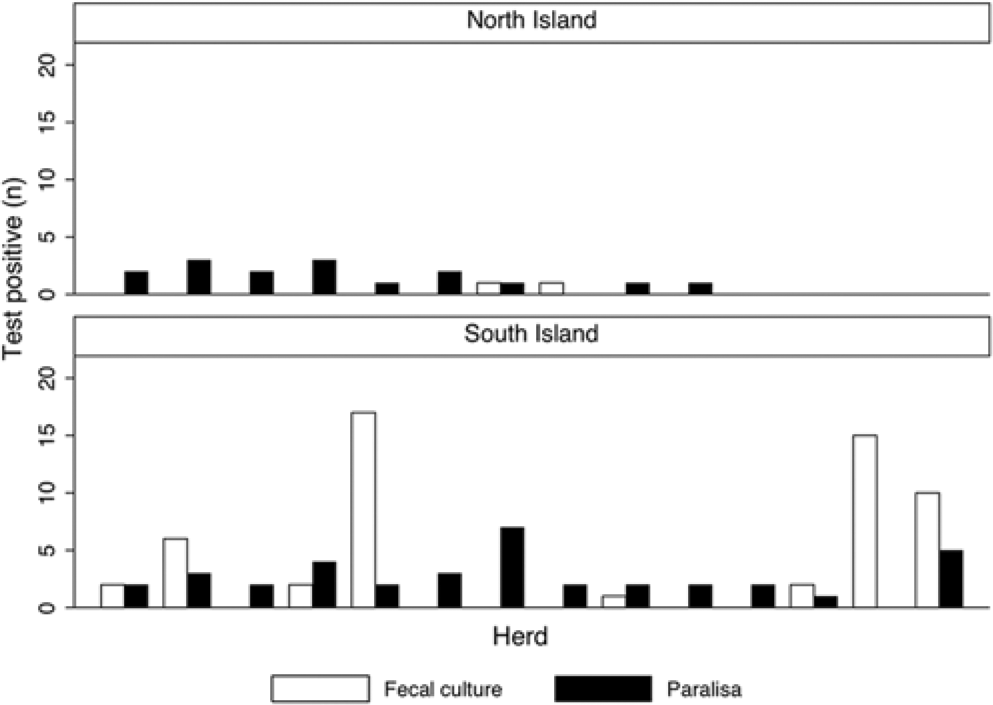
Number of fecal culture– and Paralisa-positive young deer in each of 10 and 14 herds with positive test results sampled in the North and South Islands of New Zealand, respectively.
Prior and posterior distributions are illustrated in Figure 2. The Se of fecal culture to identify young deer infected with Map was estimated at 77% (95% credible interval [CI] = 61–92%), with Sp of 99% (95% CI = 98–99.7%). The Paralisa Se estimate was 19% (95% CI = 10–30%), with Sp of 94% (95% CI = 93–96%). Although prevalence estimation was not the aim of the current study, model estimates of the median herd level prevalence of Map-infected herds in the North and South Islands were 10% (95% CI = 1–38%) and 57% (95% CI = 32–84%), respectively. The median within-herd infection prevalence was estimated at 21% (95% CI = 2–77%).
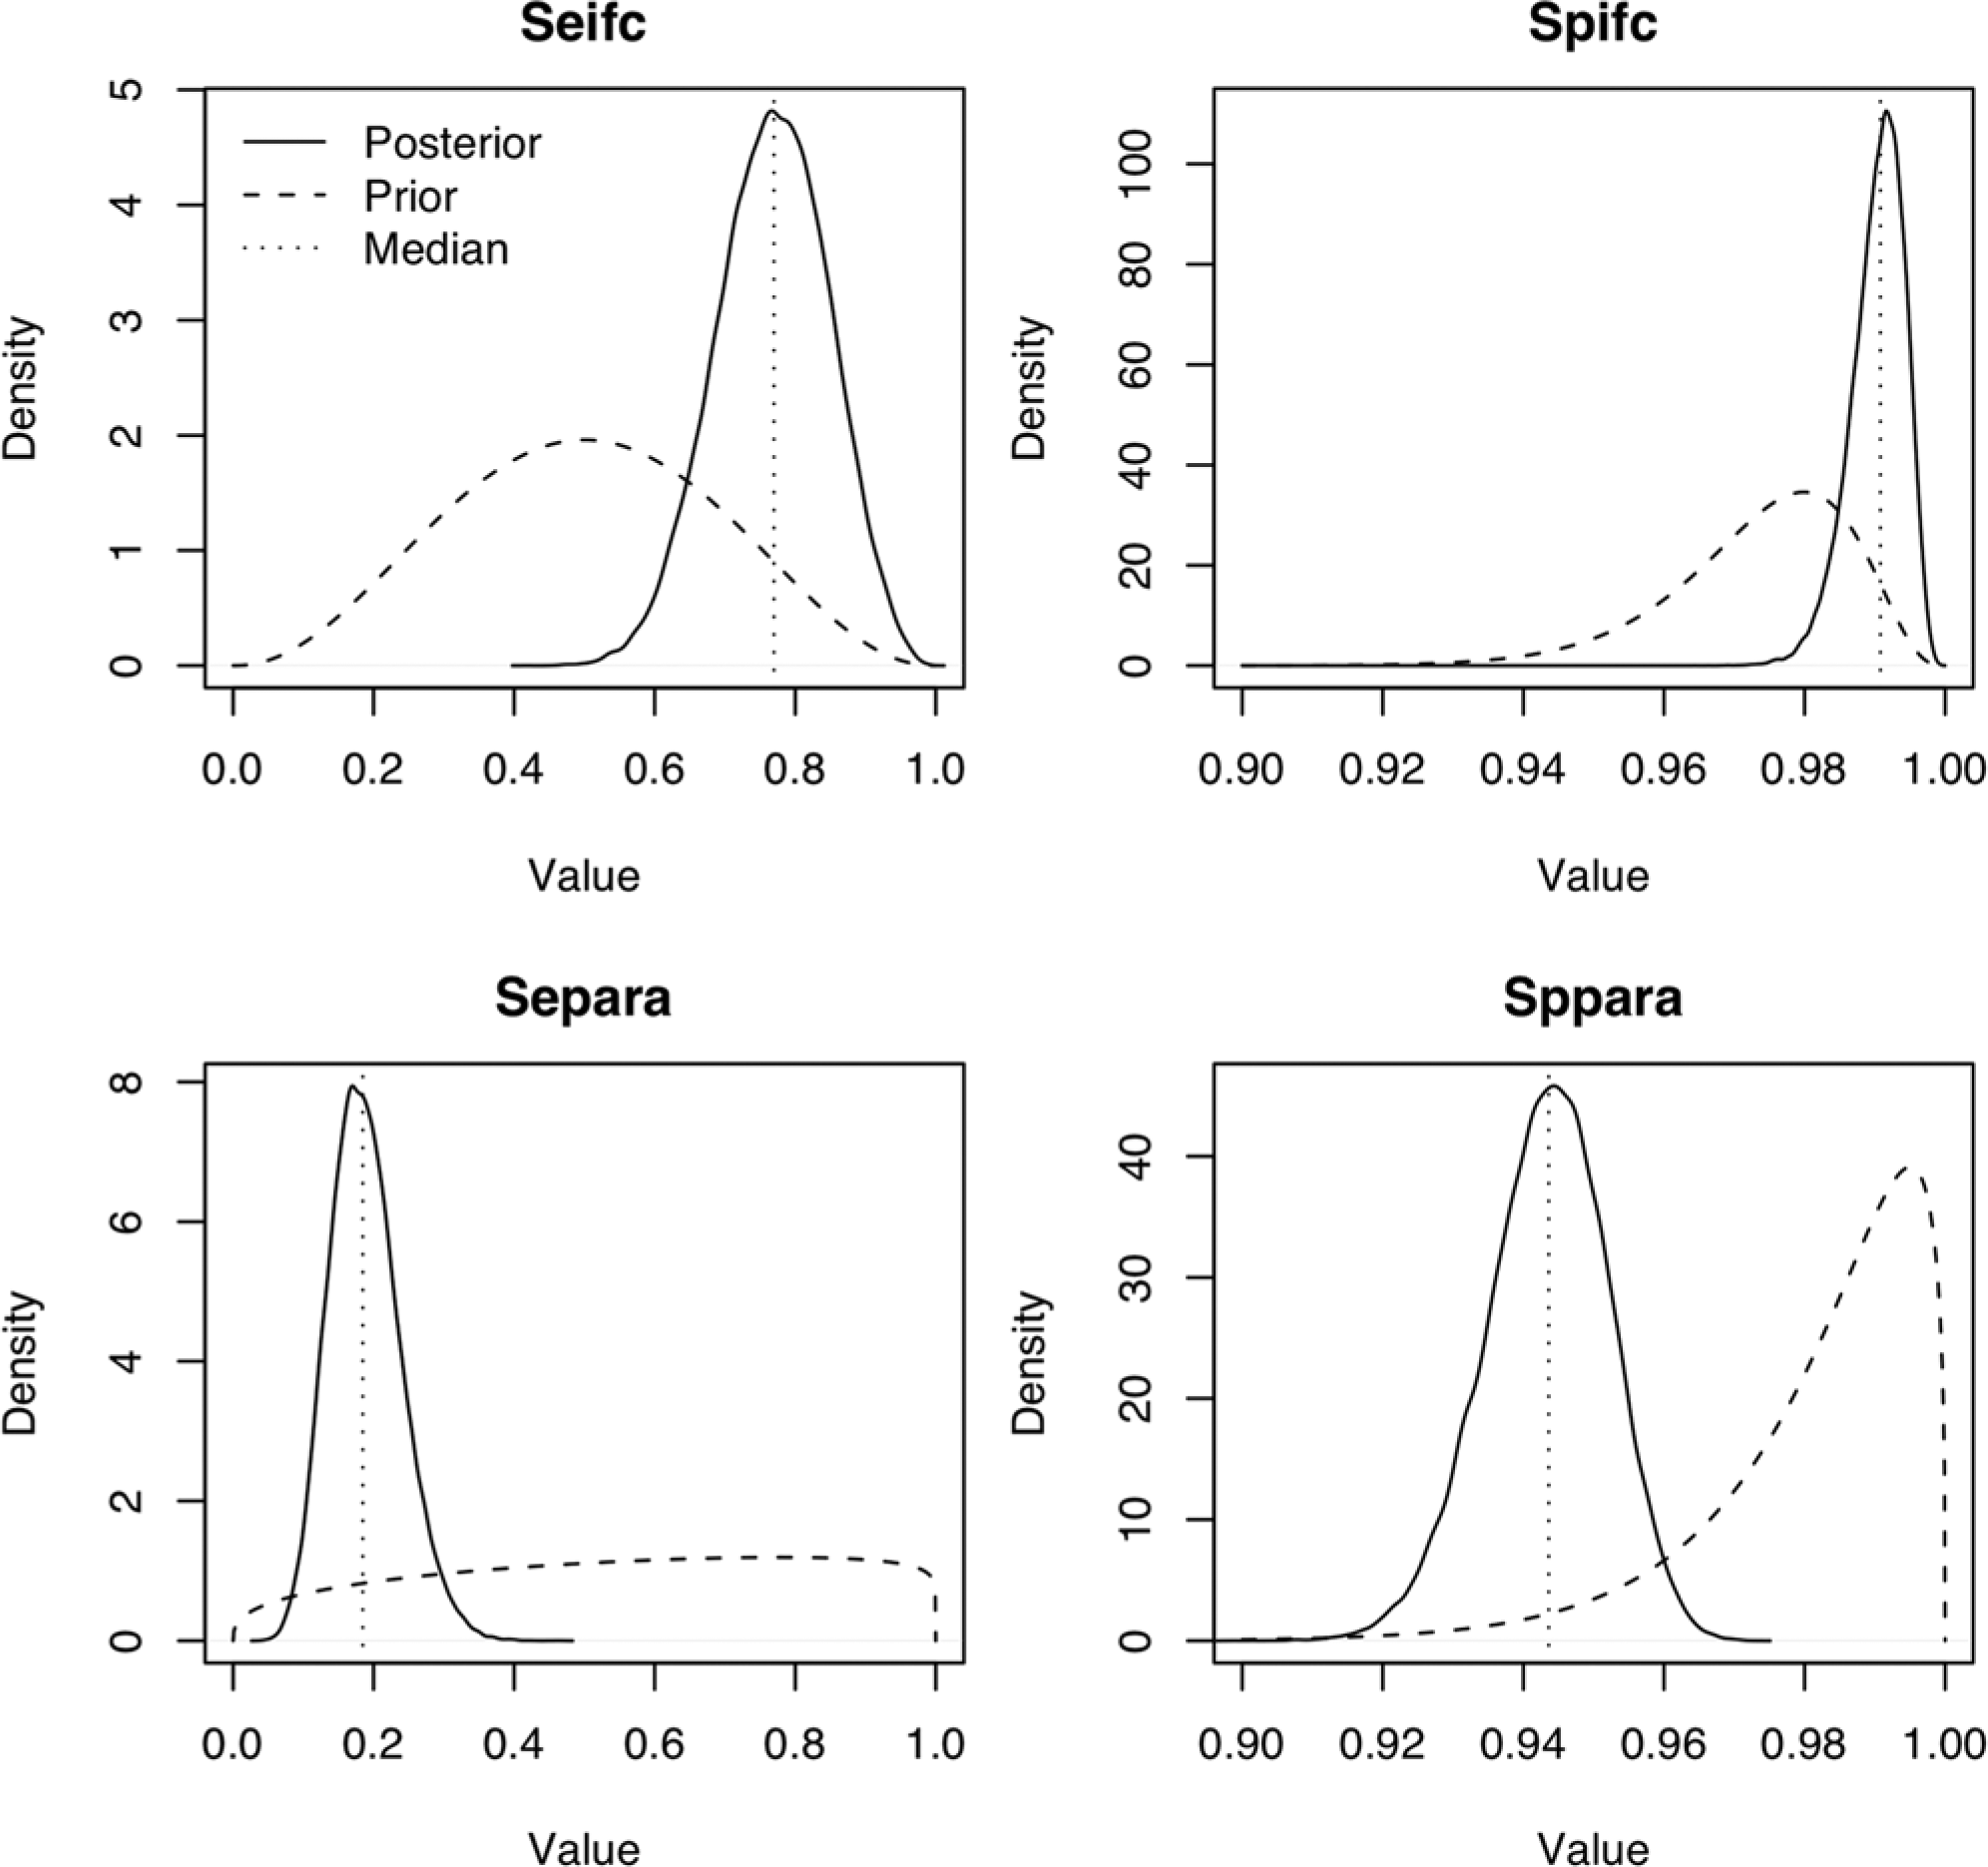
Prior (dashed lines) and posterior distributions (solid lines), and posterior median values (vertical dotted lines) of sensitivity (Se) and specificity (Sp) of individual fecal culture (ifc) and Paralisa (para) from Bayesian latent class analysis.
Applying weakly informative priors for herd Map prevalence and test Se, or more pessimistic priors for test Sp, did not substantially affect the posterior median values of test Se or Sp. Amending the test Se priors influenced the median of the posterior distributions of the amended parameter, although the change (6%) was small in relation to the credible interval around the point estimate. In1 herd, 15 fecal samples were IFC positive, but all serum samples were Paralisa negative. The model was run excluding all data from this herd to assess the influence on the posterior values of the parameter estimates. The Paralisa Se estimate increased to 27% with a wider credible interval (15–41%), while estimates remained similar for all other parameters. Using a prior estimate of 10% for the median within-herd prevalence did not affect any of the posterior values.
Selection of the Bayesian latent class method for test evaluation in the present study was not solely related to the lack of a gold standard test for Map infection in the live animal. The method is less prone to bias introduced by a reference test, and has the advantage of a reduced requirement for a large sample size. 1 While the Sp of culture methods to identify the presence of Map is considered by some to approach 100%, 6 it is thought that animals may ingest Map, which is then detectable in feces, despite the animal not being infected, referred to as passive shedding. The frequency of occurrence and the relevance of this in disease transmission have not been established in deer. It is difficult to know with certainty that fecal culture–positive animals are not infected, given the lack of absolute Se of tissue culture, polymerase chain reaction, and histology methods. If passive shedding does occur, the Sp of IFC to classify deer as infected will be less than 100%. The distinction is not an important one when herd infection status is the ultimate aim of testing, as is the primary test purpose in the current study. However, it may be relevant when the test purpose is animal-level infection prevalence estimation, so the prior value used for Sp of fecal culture was 98%, and a more pessimistic lower bound of IFC Sp was modeled during sensitivity analysis. Increasing or decreasing the prior value for Sp IFC did not substantially affect the posterior distributions for the test parameters. It is thus reasonable to use the summary values reported herein as test accuracy for prevalence estimation.
It is possible that the test sensitivities are not constant between herds, perhaps varying with stage of infection. The distribution of stages of infection within a herd may, in turn, be related to the prevalence of infection. Note, however, that the same distribution of within-herd prevalences on both islands is assumed, but with proportionally more infected herds in the South Island. It is reasonable to assume the same distributions of stages of infection in infected herds, and so the assumption that average Se is the same on both islands is scientifically justified. However, it is recognized that if there is a difference in test performance between the 2 main populations, in this case the North and South Islands of New Zealand, there may be a corresponding effect on the estimates of test Se and Sp. The Se estimate may be biased toward the population with highest disease prevalence, because most of the data supports that estimate. 15 It is therefore possible that the Se of the tests has been overestimated, as the majority of the data on test-positive animals (92/110) originated from South Island herds.
The effect of herd-level factors on test Se and Sp may also explain the herd-level results (Fig. 1). For example, in some herds there are multiple Paralisa-positive and no IFC-positive samples. Such results may arise in an infected herd due to low IFC Se in comparison to Paralisa, or in an uninfected herd due to low Paralisa Sp. It is thus important, when applying the results from the current study, to consider the credible intervals rather than simply the point estimates of test performance. When designing a herd classification scheme, it would be prudent to use the lower bounds of the credible intervals for test Se for sample size calculations, in order to improve the probability of detecting an infected herd.
The source population for the present study was based on response to a postal questionnaire and active participation in a nationwide on-farm sampling survey for paratuberculosis and leptospirosis. The resulting sampling frame can introduce bias, as farmers with experience of these diseases may be more likely to respond, and thus animals may be less representative of the target population. However, the postal survey participants may have responded due to an interest in either leptospirosis or paratuberculosis because the survey related to both diseases, hence lowering the risk that there was bias in response due solely to experience of paratuberculosis.
The estimate for the Se of the Paralisa reported herein was lower than the estimate of 77% previously reported in subclinically infected deer. 3 However, the previous study 3 was carried out in herds with clinical infection, in older animals, and in the context of a test-and-cull control program. Sensitivity of ELISAs for paratuberculosis is related to the stage of infection, being higher in high fecal Map shedders. 17 Test Se in heavily infected and diseased herds is plausibly higher, as such herds are likely to have a higher proportion of animals in more advanced stages of infection, and thus higher levels of circulating antibody, than herds with no clinical disease. A published 12 Se of 62% and Sp of 70% for the Paralisa to detect animals shedding Map at a threshold of ≥102 organisms/g further highlights the importance of considering the target condition when carrying out test evaluation. Indeed, the application of control programs themselves may affect test performance. For example, the removal of test-positive animals may increase Sp by removing both infected animals and false positives from the population. As test validation should consider the target condition, test purpose, and the distribution of covariates that may influence performance in the population in which the test will be applied, 2 direct comparison of estimates of Se presented herein with those previously reported is difficult.
In an Australian study, a deer-conjugate ELISA had a Se of 33% in subclinically infected deer, when compared with mesenteric lymph node tissue culture as a gold standard, using a cut-point giving a Sp of 99.5% (Schroen C, Bradley T, McDonald W, Condron R: 2003, Diagnostic tests for Johne’s disease in deer. Australian Government, Rural Industries Research and Development Corp. Available at: https://rirdc.infoservices.com.au/downloads/03-100). In contrast, the Se and Sp estimates obtained in the current study are more comparable to the range of values for ELISA in the same target condition (infection) in cattle, as reported in a review 10 (i.e., Se 7–22%, Sp 85–100%).
The Se estimate for individual fecal culture (77%) appears high but is plausible, although no similar data is available for comparison. Quantitative studies have demonstrated shedding of Map in deer feces at greater than 108 organisms/g. 12 Fecal samples from clinically normal 11-month-old deer tested with IFC in a study 14 found animal-level apparent prevalence of up to 80% in herds where there was clinical disease. Although a number of studies11,16 have used latent class methods to estimate Se of IFC in cattle, finding values ranging from 40% to 75%, the only study of IFC performance in deer reported a Se of 67.5% (Schroen C, et al.: 2003, Diagnostic tests for Johne’s disease in deer).
Clinical disease is seen in yearling deer more frequently in winter and spring and, as Se of both tests is related to disease severity, season may have an influence on the resulting estimates. In yearling deer, it is difficult to separate the effects of herd, age, and season to examine seasonal effects on test performance. The sampling period of the current study covered all seasons and ages of deer from 12 to 24 months, thus had the advantage that average values for test performance in yearling deer were obtained.
The hypothesis that there is an effect of strain type on Map pathogenicity in deer is supported by evidence from experimental infection studies, in which a type I (ovine) Map isolate used was found to be less pathogenic in young deer than a type II isolate. 9 It is plausible that there could be a corresponding effect of Map type on test Se. The Paralisa was developed using samples from clinically affected herds, in which type II isolates may be more prevalent. The Map pathogenicity study found 1 of 11 (9%) of the subclinically infected deer challenged with a medium dose (107 colony-forming units) of the type I isolate were Paralisa positive compared with 5 of 16 (31%) of those challenged with the same dose of a type II isolate. Investigation of the effect of strain type on test performance would therefore be a useful enhancement to the present study.
In summary, the current study has estimated the Se and Sp of Paralisa and IFC to identify yearling deer subclinically infected with Map. The estimates should be considered in the context of their application to the target population (yearling deer), target condition (subclinical infection), and purpose of the test (demonstrating freedom from infection in a defined population) and are relevant to developing herd classification programs and in monitoring the effects of control interventions in New Zealand farmed deer herds.
Footnotes
Acknowledgements
The authors would like to thank the deer property owners and managers and veterinary practitioners involved in supplying and collecting data and samples for this study. The authors are grateful to the large number of students who assisted with sample processing and to Raewynne Pearson, Saskia Prickaerts, and Neville Hack for setting up and managing sample handling. Staff at the Disease Research Laboratory, University of Otago, Dunedin, New Zealand, and at AgResearch, Centre for Biosecurity and Infectious Disease, Wallaceville, Upper Hutt, New Zealand, carried out diagnostic testing and special thanks go to Simon Liggett and Gary Yates for practical advice and unfailing professionalism. The authors thank Frank Griffin and Geoff de Lisle for comments during the design phase of the study and for critique of the study results. Particular appreciation goes to Colin Mackintosh of AgResearch, whose assistance during the design phase of the study was invaluable, and whose extensive detailed critiques of the results led to a much-improved article. The authors are grateful to the New Zealand Johne’s Disease Research Consortium for coordinating reviews from the individuals mentioned, from the Johne’s Disease Research Consortium Science advisory group, and from external independent reviewers Drs. Mark Bronsvoort and Ian Handel of the Roslin Institute. Acknowledgements go also to the authors of the STRADAS-paratb guidelines, 2 which were used in preparation of the article.
a.
Disease Research Laboratory, Department of Microbiology and Immunology, University of Otago, Dunedin, New Zealand.
b.
BACTEC 12B, Vacutainer; BD, Franklin Lakes, NJ.
Declaration of conflicting interests
The author(s) declared no potential conflicts of interest with respect to the research, authorship, and/or publication of this article.
Funding
The author(s) disclosed receipt of the following financial support for the research, authorship, and/or publication of this article: The study was funded by DeerResearch through the New Zealand Johnes Disease Research Consortium.
References
Supplementary Material
Please find the following supplemental material available below.
For Open Access articles published under a Creative Commons License, all supplemental material carries the same license as the article it is associated with.
For non-Open Access articles published, all supplemental material carries a non-exclusive license, and permission requests for re-use of supplemental material or any part of supplemental material shall be sent directly to the copyright owner as specified in the copyright notice associated with the article.