
Abstract
Measurement of serum immunoglobulin G (IgG) is used for the assessment of passive transfer of immunity in neonatal crias, with an IgG concentration <10 g/l being suggestive of failure of passive transfer (FPT). The purpose of the current study was to determine whether 3 commercially available immunologic assays yielded comparable results for IgG in alpacas. Serum samples from 91 alpacas were used and were stored frozen until batch analysis on the same day with the 3 assays. Immunoglobulin G was measured by radial immunodiffusion (RID) and 2 immunoturbidimetric (IT) assays (IT1, configured for automated chemistry analyzers; IT2, a point-of-care test). Median IgG concentrations were significantly different between the 3 assays, with the RID (median: 15 g/l) and IT1 (median: 16 g/l) assays, which used the same standard, yielding significantly higher IgG values than IT2 (median: 11 g/l). Results indicated a diagnostic discordance in 1–17% of samples at an IgG threshold of 10 g/l. Protein electrophoresis revealed that the RID and IT1 standard contained mostly albumin (>60%), whereas the IT2 standard consisted of beta and gamma globulins. The discrepant results between assays IT1 and IT2 were eliminated when the same standard was used (IT1: median 11 g/l; IT2: 10 g/l; n = 19 and 17, respectively). The IT1 assay had the highest precision, while the RID assay had the lowest. The results indicate that camelid IgG measurement is highly dependent on the assay standard and is not directly comparable between assays, potentially resulting in underdiagnosis of FPT in some crias.
Introduction
Failure of passive transfer (FPT) of maternal immunoglobulins is associated with the development of infections, including septicemia, diarrhea, arthritis, omphalitis, meningitis, and pneumonia, in neonatal camelids.1,5,7,9,17 Early recognition of FPT in camelids is therefore an integral part of most camelid husbandry programs and aids in minimizing cria morbidity and mortality rates. 7 The estimated rates of FPT in neonatal camelids are 21% and 9% in the United States and Peru, respectively.9,16
Failure of passive transfer of immunity is usually diagnosed by direct measurement of serum immunoglobulin G (IgG) concentrations using immunologic-based methods, with concentrations >10 g/l indicating adequate passive transfer of immunity in camelids. 9 Various techniques have been investigated as surrogates for IgG testing in camelids, including gamma-glutamyl transferase, total solids, total protein, total globulin, and the sodium sulfite turbidity test.6,11,12,15,16 The historical “gold standard” method for IgG measurement is radial immunodiffusion (RID); however, a previous study showed that there was a substantial lack of agreement between 2 commercially available RID kits used for IgG measurement in camelids, which could result in misdiagnosis of FPT in crias. 11 The lack of concordance between kits was attributed to differences in the immunoglobulin content of the standards used with each kit. Only 1 of the latter 2 RID kits described in the previous study 11 is still commercially available; however, there are currently 2 new immunoturbidimetric (IT) assays for the measurement of camelid IgG. One of the IT assays is designed for use on automated chemistry analyzers and the other is a less automated test, targeted for point-of-care testing. Anecdotal reports suggest that IgG concentrations from the currently available RID kit and these 2 IT assays are not always in agreement.
The objectives of the present prospective study were to 1) assess the diagnostic agreement between 3 commercially available camelid IgG assays, and 2) measure the precision of the assays. It was hypothesized that the IgG concentrations would be in agreement if the same standard was used to calibrate the tests and that the IT assays would be more precise than the RID assay.
Materials and methods
Serum samples for the current study were obtained from 2 sources. The first source included samples submitted to the Clinical Pathology Laboratory at Cornell University (Ithaca, New York) for IgG testing through the New York State Diagnostic Laboratory and Cornell University Farm Animal Hospital. The second source included samples obtained by 2 of the authors (JA Appleton and SR Purdy) as part of another research project.
All samples were frozen at −70°C for 1–12 months before analysis. Samples were thawed at room temperature (18–20°C) for IgG analysis, and all assays were performed on the same day for each sample. Immunoglobulin G was measured by single RID, a per the manufacturer’s instructions. Each RID plate consists of agarose containing anticamelid IgG. The width of the precipitin ring (formed from serum IgG in the patient sample reaching equilibrium with the anti-IgG antibody embedded in the agarose) is measured visually with a ruler to the nearest 0.1 mm approximately 16 hr after sample application. A standard curve of log IgG concentration of 3 provided standards (2.1, 14.9, and 23.9 g/l) versus width of the precipitin ring is generated for each plate on semilog paper, with sample results being read manually from the curve. Samples with initial results above the highest standard were diluted, whereas those samples with results below the lower standard were standardized to 2.0 g/l. Two IT methods were used. The first IT method (IT1) was performed on an automated chemistry analyzer. b The assay uses a goat polyclonal antibody against llama IgG c and the same 3 IgG standards supplied by the manufacturer of the RID assay (2.1, 14.9, and 23.9 g/l). The assay is an endpoint reaction, with the change in turbidity measured at an optical density of 700 nm, after an incubation time of 10 min. The reported linearity is 3–29 g/l; samples with results higher than the upper linearity limit were diluted. An IgG control (camelid serum) is provided with the assay. The second IT method (IT2 d ) consists of a small portable spectrophotometer and uses a goat polyclonal antibody against llama IgG, with the change in turbidity read at an optical density of 525 nm and compared to a preexisting standard curve generated by serial dilution of the manufacturer’s single llama IgG standard. The IT2 assay requires the following manual procedures: pipetting of small sample volumes (10 µl) into prefilled reagent or blank tubes, mixing the tubes by inversion, 10-min incubation at room temperature, serial insertion of blank and reagent tube into the reader when prompted, and conversion using a provided chart based on the preexisting standard curve. An IgG control (llama serum) is provided with the assay. The reported linearity is 0–30 g/l; samples were not diluted if they were higher than the upper linearity limit but were standardized to 30 g/l.
For precision studies, serum samples of low, medium, and high IgG concentrations (generated by pooling alpaca serum with similar concentrations) were analyzed 10 times within 1 run (or on 1 RID plate) for determination of intra-assay coefficient of variation and on 4 (for the RID assay) or 5 (for the IT assays) different days for determination of the interassay coefficient of variation. A single medical technologist performed precision studies on the RID and IT2 assays, whereas 2 medical technologists performed the precision studies on the IT1 assay.
Agarose gel protein electrophoresis e was performed on the standard of the RID and IT1 assays, and the IT2 assay. The manufacturer’s kit uses a Tris-based sodium barbital MOPS buffer, a run time of 5 min and 45 sec at 400 volts, and acid-blue staining. Cutoffs of the different protein fractions were based on a previous study using this technique in alpaca serum. 4
Data distribution was nonparametric with a Shapiro–Wilk test. f Median results for the 3 assays were compared with a Friedman test for paired samples, followed by a Dunn post hoc multiple comparison test. f Bland–Altman bias plots were used to analyze the difference between samples compared with the mean of samples and to obtain the median difference and range of differences between results. g Correlations between test results were compared with a Spearman rank correlation test. f A Passing–Bablok linear regression analysis was performed on log-transformed data to determine agreement between the assays. g Log transformation of the data was necessary to eliminate substantial variability in the residuals across the testing range with nontransformed data. Diagnostic concordance between assays at a medical decision limit of 10 g/l 9 was examined with a kappa coefficient, h with values >0.8 regarded as excellent, 0.6–0.8 as good, 0.4–0.6 as moderate, and <0.4 as poor concordance, respectively. 14 The proportion of animals with discordant results (i.e., ≥10 g/l with 1 assay but <10 g/l with another assay) was also calculated and compared between assays using a Fisher exact test, f with a Bonferroni adjustment for the number of pairwise comparisons. A p value of <0.05 was considered significant.
Results
Serum samples from 91 alpacas were analyzed for IgG concentration using all 3 assays. The study group included 70 crias with a median age of 2 days (range: 1–21 days), 4 adult alpacas with a median age of 8 years (range: 2–17 years), and 21 alpacas of unknown age. The gender distribution included 47 female alpacas, 35 male alpacas, and 9 alpacas of unknown gender. Median IgG concentrations were significantly different between the 3 assays (p < 0.001; Table 1). There was a significant and high correlation between assays (Spearman rank correlation coefficients greater than 0.93), however difference plots indicated a constant and proportional negative bias between the IT2 assay and both the RID and the IT1 assays, with the IT2 assay yielding lower values than the other 2 assays (this constant bias was only significant when compared to the RID assay; Table 2, Fig. 1). Significantly lower concentrations were also yielded for the RID assay in comparison to the IT1 assay, which used the same standard, and there was a significant proportional bias between these 2 assays (Table 2, Fig. 1). Diagnostic concordance was good comparing the IT2 assay to the RID and IT1 assays and excellent for the RID and IT1 assays (Table 2). To determine how the assays would impact diagnostic interpretation, the medical decision limit of 10 g/l IgG recommended for the diagnosis of FPT in camelids was examined. It was found that between 1–17% of samples would have been classified differently depending on which assay was used for detection. More samples were discordant comparing the IT2 to the RID (10%) and IT1 (17%) assays versus the RID and IT1 (7%) assays (Fig. 1), although these proportions were not significantly different.
Immunoglobulin G (IgG) concentrations in serum samples from alpacas as measured by radial immunodiffusion (RID) and 2 immunoturbidimetric (IT) assays—an automated assay (IT1) and a point-of-care assay (IT2).
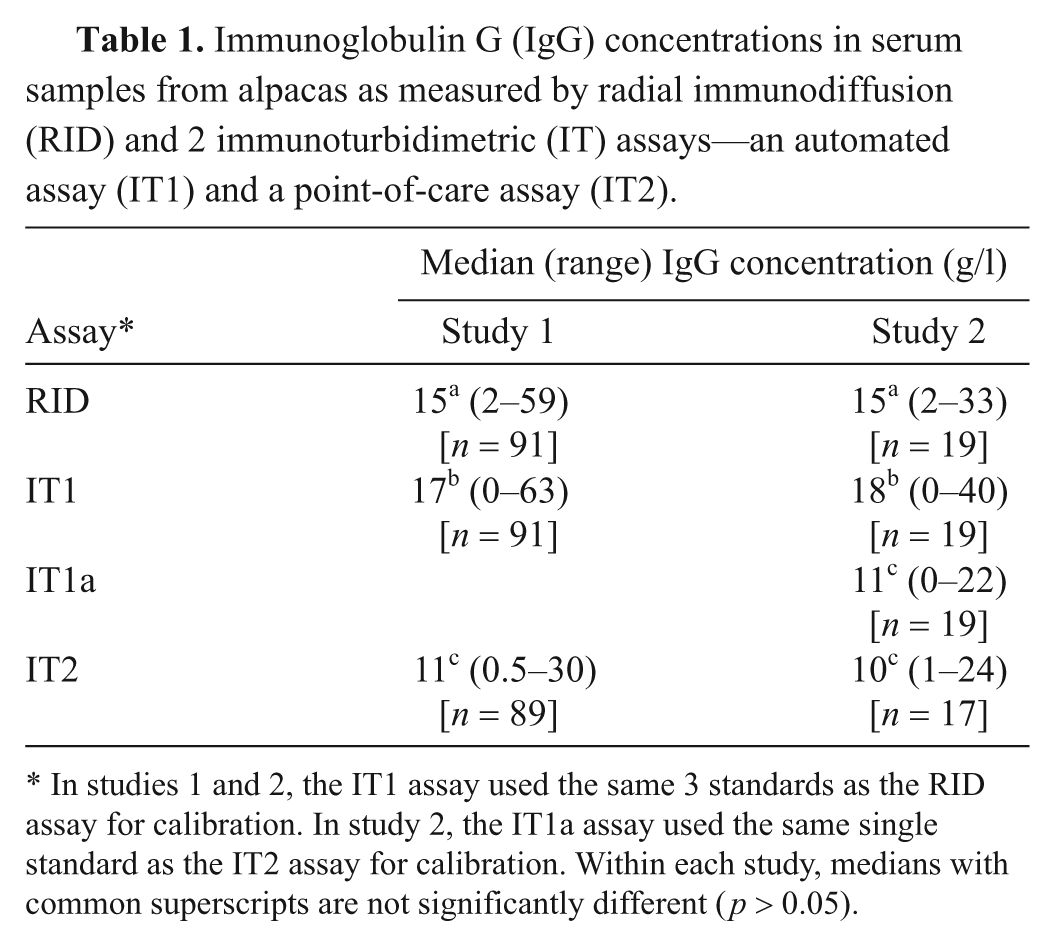
In studies 1 and 2, the IT1 assay used the same 3 standards as the RID assay for calibration. In study 2, the IT1a assay used the same single standard as the IT2 assay for calibration. Within each study, medians with common superscripts are not significantly different (p > 0.05).
Diagnostic concordance (kappa coefficient with 95% confidence intervals [CI]) and point estimates of intercept and slope with 95% CI and significance from Passing–Bablok linear regression equations on log-transformed data comparing immunoglobulin G (IgG) results obtained from the radial immunodiffusion (RID) assay and 2 immunoturbidimetric assays—an automated assay (IT1) and a point-of-care assay (IT2).*
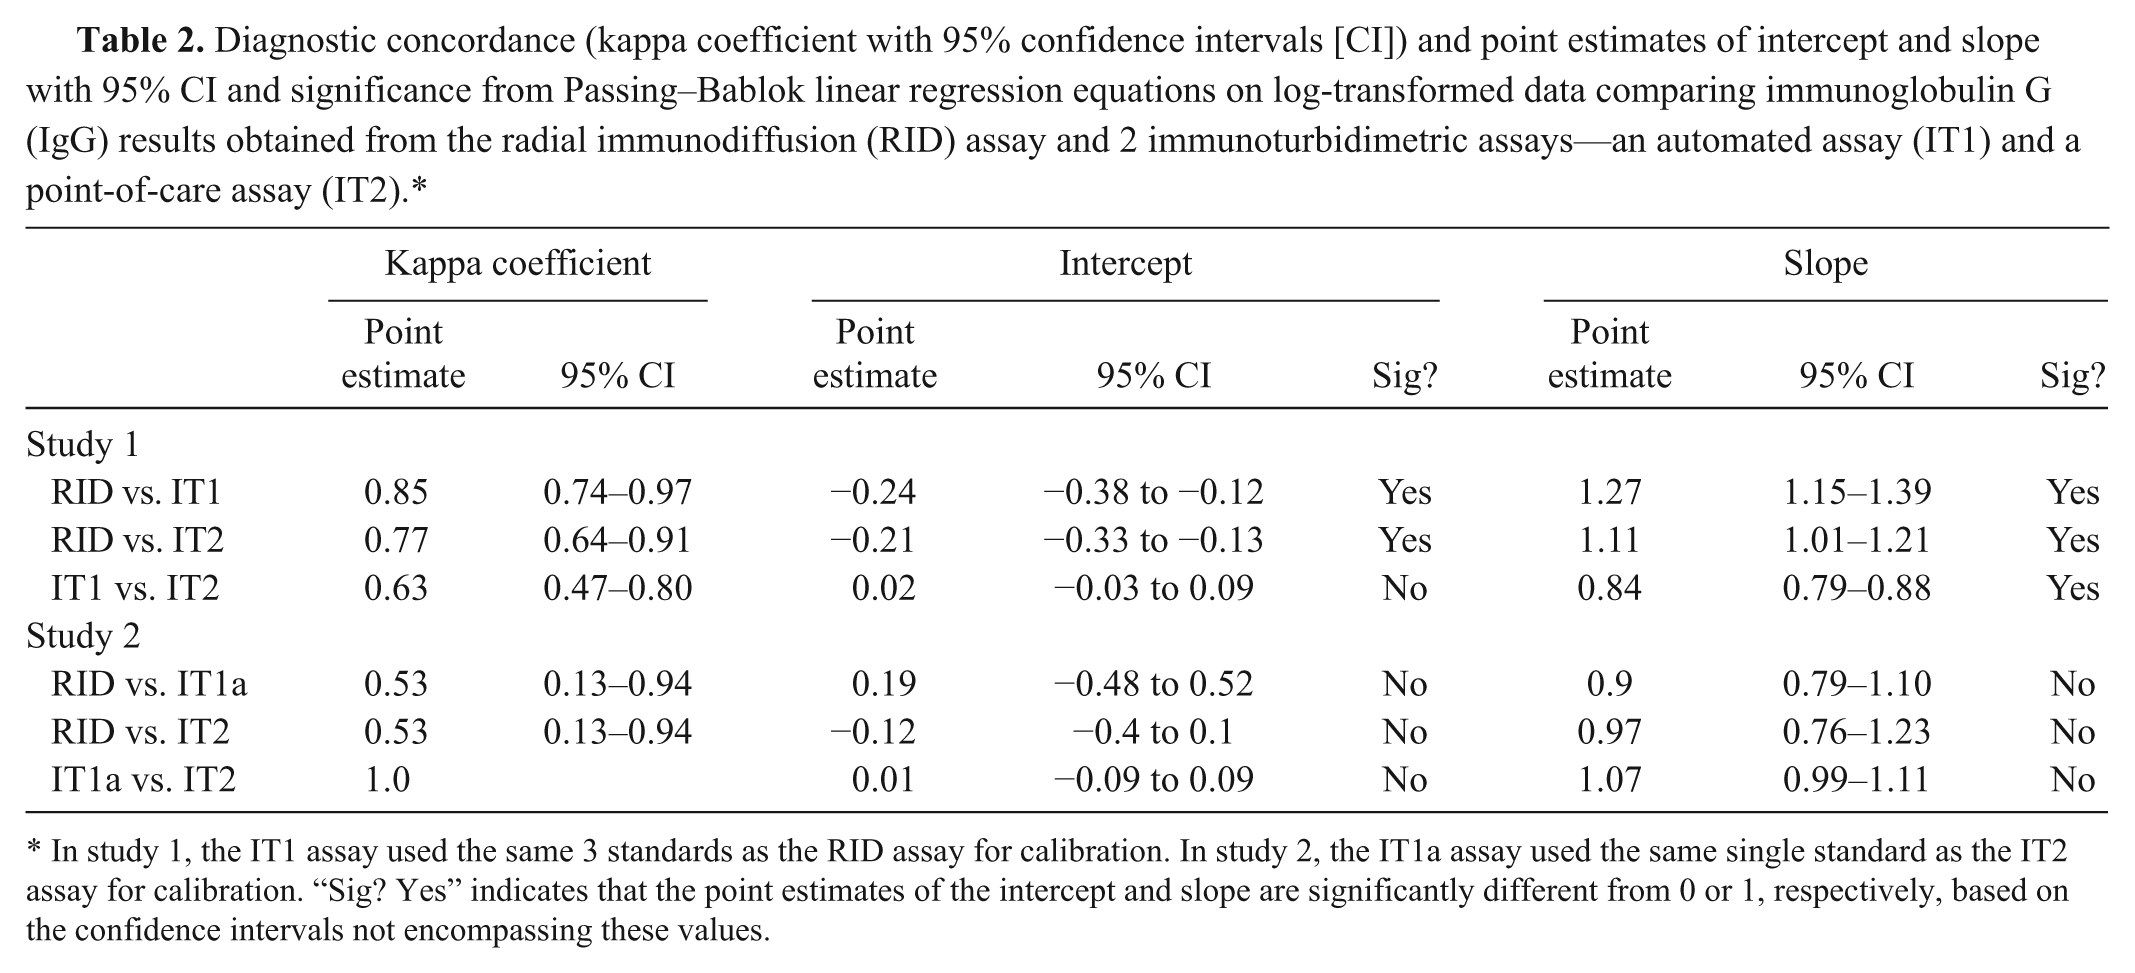
In study 1, the IT1 assay used the same 3 standards as the RID assay for calibration. In study 2, the IT1a assay used the same single standard as the IT2 assay for calibration. “Sig? Yes” indicates that the point estimates of the intercept and slope are significantly different from 0 or 1, respectively, based on the confidence intervals not encompassing these values.
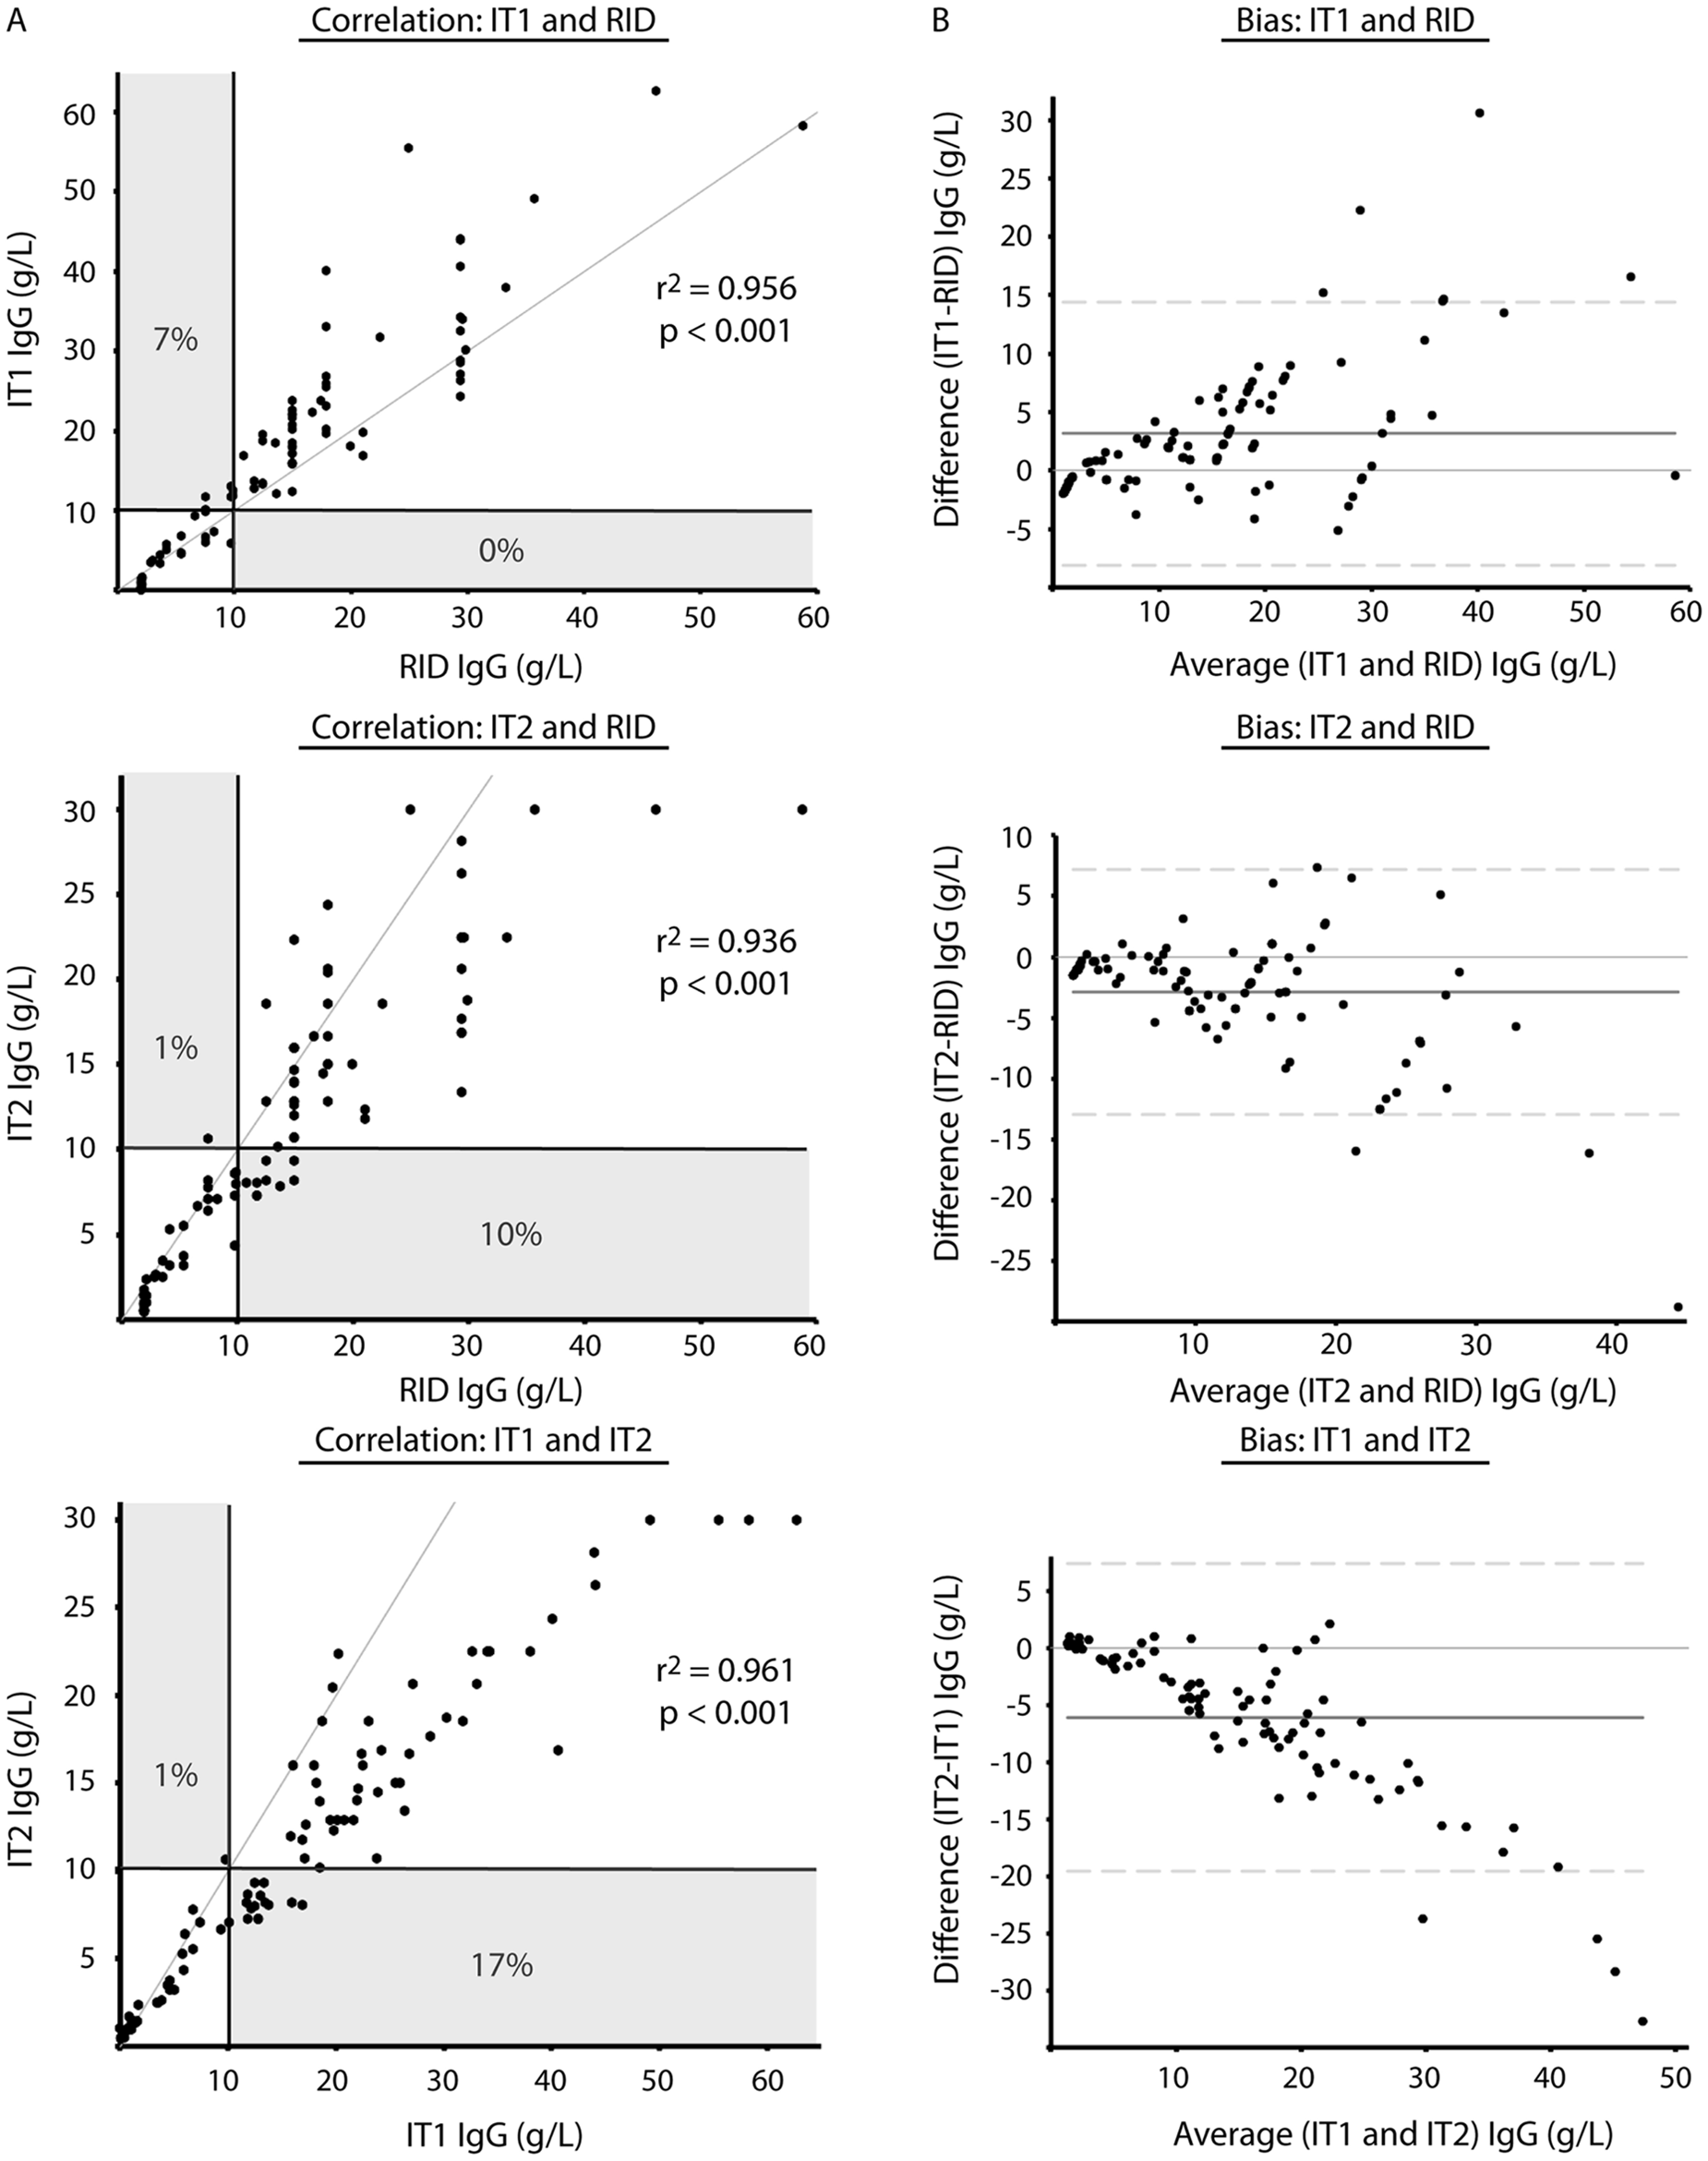
Comparison of radial immunodiffusion (RID, n = 91) and 2 immunoturbidimetric, IT1 (n = 91) and IT2 (n = 89), assays for measurement of serum immunoglobulin (IgG) concentration in camelids using Spearman rank correlation (
It was hypothesized that the lower concordance between the IT2 and RID or IT1 assays was due to the use of different standards. To test this hypothesis, protein electrophoresis was performed on the standards. Protein electrophoresis revealed that the common standard of the RID and IT1 assays contained mostly albumin (>60%), whereas the standard for the IT2 assay consisted mostly of proteins migrating in the β and γ regions of the electrophoretogram (Fig. 2). Then, to test whether the differences in concordance between assays may be attributable to this variation in standard composition, the IT1 standard was replaced with the standard from the IT2 manufacturer in the IT1 assay and the results of all assays were again compared—RID with regular standard, IT1 with regular standard (IT1), IT1 with IT2 standard (IT1a), and IT2 with regular standard—using 19 serum samples that had been frozen and rethawed. Median results from the IT1 assay, after calibration with the IT2 standard (IT1a), were not significantly different from those of the IT2 assay (Table 1), with a median difference between assays (IT2 minus IT1a) of −0.03 (range of differences: –3.1 to 2.0 g/l). However, the median IgG concentration for the IT assay using the IT2 standard was significantly different from both the RID assay and the IT1 assay (using the same standards as the RID assay; Table 1). There was 100% concordance between the results of the 2 IT assays when they used the same standard for calibration, and no discrepant results were obtained at the camelid FPT medical decision limit of 10 g/l (Table 2, Fig. 3). By visual inspection, a constant and proportional bias was still present when the RID and the IT2 assay were compared with this smaller sample set. These biases were also evident when comparing the RID to the IT1a assay, although there were no significant differences in the point estimates of intercept or slopes (likely due to the lower sample numbers; Table 2, Fig. 3). Similarly, the visual constant and proportional biases evident in the larger dataset comparing results of the RID or IT2 assays to the automated IT1 assay (using the same standard as the RID assay) persisted in this smaller sample set (data not shown). The intra-assay coefficients of variation for all assays were low (≤5%); however, only the automated IT assay (IT1 with either standard) maintained similarly low interassay coefficients of variation, with the point-of-care IT2 or the RID assay showing more variability in day-to-day IgG measurement (Table 3).
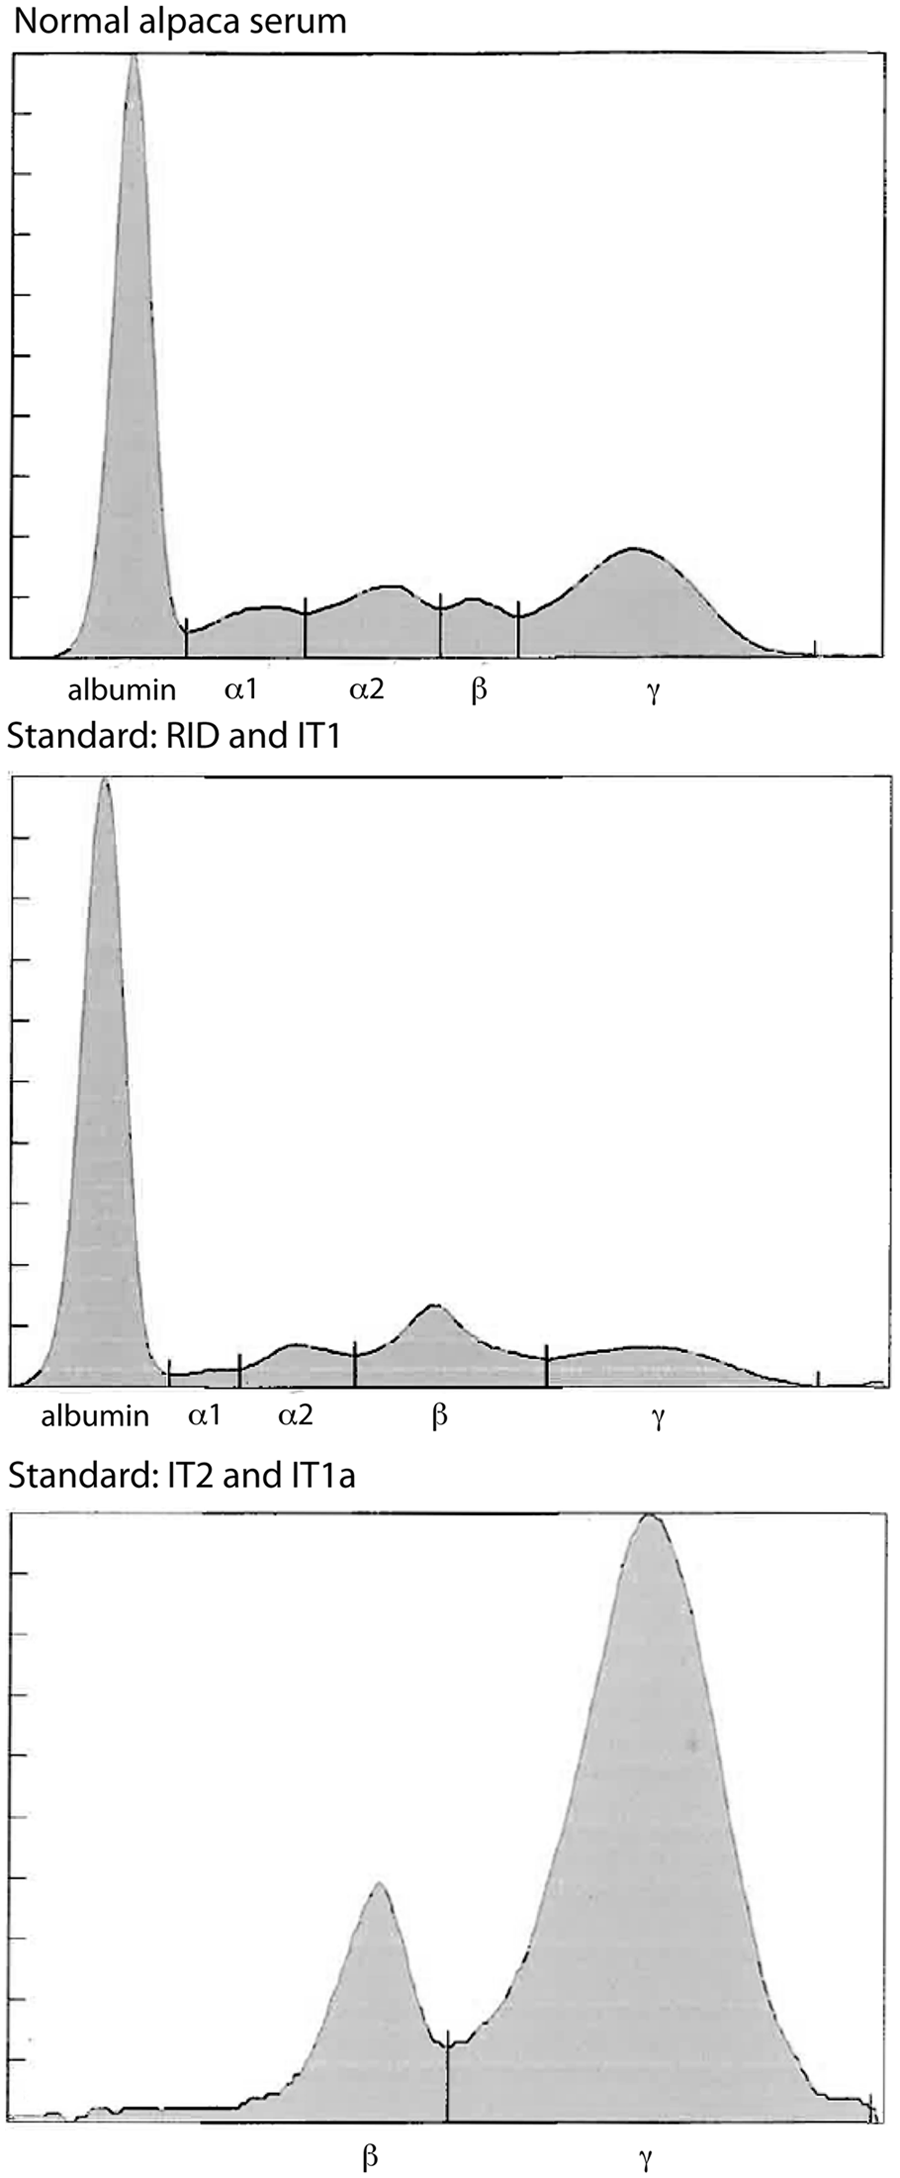
Agarose gel protein electrophoresis results of serum from a clinically healthy alpaca, the standard used with the radial immunodiffusion (RID) and automated immunoturbidimetric (IT1) assays, and the standard used to calibrate the point-of-care IT2 assay.
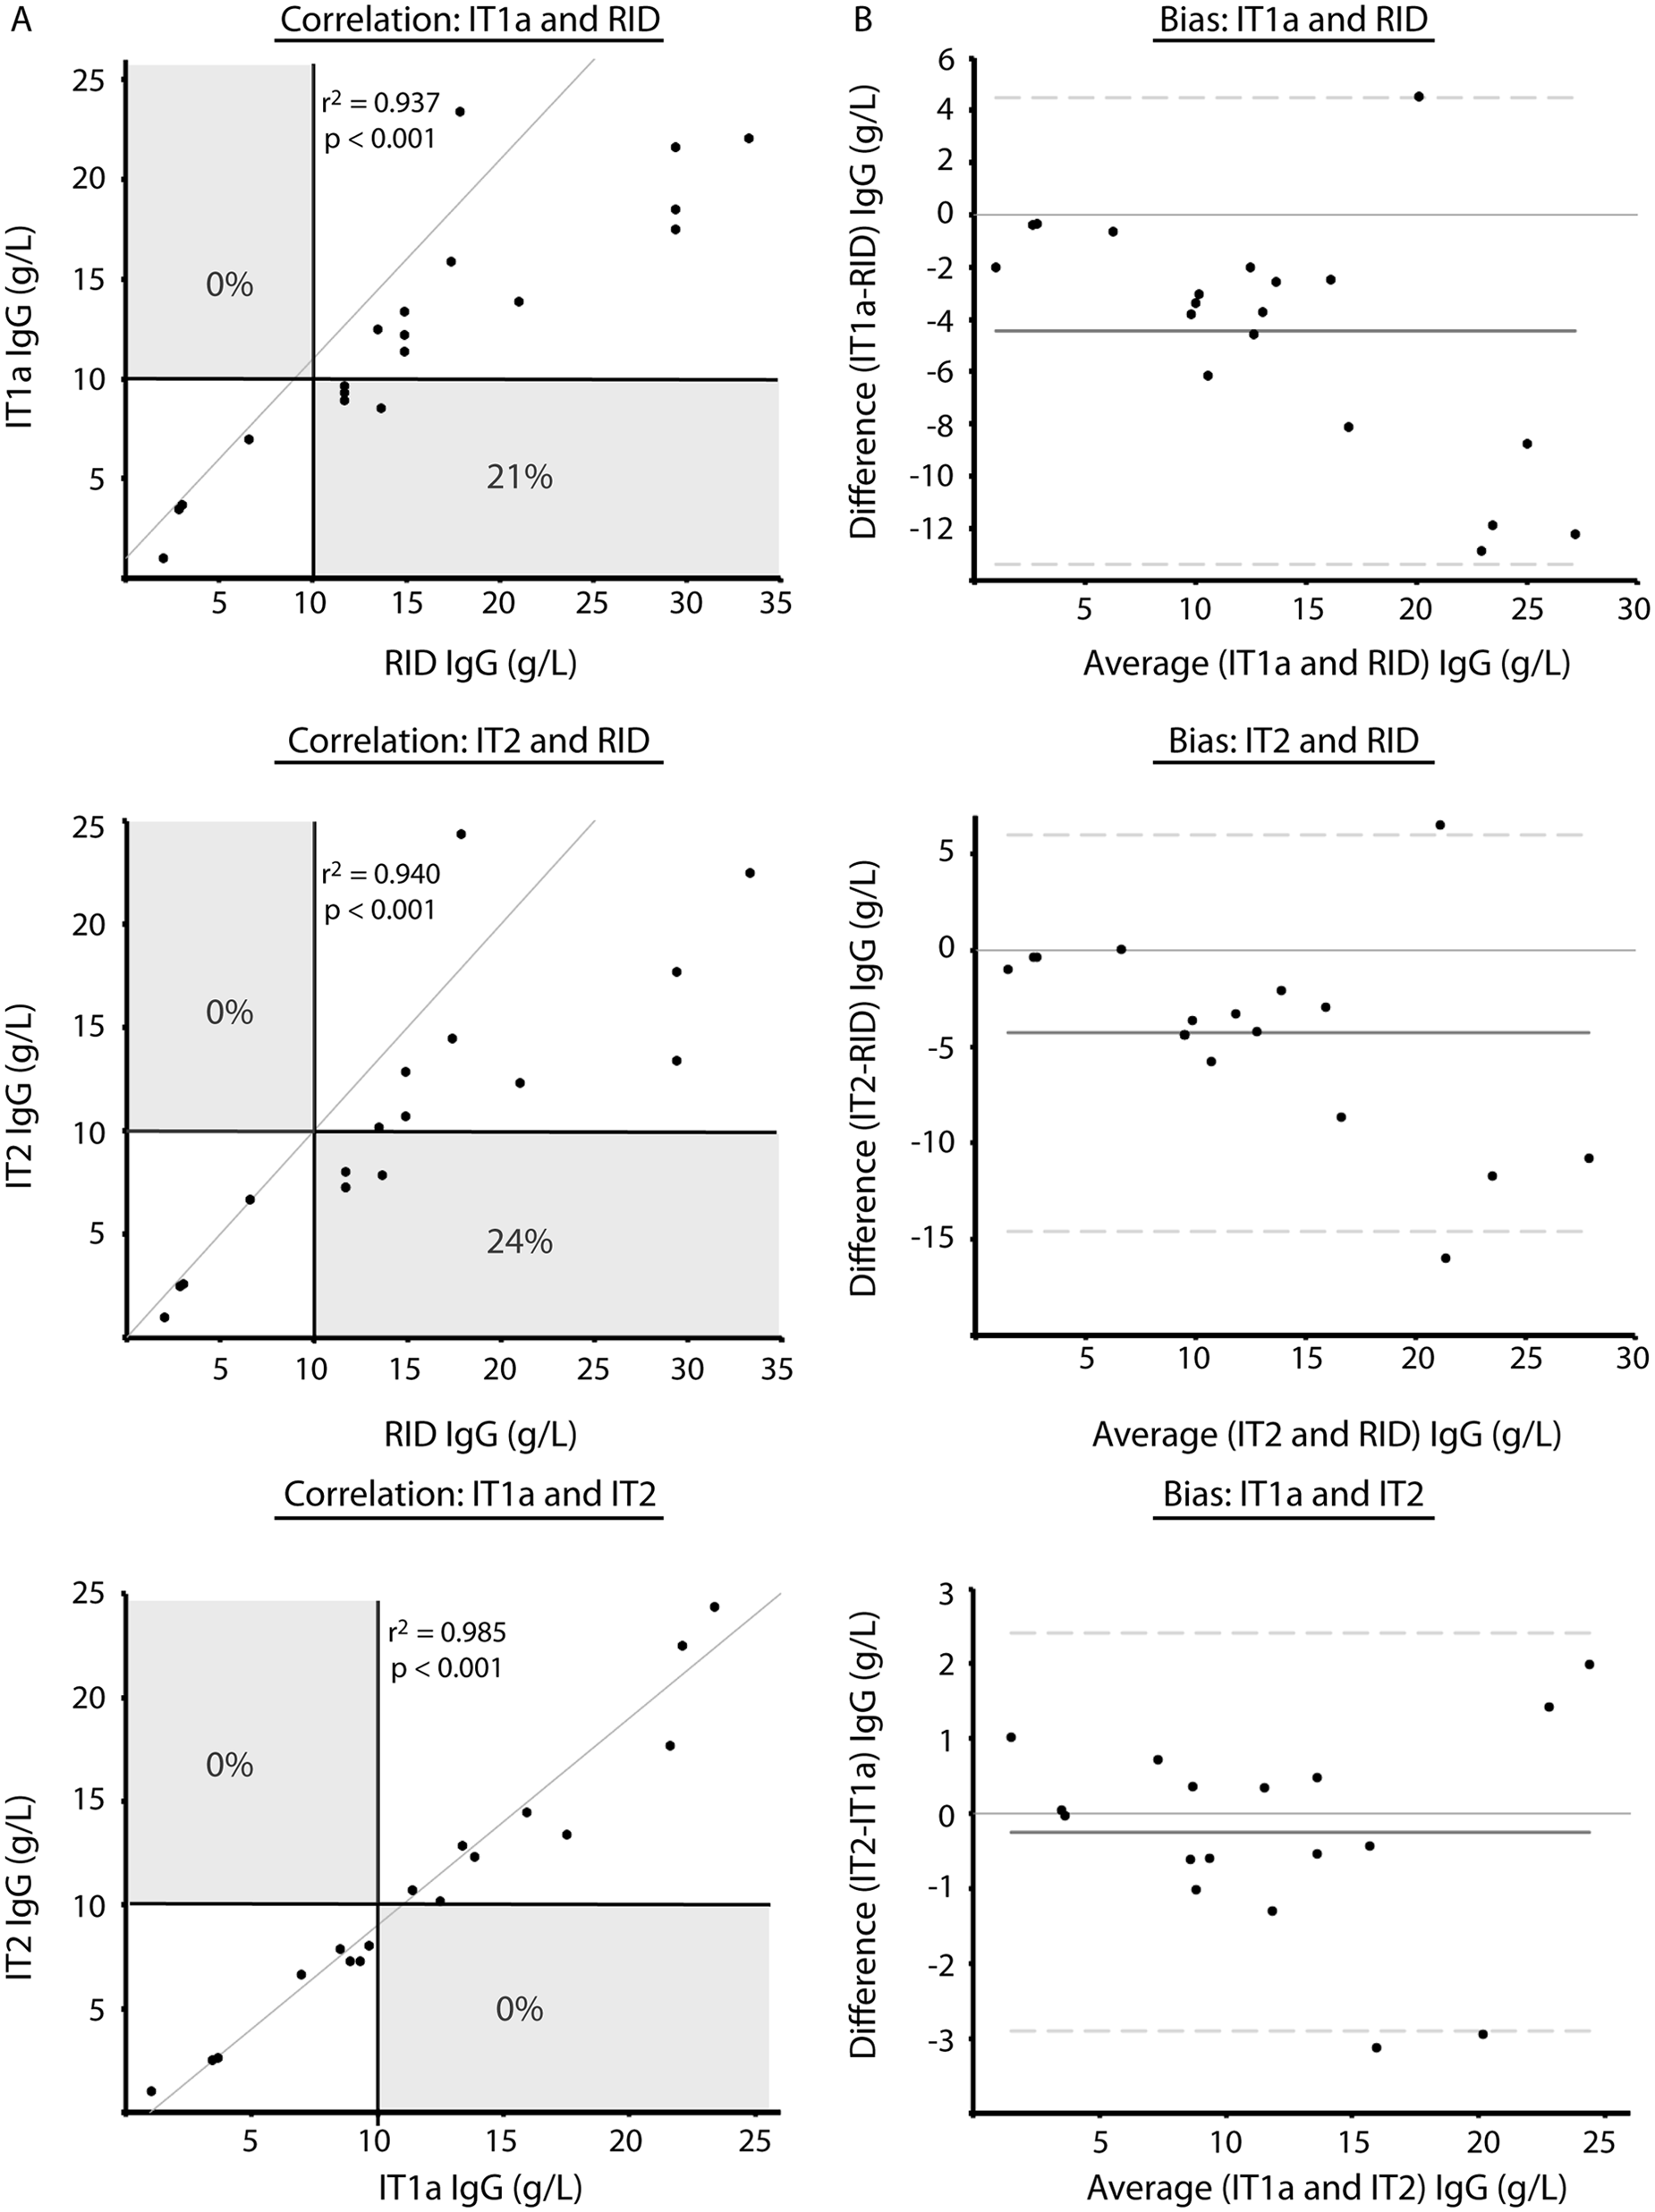
Comparison of 2 immunoturbidimetric assays, IT1a (n = 19) and IT2 (n = 17), which used the same standard, and a radial immunodiffusion (RID, n = 19) assay, which used a different standard for measurement of serum immunoglobulin G (IgG) concentration in camelids using Spearman rank correlation (
Precision of radial immunodiffusion (RID) and the 2 immunoturbidimetric assays (automated IT1 and point-of-care IT2) for measurement of alpaca immunoglobulin G (g/l). The automated assay was performed after calibration with the RID standards (IT1) or the point-of-care standard (IT1a).
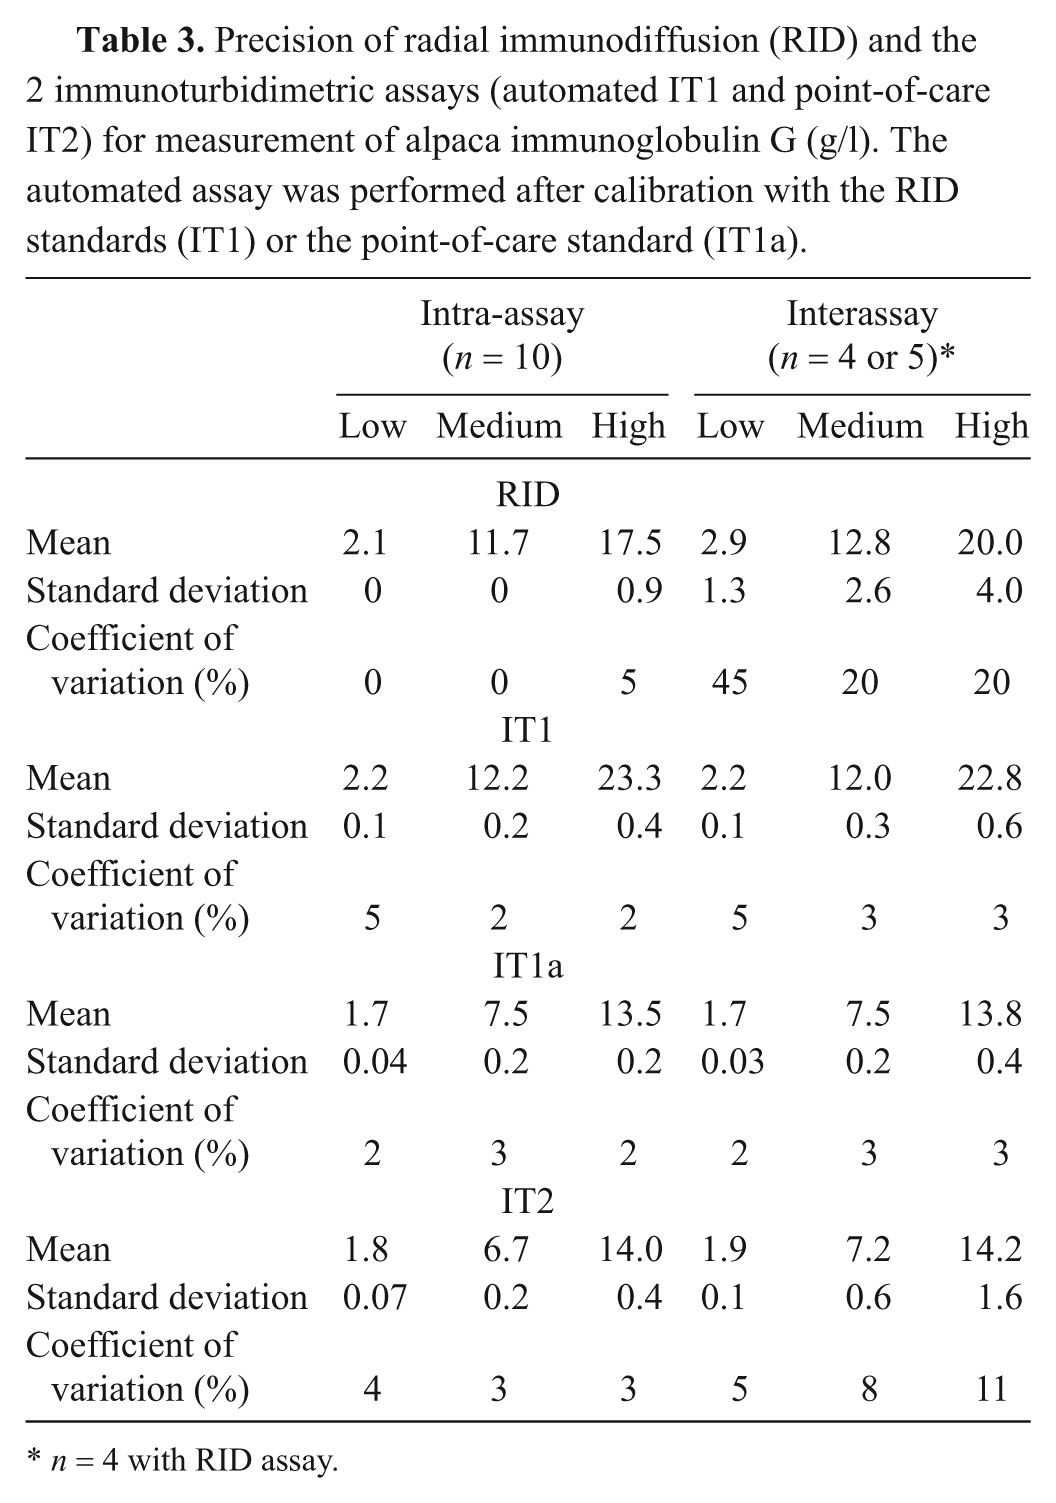
n = 4 with RID assay.
Discussion
The current study shows that there is a lack of agreement between the results of alpaca IgG concentrations obtained with commercially available RID or IT assays, which may result in underdiagnosis of FPT in crias. Similar to that concluded previously, 11 significant differences between assay results were mostly attributed to their different standards, which are not equivalent in their IgG content. This was confirmed when both available standards were tested on the automated IT assay and indicates the importance of the standard in providing IgG concentrations. The assays also demonstrated different precision, with the highest precision observed with the automated IT assay (IT1), followed by the point-of-care IT assay (IT2). The RID assay was more imprecise than either of the IT methods.
The commercially marketed IT1 and RID assays utilize the same standard, which is prepared from hi-titered male camelid plasma by fractionation with octanoic acid (personal communication with manufacturer). In contrast, the standard used to calibrate the commercial point-of-care IT2 assay was isolated with a protein A/G affinity gel (personal communication with manufacturer), a method that has been used previously for isolating IgG isotypes. 3 Electrophoretogram results from the current study indicate that these 2 methods of purification yielded different proportions of protein fractions, with the IT2 standard containing little albumin and more proteins that migrated in the expected region for immunoglobulins (β and γ) and the RID/IT1 standard containing substantial amounts of albumin (and mimicked normal camelid serum). 8 The electrophoretogram results for the RID/IT1 standard are similar to that previously, in which the labeled IgG concentrations for this standard were much higher than the γ-globulin concentration obtained by electrophoresis. 11 When the RID/IT1 standard was replaced with the IT2 standard on the automated IT1 assay, it resulted in IgG concentrations that more closely approximated those obtained with the point-of-care IT2 assay. It is uncertain which of these standards will yield more accurate IgG concentrations; however the authors’ laboratory (Cornell University, College of Veterinary Medicine) now uses the IT2 standard with the automated IT1 assay because of the apparently higher immunoglobulin content of the standard.
Variation in the IgG isotype composition of each standard and differences in the antibody used for IgG detection could result in variable assay results. Camelids produce both conventional IgG1, which incorporates light chains, as well as unique heavy-chain isotypes that do not contain light chains (IgG2 and IgG3), which account for 50% of alpaca serum IgG. 10 Alpacas also produce 2 different IgG1 and IgG3 variants. 3 The IgG isotype composition of the standards used in the RID and IT assays is unknown. It is also not known if the goat polyclonal anti-llama antibody used to detect the IgG is the same for all manufacturers. The antibodies could vary in affinity and specificity for IgG and different IgG isotypes, resulting in another cause of discrepant assay results. Even though the antibodies are raised against llama IgG, alpacas and llamas produce similar IgG isotypes devoid of light chains, and these antibodies have been shown to detect both alpaca and llama IgG.2,10
The willingness to test and treat crias for FPT varies between breeding operations and may be dependent on the fiscal status of the client and the value of the cria. Assays RID and IT1 consistently yielded results higher than that of the IT2 assay, resulting in a missed diagnosis of FPT in 10% and 17% of cases, respectively, at the medical decision limit of 10 g/l IgG. These results suggest that the IT2 assay is more likely to result in a diagnosis of FPT near this threshold and the IT2 assay should be chosen if the preference is to optimize test sensitivity in order to intervene in cases of FPT.
The RID is a traditional “gold standard” assay for measurement of serum immunoglobulins in all species.2,9,15,16 However, data from the current study indicates that it suffers from poor precision, particularly with samples run on different days. This can be explained by the manual nature of the assay with dependence on individual and subjective measurements of the width of precipitin rings. Also, assay results vary with the length of the incubation time, and small changes in the width of the precipitin rings result in large changes in results (a difference of 0.5 mm results is equivalent to a change in IgG concentration of 2–12 g/l at lower and higher IgG concentrations, respectively). This inherent imprecision of the RID assay indicates that it should no longer be the gold standard and has led to the adoption of more automated and precise methods, such as IT, for measurement of immunoglobulins. 13 In the current study, the intra-assay precision was good for all assays (≤5%), but both IT assays had higher interassay precision than the RID assay. The automated IT assay had consistently higher interassay precision (by visual inspection) than the point-of-care IT assay, particularly when they used the same standard. It should be noted that a single experienced medical technologist performed both the point-of-care IT2 and RID assays, and it is likely that precision would be lower with multiple or less-experienced operators.
The medical decision limit of 10 g/l for diagnosis of FPT in South American camelids was established in 1987 from studies of herds in Peru using a novel RID for this assessment. 9 Previous findings 16 support the need to reevaluate the medical decision limit for FPT in U.S. crias, where previous authors found that, despite a FPT rate of 20.5% in their study population at the medical decision limit of 10g/l, no crias died of infectious disease. Future studies assessing FPT rates in the U.S. camelid population may benefit from the use of assays IT1a or IT2, due to their precision and standard quality.
Results from the present study indicate that, due to the use of standards of differing quality, results from different immunologic-based commercial assays for measurement of IgG in camelids are not directly comparable and can result in underdiagnosis of FPT in crias. Practitioners and laboratory professionals alike should be aware of the nature of the standard and the inherent imprecision of their chosen assay for IgG measurement. This study also indicates that the RID has poor precision for IgG measurement, and with the long turnaround time of the assay (at least 10 hr per manufacturer recommendations), it can no longer be considered a “gold standard” assay for this purpose. In addition, the results of this study suggest that when assessing previous research on camelid IgG concentration, the results should be interpreted cautiously and with respect to the IgG assay used. Future studies are necessary to reevaluate the medical decision limit for FPT of South American camelids in the Unites States, as well as the rate of FPT in U.S. camelid populations.
Footnotes
a.
Camelid IgG Test Kit, Triple J Farms, Kent Laboratories, Bellingham, WA.
b.
Hitachi P modular, Roche Diagnostics, Indianapolis, IN.
c.
Midland BioProducts Corp., Boone, IA.
d.
Rapid Test, Value Diagnostics, Spring Valley, WI.
e.
QuickGel SPE kit, SPIFE 3000; Helena Laboratories, Beaumont, TX.
f.
Prism 5 for Mac OS version 5.0c, GraphPad Software Inc., La Jolla, CA.
g.
Analyse-it for Excel software, Analyse-it Ltd., Leeds, UK.
h.
Vassarstats, ©Richard Lowry 1998–2012. All rights reserved.
Declaration of conflicting interests
The author(s) declare no potential conflict of interest with respect to the research, authorship, and/or publication of this article.
Funding
The author(s) disclosed receipt of the following financial support for the research, authorship, and/or publication of this article: The work in this study was partially supported by the Empire Alpaca Foundation.