
Abstract
The aim of the current study was to validate an automated immunoassay for cortisol quantification in the saliva of pigs. The assay had intra- and interassay coefficients of variation lower than 16%, in all cases. The limit of detection was 0.016 µg/dl, and the lower quantification limit was 0.197 µg/dl. The assay also demonstrated a high level of accuracy, as determined by linearity under dilution and recovery tests. In addition, this assay was used to quantify cortisol in 2 models of stress: 1 in which animals were immobilized with a nose-snare and 1 in which pigs were transported for a duration of 30 min. In both cases, a significant increase (P < 0.01) in salivary cortisol was detected after the stressful situation. Overall, the assay validated in the present study could be used for the evaluation of cortisol changes in stressful situations.
Introduction
Animal welfare is of great importance in animal production systems and is usually evaluated using different indicators of stress. 2 A common way to determine stress is an evaluation of the status of the hypothalamic-pituitary-adrenal (HPA) axis. When an animal is submitted to a stressful situation there is an activation of the HPA axis and an increase in cortisol. For this reason, the measurement of cortisol is a common component of stress research. 4 Cortisol can be measured in blood (plasma or serum), urine, or saliva.
Blood and urine sampling have several inherent problems in swine. Blood collection is achieved by venipuncture, and the lack of superficial blood vessels in this species usually requires that the extremely invasive method of surgical implantation (requiring restraint) of cannulas be used in order to obtain repeated blood sampling. 1 On the other hand, urinary cortisol can be used as an additional tool to assess welfare but urine is very difficult to collect in pigs, 13 requiring special collection devices and, severely limiting the number of animals that can be used in an experiment at any one time. 4 In contrast, salivary cortisol can be sampled without inducing stress by a method that does not require force or restraint of the animal and that allows repeated sampling over a short period of time. 10 In addition, several authors have demonstrated that salivary cortisol concentrations are valid indicators of circulating cortisol levels in pigs and the concentration represent an adequate way to evaluate the HPA response to a stressor.3,10,15
Measurement of porcine salivary cortisol concentration has generally been performed by radioimmunoassay techniques.4,15,21 A manual enzyme immunoassay technique has also been used to measure porcine cortisol in saliva samples. 19 However, to the authors’ knowledge, automated assays have not been used for cortisol measurement in porcine saliva samples. The use of the automated chemiluminescent system evaluated in the current study has several advantages: its ease of use; a high throughput analysis; and the system is a fully integrated process. A further advantage of this assay system is that it allows the total capture of all reagents, samples, and wash solutions in the device itself. This simplifies the disposal of potentially biohazardous material, an increasing concern for the laboratory. In addition, this assay overcomes the limitations of radioimmunoassay techniques, such as short shelf-lives of the radioactive reagents; radiation safety hazards for personnel; stringent requirements for waste disposal; slow turnaround time; and difficult integration into laboratory functions.14,17
The objective of the current study was to validate the use of an automated chemiluminescent immunoassay analyzer for salivary cortisol measurements in pigs. For this purpose, an analytical validation was conducted, as well as the evaluation of the assay to detect different salivary cortisol concentrations after the application of 2 different models of stress.
Materials and methods
Chemiluminescent assay
Cortisol concentration was measured using a solid-phase, competitive chemiluminescent enzyme immunoassay. a The assay uses a polyclonal rabbit anti-cortisol and a single reagent; alkaline phosphatase conjugated with cortisol in the buffer, with a preservative. Although some steroids exhibit cross-reactivity, their normal physiological concentrations are low compared to cortisol; hence, the steroids do not significantly interfere in the cortisol procedure. There is, however, an observed cross-reactivity of approximately 49% with prednisolone, which must be considered for animals undergoing this therapy. Manufacturer-supplied information indicated a detection limit for the assay of 0.2 µg/dl and a recommended working range of 0.2–50 µg/dl. The sample volumes used were according to the manufacturer’s specification sheet (sample cup must contain at least 100 µl more than the total volume required; 10 µl minimum). All analyses were performed in duplicate.
Saliva collection
Saliva was collected from all animals using saliva collection tubes b containing a sponge, as reported previously. 9 Pigs were allowed to chew the sponge, which was clipped to a flexible thin metal rod, for 1–2 min. The sponges were then placed in the tubes and centrifuged at 3,000 × g for 10 min. Saliva samples were collected and stored at −80°C until analysis.
Analytical validation
Assessment of intra-assay and interassay precision
The intra-assay precision, expressed as the coefficient of variation (CV), was calculated by measuring 3 pools of saliva samples 5 times in a single analytical run, with low, medium, and high concentrations of salivary cortisol, respectively. Each pool was prepared by mixing samples of saliva from 3 animals with similar concentrations of cortisol previously quantified by the present chemiluminescent assay. These samples were obtained from pigs at transition and fattening periods from the experimental farm of the University of Murcia (Murcia, Spain).
The same pools were used to determine the interassay precision by analysis on 5 different days within a 15-day period. The samples were frozen in aliquots, and vials were only thawed as required for each analytical run in order to prevent potential variation as a result of repeated freeze–thaw cycles.
Assessment of sensitivity
The detection limit was defined as the lowest concentration of salivary cortisol that could be distinguished from a specimen of zero value. It was calculated based on data from 10 replicate determinations of the zero standard (deionized water) as the mean value plus 2 standard deviations. 5
The lower and upper limit of quantification was calculated based on the lowest and highest cortisol concentration that could be measured where the CV was less than 20% and above the limit of detection. To estimate this parameter, the high saliva sample was serially diluted in deionized water, and each dilution was analyzed in 5 replicates in the same run. 11
Assessment of assay accuracy
As no gold standard assay is available to quantify cortisol in porcine saliva, the accuracy was indirectly investigated by linearity under dilution and recovery experiment as follows:
Linearity under dilution was determined by using 2 saliva samples with high levels of salivary cortisol serially diluted (1/2, 1/4, 1/8, 1/16, 1/32, 1/64) with deionized water. The cortisol concentration was measured in duplicate for each dilution. Afterward, curves representing salivary cortisol concentration measured versus salivary cortisol concentration expected were constructed.
The recovery experiment was performed as previously reported. 12 One saliva sample containing a high level of cortisol and 1 containing a low level of cortisol were selected. The high cortisol level sample was diluted 2- (50%), 4- (25%), and 10-fold (10%) with the low cortisol level saliva sample (50%, 75%, and 90%, respectively). In addition, the low cortisol level saliva sample was diluted 4-fold (25%) with the high cortisol level saliva sample (75%). Detected and expected cortisol levels for each diluted saliva sample were compared, and the percentages of recovery were calculated.
Models of induction stress
Two models of stress induction were used to evaluate the effect of stress on salivary cortisol concentrations using the chemiluminescent assay system described herein. All animals included in the studies were male ([Sus scrofa domesticus] Duroc × [Landrace × Large White]) crossbred, and the studies were conducted during the fattening period. The animals came from the experimental farm of the University of Murcia (Murcia, Spain), and all procedures involving animals were approved by the Ethical Committee of that University. The animal care and experimental procedures used in the current study conformed to the regulations and guidelines of the Spanish Royal Decree 223/88 (BOE 67:8509-8511), concerning the protection of animals used for scientific research.
A group of 10 pigs (165 days of age and approximately 100 kg bodyweight) were transported commercially by road from farm to slaughterhouse in the month of December, with a transport time of 30 min. The commercial transporter allowed 1.5 m2 per pig, with no sawdust, feed, or water provided. The animals were sampled immediately before loading (prestress or baseline) and again upon arrival at slaughterhouse pens (poststress).
A second group of 10 pigs was immobilized for 1 min with a nose-snare (stressor stimulus), and saliva samples were collected before (prestress or baseline) and 15 min after (poststress) the stressor stimulus. The animals designated for stress induction were from different pens in order to avoid the possible psychological stress that the animal could suffer due to the observation of the nasal snare application to others.
Statistical analysis
Intra- and interassay CVs and detection limits were calculated using routine descriptive statistical procedures with spreadsheet program, c which was also used to investigate linearity under dilution. The lower limits of quantification were calculated using a statistical program. d Cortisol measurements obtained from the stress studies were evaluated for normality of distribution using the Kolmogorov–Smirnov statistic. As the results did not meet normal distribution criteria in the transport group, a Mann–Whitney nonparametric test was used to compare salivary cortisol concentrations from before the application of the stressor stimulus with those from after its application. The nose-snare group was analyzed by a paired t-test, as results showed a normal distribution. Statistical significance for differences between prestressed and poststressed pigs was set at P < 0.05 and the differences were calculated using the same statistical program. d
Results
Analytical validation
Intra-assay and interassay precision
Results from the precision study are shown in Table 1. The intra-assay variation showed CVs of 11.62%, 3.19%, and 2.90% for samples with low, medium, and high salivary cortisol concentration, respectively. The interassay variation provided CVs that ranged between 15.55% for the sample with low levels of cortisol and 4.30% for the sample with high cortisol content.
Intra-assay and interassay obtained in saliva pools of porcine with high, medium, and low concentrations of cortisol.*
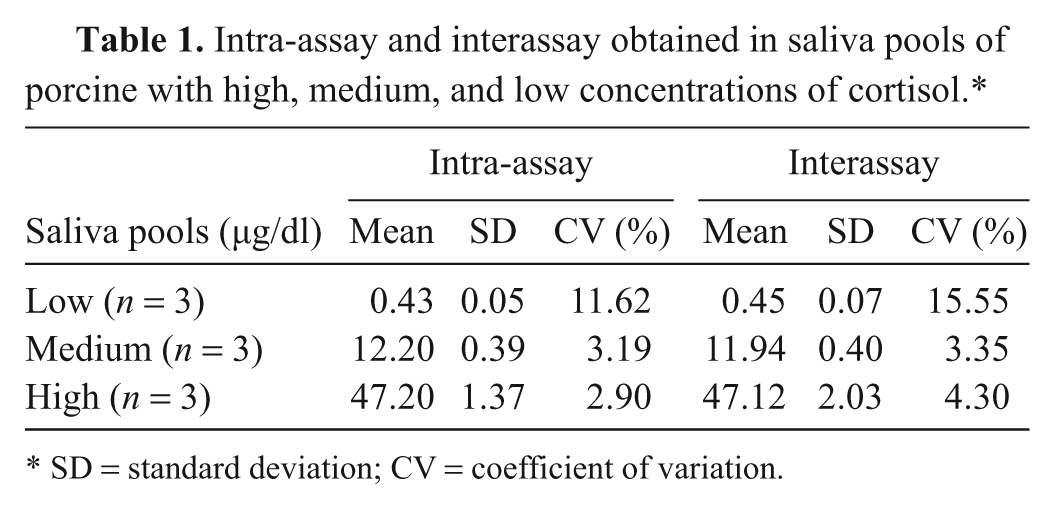
SD = standard deviation; CV = coefficient of variation.
Assessment of assay sensitivity
The analytical limit of detection calculated gave a result of 0.016 µg/dl. The lower limit of quantification was 0.197 µg/dl, which is illustrated in Figure 1. No upper limit of quantification was obtained (the highest concentration of 322 µg/dl was obtained in a pig of the transition period with 1.20% CV).
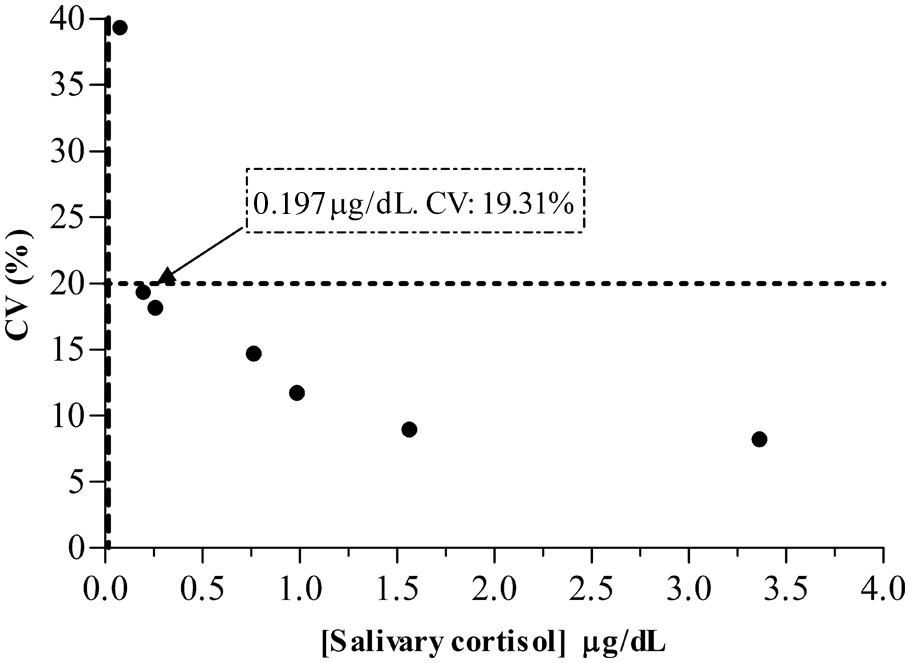
Limit of quantification profile for the detection of salivary cortisol in pigs. Horizontal dashed line illustrates the highest coefficient of variation (CV) accepted (20%) for the limit of quantification calculation. The vertical dashed line shows the analytical limit of detection (0.016 µg/dl).
Assessment of assay accuracy
The dilution of 2 porcine saliva samples with high cortisol concentrations resulted in linear regression equations (Fig. 2). Results showed r equaled 0.998 and 0.996 for samples 1 and 2, respectively.
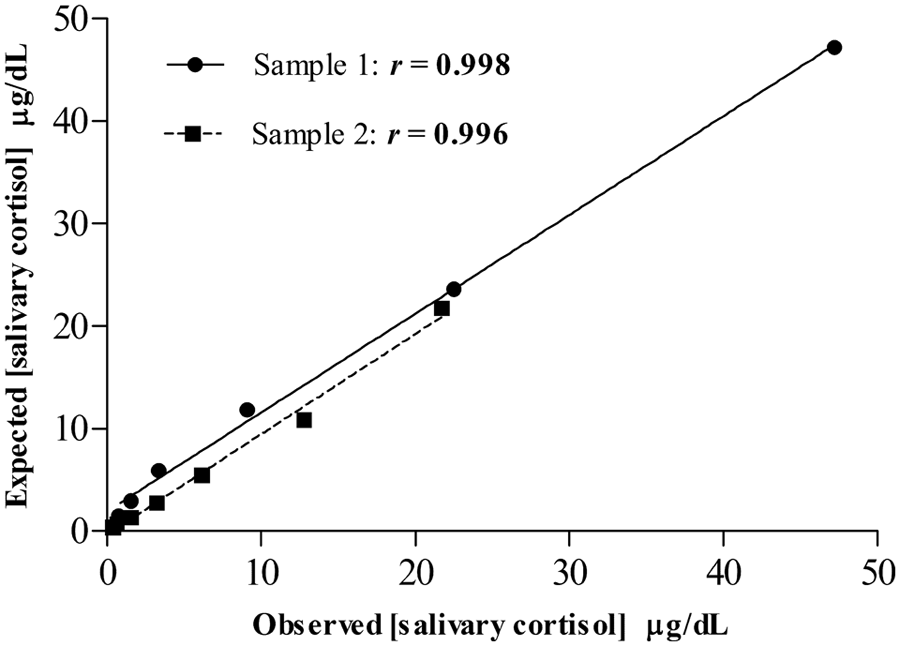
Investigation of linearity under dilution of 2 porcine saliva samples containing high levels of cortisol (47.2 µg/dl and 21.73 µg/dl, respectively). Where “x” represents the measured salivary cortisol level at the particular dilution and “y” represents the expected salivary cortisol level. r = correlation coefficient.
Results of the recovery study are shown in Table 2. The amount of salivary cortisol detected in the diluted sample decreased in proportion to the amount of sample with low concentration added. Similarly, when the saliva with high concentration was used to spike the sample containing low levels of cortisol, a rise in cortisol levels of the former sample was observed. The recovery average was 91.95%.
Recovery of cortisol in saliva samples.
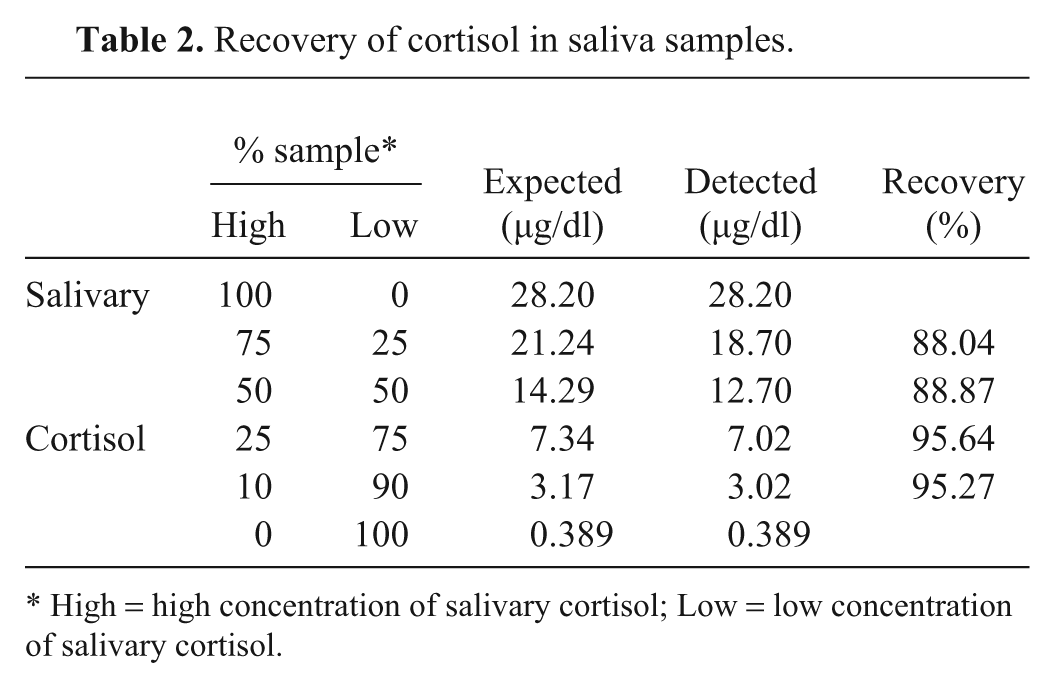
High = high concentration of salivary cortisol; Low = low concentration of salivary cortisol.
Results of the different models of stress induction
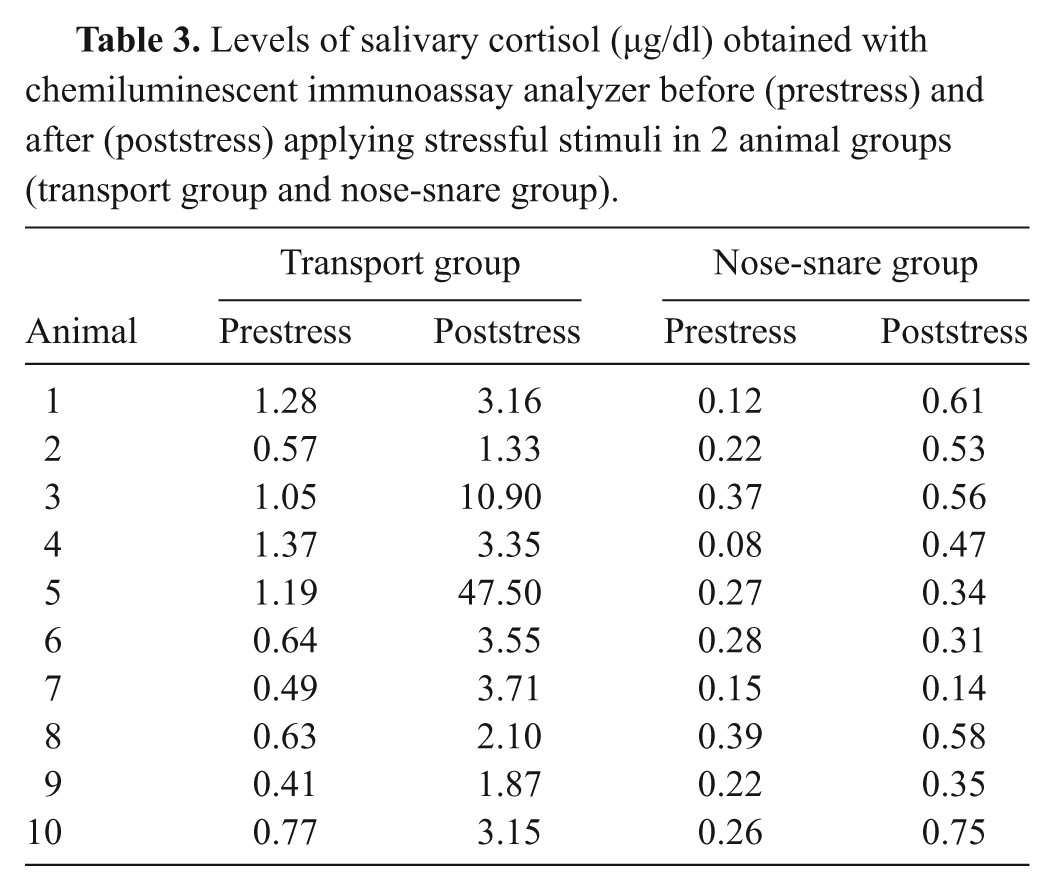
The levels of salivary cortisol obtained during both stress models are shown in Table 3. Statistical analysis showed that both models of stress provided a significant increase (P < 0.0001 and P = 0.0033 for transport and nose-snare stress, respectively) in salivary cortisol levels after application of the stressor stimulus (poststress) compared to those obtained during baseline (prestress). The median saliva cortisol concentration increased from levels of 0.70 µg/dl as baseline or prestress to 3.25 µg/dl after transportation (Fig. 3A). Saliva cortisol concentration average increased from levels of 0.24 µg/dl as baseline to 0.50 µg/dl after immobilization with nose-snare (Fig. 3B). However, 1 animal did not show an increase in its salivary cortisol levels after being subjected to immobilization with the nose-snare.
Levels of salivary cortisol (µg/dl) obtained with chemiluminescent immunoassay analyzer before (prestress) and after (poststress) applying stressful stimuli in 2 animal groups (transport group and nose-snare group).
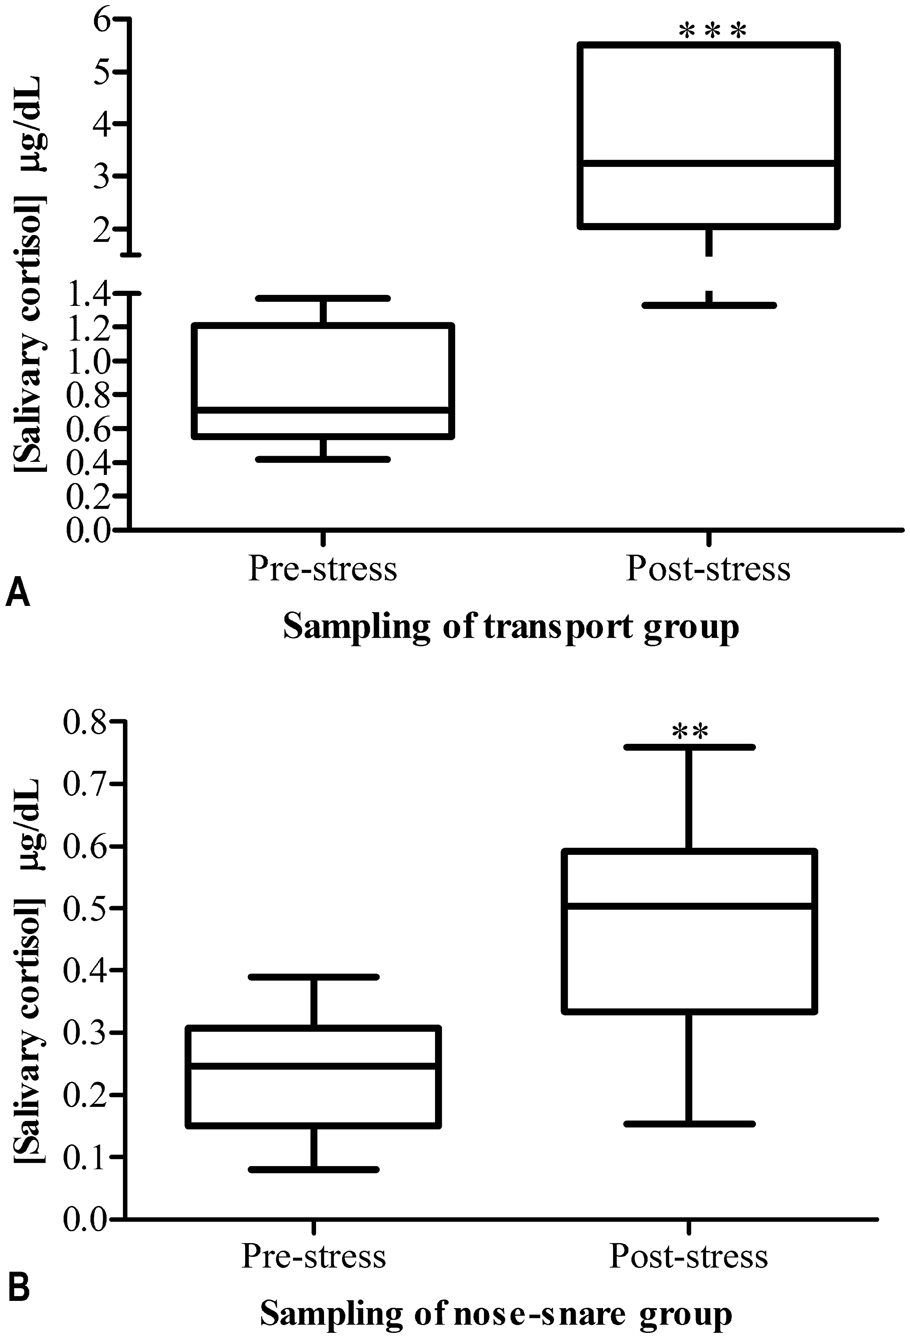
Evolution of salivary cortisol levels in pigs before (prestress) and after (poststress) application of stressor stimuli:
Discussion
Given the numerous advantages of the stress-free collection and processing of saliva and the good correlation shown between cortisol in saliva and blood, the use of cortisol measurements in saliva could be considered very suitable in porcine stress research.3,10,15 In the current study, a chemiluminescent assay system originally used with humans for measuring levels of cortisol that has also demonstrated a good analytical performance in blood samples of dogs, cats, and horses, 18 was adapted and validated for pig saliva samples. Moreover, an evaluation of the potential use of the assay system to detect different cortisol concentrations before and after the application 2 different stressors was performed.
The CVs obtained for intra-assay precisions were less than 12%, whereas the interassay CVs were less than 16%, in all cases. The validation results indicated that the method was adequate for salivary cortisol measurements given that it is generally accepted that the CV must be lower than 20% for analytical determinations (U.S. Department of Health and Human Services: 2001, Bioanalytical Method Validation US. Available at: http://www.fda.gov/downloads/Drugs/GuidanceComplianceRegulatoryInformation/Guidances/ucm070107.pdf. Accessed June 15, 2012). As far as the authors are aware, there is no previous validated automated method for the measurement of cortisol in porcine saliva for comparison. However, similar CVs (less than 18%) were obtained in a previous study 22 with a electrochemiluminescence immunoassay analyzer for salivary cortisol in dogs, and the CVs in the present study were lower than those obtained in the validation of this type assay in serum of others animal species, such as dogs, cats, horses (in these 3 species CVs were close to 20%), 18 or Florida manatees (23.5% and 16.7% for intra- and interassay, respectively). 20
Limit of detection of the method was very low, demonstrating the high sensitivity of the assay system. All concentrations obtained in the saliva samples were higher than the limit of detection. However, 4 saliva samples belonging to the nose-snare stress study had cortisol values below the limit of quantification (0.197 µg/dl). The 4 values correspond to the prestress samples of 3 animals and the poststress sample of 1 animal that did not increase and kept its low level of salivary cortisol. Values of cortisol lower than 0.197 µg/dl should be interpreted with caution due to the poor repeatability, but these values will not overlap with the values of stressed animals. For example, it was found that one of the prestress samples had a value of 0.080 µg/dl and a CV of 39%, which would indicate a possible range of 0.049–0.111 µg/dl. The assay lower limit of quantitation was similar to a previous study 4 using a commercially available radioimmunoassay kit (0.21 µg/dl) but higher (0.006 µg/dl) than another study 8 of human samples using a commercial high-sensitivity salivary cortisol enzyme immunoassay.
Because there is no reference technique or gold standard and no commercially available reference material for cortisol measurements in saliva, accuracy was indirectly estimated in the current study using a linearity and recovery assay. High correlation coefficients were obtained for cortisol concentrations (r = 0.99) in serially diluted samples, indicating that the assay system was highly accurate. This high accuracy was additionally supported by the results found in the recovery experiment, as, in all cases, the recovery was close to 100%.
Significant increases in cortisol levels were found when 2 models of acute stress were applied. An individual variability in the magnitude of responses of both salivary stress models between animals was observed (as can be seen in Table 3). This variability may be explained by the differences in sensitivity of each individual animal against the stress. Transportation is inherently stressful for pigs and has been shown in other studies to increase cortisol concentration in saliva samples of pigs after transportation.6,16 All the animals in the current study had higher salivary cortisol levels after transport stress, with a mean magnitude of increase of 78%, higher than those obtained with radioimmunoassay techniques in a previous study 6 (approximately 57%) after transport for 25 min and by another study 16 that detected an increase of approximately 60% after 30 min of transportation.
On the other hand, the technique of temporarily restraining pigs is commonly used in veterinary practice as an acute stress model and has been shown to cause increases of cortisol concentration in saliva samples, mainly at 15 min after removal.7,10 In the current study, all pigs, except for 1, had higher salivary cortisol levels after the nose-snare stress with a magnitude of increase of approximately 52%. Similar increases (approximately 50%) were obtained by a previous study, 7 and greater increases, of 72%, were obtained when temporary restraint was used. 10 These results demonstrate that the assay system described herein is able to detect increases in salivary cortisol concentrations when pigs are subjected to stressful stimuli.
In conclusion, the automated chemiluminescent assay system tested in the current study is suitable for use in porcine saliva samples. The assay provided good analytical performance and allowed for an adequate discrimination between samples with low and high cortisol concentrations. The assay could be a used as a noninvasive and nonradioactive system to analyze salivary cortisol in stress research, and its ease of use and high throughput of samples make this assay system an alternative to radioimmunoassay and manual enzyme-linked immunosorbent assay techniques. The only limitation could be the lack of precision with values lower than 0.197 µg/dl, although this does not seem to interfere with the interpretation of the assay when used to detect increases in cortisol concentrations that are produced by stress.
Footnotes
Acknowledgements
The authors would like to thank Isabel Rodriguez Muñoz for her assistance with measurements of samples.
a.
Immulite/Immulite 1000 cortisol, Siemens Medical Solutions Diagnostics, Los Angeles, CA.
b.
Salivette, Sarstedt, Aktiengesellschaft & Co., Nümbrecht, Germany.
c.
Excel 2010, Microsoft Corp., Redmond, WA.
d.
Version 5.0, GraphPad Software Inc., La Jolla, CA.
Declaration of conflicting interests
The author(s) declared no potential conflicts of interest with respect to the research, authorship, and/or publication of this article.
Funding
The author(s) disclosed receipt of the following financial support for the research, authorship, and/or publication of this article: This study was supported by a grant from the University of Murcia and by the Spanish Ministry of Education and Science (AGL 2009-08509).