
Abstract
Diagnostic strategies to detect Mycobacterium avium subsp. paratuberculosis (MAP) super-shedder cows in dairy herds have been minimally studied. The objective of the current study was to compare the cost-effectiveness of strategies for identification of MAP super-shedders on a California dairy herd of 3,577 cows housed in free-stall pens. Eleven strategies that included serum or milk enzyme-linked immunosorbent assay (ELISA), quantitative real-time polymerase chain reaction (qPCR) or culture of environmental samples, pooled or individual cow fecal samples, or combinations thereof were compared. Nineteen super-shedders (0.5%) were identified by qPCR and confirmed by culture as cows shedding ≥10,000 colony forming units (CFU)/g feces (median of 30,000 CFU/g feces). A stratified random sample of the study herd based on qPCR results of fecal pools was the most sensitive (74%) strategy and had the highest cost ($5,398/super-shedder). The reference strategy with the lowest cost ($1,230/super-shedder) and sensitivity (47%) included qPCR testing of fecal samples from ELISA-positive lactating (milk) and nonlactating (serum) cows housed in pens with the highest MAP bioburden. The most cost-effective alternative to the reference was to perform qPCR testing of fecal samples from ELISA-positive cows (milk and serum for milking and dry cows, respectively) for a sensitivity of 68% and cost of $2,226/super-shedder. In conclusion, diagnostic strategies varied in their cost-effectiveness depending on the tests, specimen type, and labor costs. Initial qPCR testing of environmental samples from free-stall pens to target cows in pens with the highest MAP bioburden for further testing can improve the cost-effectiveness of strategies for super-shedder identification.
Keywords
Introduction
Paratuberculosis-infected cows that shed Mycobacterium avium subsp. paratuberculosis (MAP) in excess of 104 colony forming units (CFU)/g of feces have been termed super-shedders.1,9 The recent recognition of super-shedders has occurred because of the serial dilution of fecal samples recorded initially with MAP colonies that are too numerous to count when cultured undiluted on Herrold egg yolk medium (HEYM; Fyock TL, Whitlock RH, Sweeney RW, et al.: 2006, Serial dilutions of TNTC Mycobacterium avium subsp. paratuberculosis fecal samples. In: 49th Association of Veterinary Laboratory Diagnosticians annual meeting, p. 113. St Paul, MN).
The epidemiology, detection, and economic and biologic importance of super-shedders has been the focus of previous studies,1,9 as these cows may be major contributors to ongoing environmental contamination and MAP transmission on a dairy farm. Identification of MAP super-shedders in a large dairy herd is challenging given the per-sample cost of MAP diagnostic tests, 10 the low prevalence of super-shedders (Whitlock RH, Sweeney RW, Fyock TL, Smith J: 2005, MAP super-shedders: another factor in the control of Johne’s disease. In: Proceedings of the 8th International Colloquium on Paratuberculosis, p. 42. Copenhagen, Denmark), and hence, the large sample size required to identify them. While fecal culture on HEYM is considered an appropriate antemortem reference test for MAP, 5 it requires periodic reading of cultures for up to 16 weeks and typically costs approximately $20 per sample. 10 Furthermore, to identify super-shedders, additional sample processing in the form of serial dilutions of feces and multiple cultures of each dilution are necessary to establish an endpoint where CFU can be readily counted. Quantitative real-time polymerase chain reaction (qPCR) testing has been shown to yield results that are highly correlated with culture results on HEYM.1,2 Hence, qPCR may be preferable for identification of super-shedders because it yields rapid quantitative results (threshold cycle values [Ct]) at similar cost to HEYM culture 5 without the need for serial dilution of fecal samples.
Individual cow testing to identify super-shedders in a large dairy herd may be cost-prohibitive. Aggregate samples, such as pen slurry, which represent multiple cows in a production group, and pooled fecal samples, may be used as part of a diagnostic strategy to identify pens or pools, respectively, that have high MAP bioburden. Subsequent testing of samples contributing to pools or pen slurry samples with the highest MAP concentration is a potential diagnostic strategy to identify super-shedders. One potential limitation of this strategy in large dairy herds is that cows are routinely moved between pens for management purposes, commonly every 1–2 weeks, and hence, pen environmental sampling, testing, and ranking by MAP bioburden for subsequent testing must take place between such events. Sampling of pen slurry using a standardized environmental sampling protocol 3 can reliably quantify MAP bioburden in pens on a dairy over a period of 5 days using qPCR and hence, may be used on large dairies to identify pen cow populations that may include super-shedders. 1
Several diagnostic strategies to identify super-shedders are possible given the available combinations of MAP organism- and antibody-detection tests and the different specimen types that may be tested such as feces, serum, or milk. An example of a diagnostic strategy based solely on qPCR is the initial ranking of Ct values of environmental samples and the subsequent testing of pooled fecal samples of cows in the pen(s) with the highest MAP bioburden (lowest Ct values). The final step would be qPCR testing of individual cow feces that were included in the positive pools. An example of a testing strategy that utilizes multiple diagnostic assays is a whole-herd serum enzyme-linked immunosorbent assay (ELISA) followed by qPCR test of fecal samples from ELISA-positive cows. A strategy based solely on qPCR might cost more than another that incorporates a less expensive assay in 1 or more of its early testing stages, or a different strategy with fewer stages. Hence, the practical choice between 2 competing strategies depends not only on the gain in sensitivity to detect super-shedders but also on their relative cost. The objectives of the current study were to compare the sensitivity of different diagnostic strategies to identify super-shedders and to evaluate their cost-effectiveness in a single large dairy herd.
Materials and methods
Study herd
The study herd of 3,577 Jersey cows was located in California. Based on routine testing of all cows at the onset of the dry period, the study herd had a MAP serum ELISA prevalence of 3.5% and a fecal-culture prevalence of 3.7%, as defined by a positive signal in liquid culture a at <42 days and confirmed by real-time PCR. Cows were housed in 14 free-stall pens (mean [standard deviation (SD)] = 253 (60) cows/pen) that were flushed with wastewater from the storage lagoon. For the study period, the herd manager limited moving cows between pens and recorded the identification of cows that had to be moved.
Sample collection
During the first week of October 2007, fecal and blood samples were collected from all 3,577 cows with approximately 900 cows sampled daily from Monday to Thursday. Briefly, feces were collected per rectum from each adult cow using a new disposable glove and placed in a 30-ml flip-top plastic container. Batches of 200–300 fecal samples were transported to a clean work station where each sample was transferred into a clean 30-ml flip-top plastic container using a disposable wooden tongue depressor, and individually wrapped in a polyethylene sterile bag with wire-twist closures. b Fecal samples were shipped on ice overnight to an approved laboratory c for MAP culture and qPCR. Whole blood was collected from the tail vein of each cow into anticoagulant-free Vacutainer tubes d and stored at 4°C until shipped to an approved laboratory e for serum ELISA testing. Environmental samples were collected from a pen using a standardized sampling protocol 1 on the same day that cows in the respective pens were individually sampled. These samples were processed and shipped on ice overnight to the laboratory c for culture, as previously described. 1 Milk samples were collected from the entire lactating herd (2,942 cows) on the last day of sampling as part of the herd’s monthly Dairy Herd Information Association (DHIA) test. Briefly, at the local DHIA testing center and after routine testing, approximately 1 ml of milk was poured from each cow’s residual sample into a 5-ml plastic tube and shipped on ice overnight to an approved laboratory f for ELISA testing.
Sample processing and testing
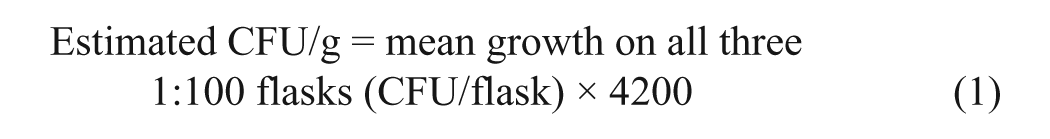
At the laboratory, c each cow fecal and pen environmental sample was aliquoted into 1 container for testing and another for storage as a repository sample at −70°C. For HEYM culture of pooled fecal samples, 2 g of each individual cow’s fecal sample were placed into 35 ml of sterile water, mixed for 30 min, and allowed to settle for another 30 min. After settling, 5 ml of supernatant were transferred into a 50-ml sterile plastic tube to be part of the pool of 10 samples, mixed, and allowed to settle for 30 min. After settling, 25 ml of the supernatant were drawn, of which 20 ml were dispensed into a sterile conical tube for qPCR testing using a commercial assay, g following the manufacturer’s instructions, and thermocycler h as reported in a prior study. 1 Results of qPCR were reported as Ct values and were truncated at 50 Ct, the maximum number of cycles run. The remaining 5 ml were dispensed into a single tube of half-strength brain heart infusion broth solution with hexadecylpyridium chloride solution and processed for culture on 4 mycobactin-containing HEYM tubes. 6 The number of CFU (based on noncontaminated tubes) was counted by the same technician every 2 weeks for 16 weeks. Pen environmental samples for HEYM culture were processed similarly but without pooling. Individual cow fecal samples identified for MAP quantification as part of a strategy were serially diluted 1:1, 1:10, and 1:100, processed and cultured similarly but on 3 HEYM flasks for each dilution. The estimated CFU/g of feces in a sample was calculated after accounting for the dilution factor of 42, 420, and 4,200 for the serial dilutions 1:1, 1:10, and 1:100, respectively. For example, if the final dilution with colony growth was 1:100, then the CFU/g was estimated using the following equation:
Serum and milk were tested for MAP antibodies using commercial serum ELISA i and milk ELISA f assays, respectively. For serum ELISA, the manufacturer’s recommended cutoff threshold of 0.25 sample-to-positive (S/P) ratio was used to classify serum samples as positive for MAP antibodies. Similarly, the milk ELISA manufacturer recommended cutoff value of 0.1 was used to classify MAP antibody–positive milk samples. All testing was blinded.
Diagnostic testing schedule
Samples were tested in 5 phases to allow for the different combinations of diagnostic tests that make up the strategies investigated (Table 1). However, an investigator who plans to utilize a single strategy would only consider tests used in that strategy. This would substantially reduce the time to detection compared with the time it took to complete the present study, which involved evaluation of 11different strategies. In phase 1, serum and milk ELISA were performed within 1 and 3 days of sampling, respectively. In phase 2, fecal samples of cows that tested positive for MAP antibodies in serum or milk were tested by qPCR within 1 week of sampling. In phase 3, all the pooled fecal samples were tested by qPCR within 2 weeks of sampling and by culture on HEYM within a year of sampling. For pooled fecal samples results, CFU >75 were reported in a range because of counting limitations, and the lower limit of these ranges was used to calculate mean CFU/tube. For example, results of fecal pools with HEYM culture results of 75–100 CFU/tube were analyzed as 75 CFU/tube. Also in phase 3, all environmental samples were tested by qPCR and pens ranked by MAP bioburden.
Phases of whole-herd fecal, blood, milk, and pen environmental sample collection from a 3,577-cow Jersey herd in California and testing for Mycobacterium avium subsp. paratuberculosis.*
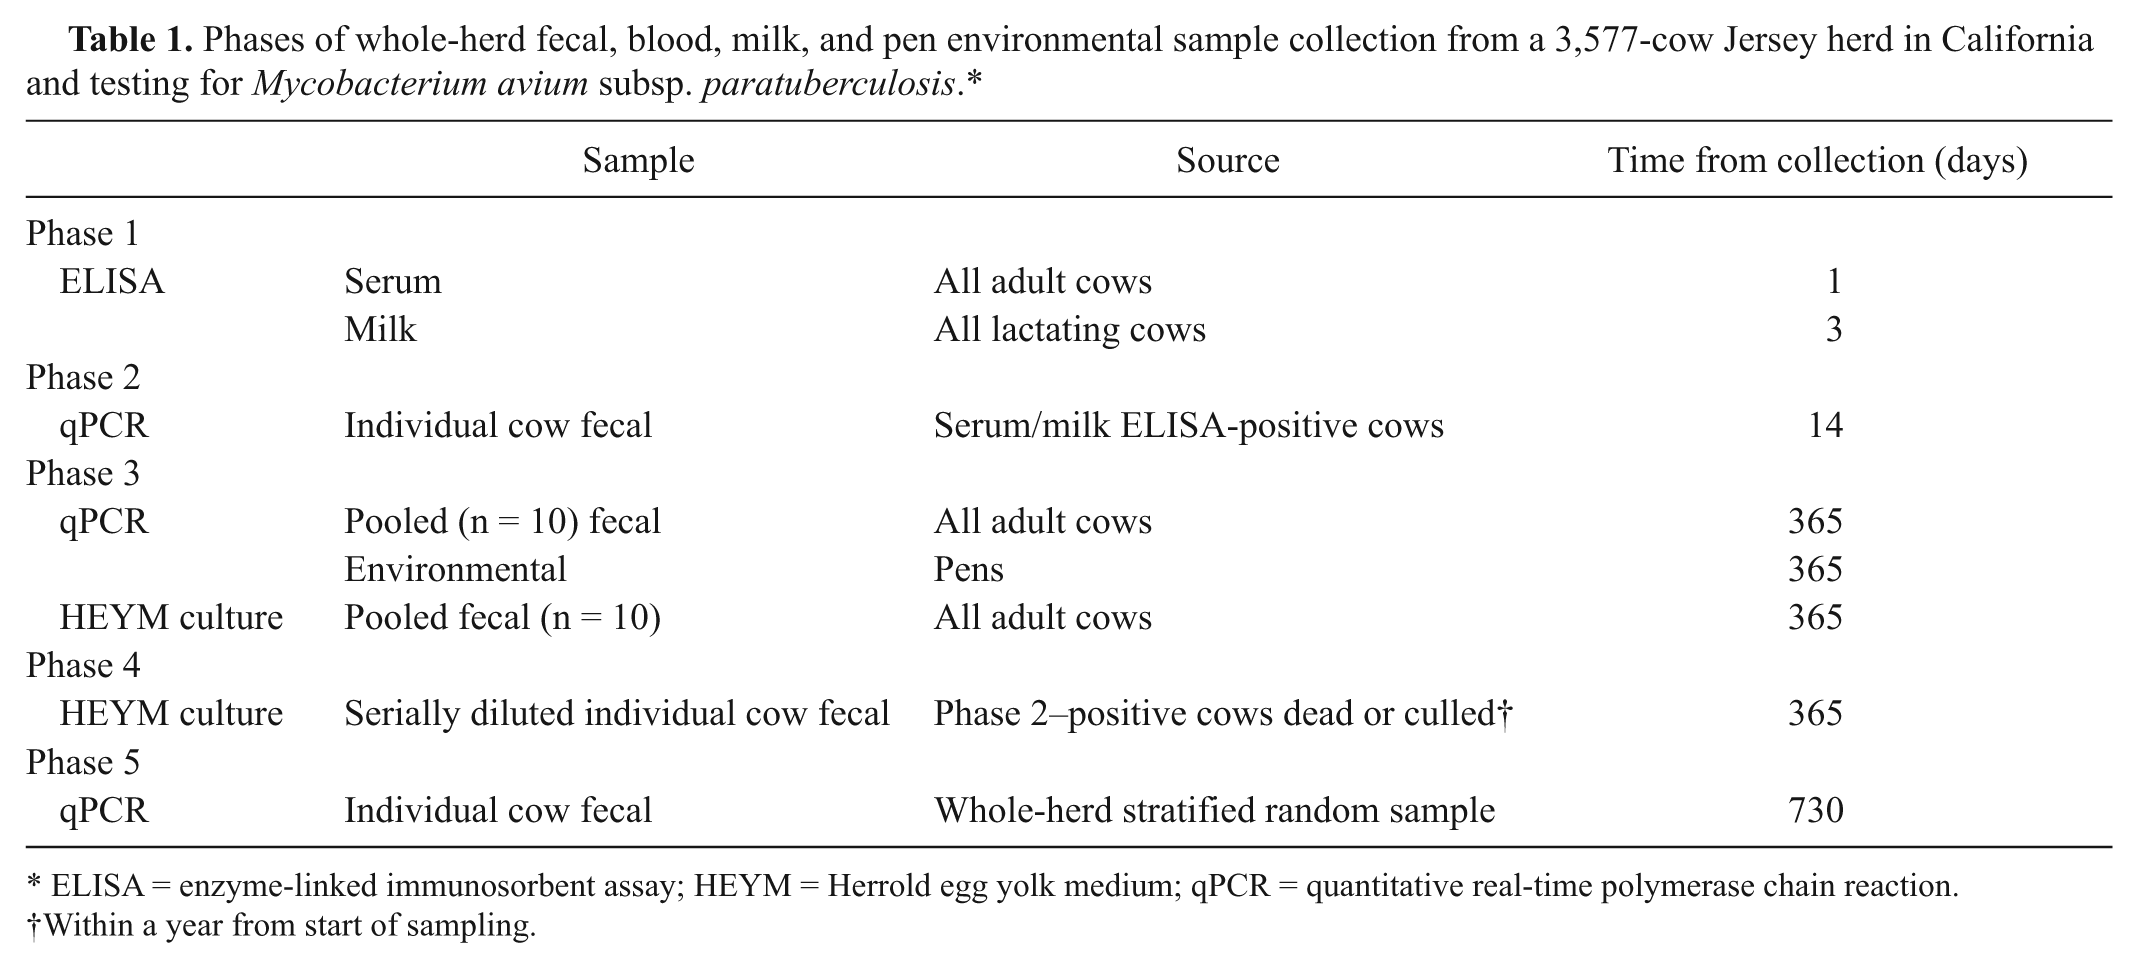
ELISA = enzyme-linked immunosorbent assay; HEYM = Herrold egg yolk medium; qPCR = quantitative real-time polymerase chain reaction.
Within a year from start of sampling.
Super-shedders were identified over the remaining 2 testing phases, using HEYM culture results (phase 4) and qPCR results (phase 5). In phase 4, repository fecal samples of cows that were culled or died later and that either had a serum or milk ELISA-positive result were identified, thawed, serially diluted 1:1, 1:10, and 1:100, cultured on HEYM in 3 flasks per dilution, and results reported as CFU/g of feces. A super-shedder was classified as a cow with an estimate of >10,000 CFU/g of feces.
In phase 5, a stratified random sample of the whole herd based on qPCR results of fecal pools was created. First, the entire Ct results range for pooled fecal samples was categorized into incremental intervals of 2-Ct units (range: 22–50 Ct). Repository fecal samples of individual cows represented by the pools in the lowest Ct interval (highest MAP DNA concentration) were identified and tested by qPCR. If a sample tested below the mean Ct (26.1) for qPCR of fecal samples from the super-shedders identified in phase 4, then the next higher Ct interval of pools was identified and their individual cow repository samples were similarly tested by qPCR. Individual fecal samples represented by pools in the 34–36 Ct range tested above 26.1 Ct and hence contained no suspect super-shedders. To decrease the probability of failing to detect a super-shedder, repository individual cow fecal samples identified in pools from an additional 2-Ct interval (36–38 Ct) were tested by qPCR, and the upper Ct limit of the first stratum (38 Ct) marked. Fecal samples from suspect super-shedders identified in this phase were thawed, serially diluted, and cultured on HEYM.
Second, using the qPCR manufacturer’s cutoff value of >42 Ct for a negative test result, the remaining pools were divided into 2 strata: stratum 2 containing individual samples from pools that tested >38 to ≤42 Ct; and stratum 3 containing individual samples that tested >42 Ct. Using the random number generator in a commercial software package, j a random sample of 10 pools from strata 2 and 3 were selected and repository fecal samples of their respective 100 cows identified and tested using qPCR. The allocation of the 10 pools between the 2 strata was proportional to the percentage of CFU counted on HEYM tubes of cultured fecal pools for stratum 2 (>38–42 Ct) and stratum 3 (>42–50 Ct).
Diagnostic strategies
The strategies selected (Table 2) reflect appropriate choices for identification of super-shedders on a large dairy. Hence, a strategy may not necessarily include all the diagnostic tests conducted on the study cows. For example, in strategy 1, qPCR testing of all the herd fecal pools was performed to classify pools into 1 of 3 strata, as described in the previous section. In the second stage of strategy 1, a stratified random sample of individual cow fecal samples was tested by qPCR (all the samples in stratum 1; i.e., samples from pools with the highest MAP bioburden, followed by individual fecal samples from a random sample of pools in strata 2 and 3). In all strategies, qPCR was preferable to HEYM culture because results could be obtained in less than 1 week.
Diagnostic strategies considered for identification of Mycobacterium avium subsp. paratuberculosis super-shedders on a 3,577-cow dairy in California.*

Super-shedders are defined as cows that shed >10,000 colony forming units of Mycobacterium avium subsp. paratuberculosis (MAP) per gram of feces. ELISA = enzyme-linked immunosorbent assay; qPCR = quantitative real-time polymerase chain reaction.
Stratified random sample of fecal samples from the whole herd. Fecal pools were categorized into 1 of 3 strata based on their MAP qPCR results (stratum 1, 2, and 3 in decreasing order of MAP DNA concentration).
Pool of 10 fecal samples
Samples of cows from stratum-1 pools (highest MAP DNA concentration) only were selected for further testing in the subsequent stage of a strategy.
Serum if cow was nonlactating, and milk if cow was lactating.
Once results from all testing phases were available, each diagnostic strategy in Table 2 was evaluated and the number of super-shedders that may have been identified recorded. The cutoff to identify an aggregate sample for further testing in a diagnostic strategy was based on test results from the previous 5 testing phases. Specifically, in strategies with qPCR testing of fecal pools, the upper limit of the highest Ct pool interval with super-shedders was the cutoff used to identify pools for further individual cow testing. For diagnostic strategies that included environmental samples, pens on the dairy were ranked by Ct, the pens housing suspect super-shedders identified, and the mean Ct of their environmental samples used as the cutoff to identify pens for subsequent testing. For strategies based on serum and milk ELISA, a positive test result qualified the cow for further testing. Receiver operating characteristic (ROC) analysis was used to determine an appropriate cutoff to identify super-shedders using qPCR compared to culture of serially diluted samples on HEYM as the reference test. The ROC analysis included cows identified in 2-Ct increments starting with the lowest Ct result (highest MAP concentration) to an additional 2-Ct interval above the interval identifying the final super-shedder.
The final diagnostic test in all strategies was qPCR to quantify MAP in individual cow fecal samples. Furthermore, HEYM culture of serially diluted fecal samples of identified super-shedders was used to quantify and verify their super-shedder status.
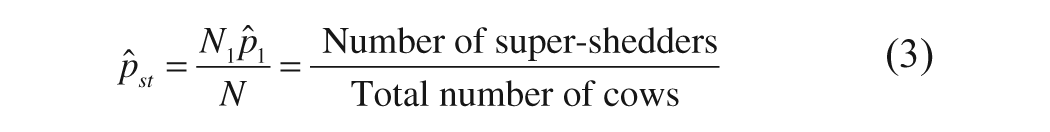
Prevalence of MAP super-shedder cows
The prevalence of super-shedders (

where N is the total number of pools in the herd (358), Ni is the number of pools in stratum i {i = 1, 2, 3}, and
The percentage of super-shedders among cows positive on serum or milk ELISA was calculated as the number of ELISA-positive super-shedders in the herd divided by the number of ELISA-positive cows. In contrast, the percentage of ELISA-positive cows among super-shedders was calculated as the number of ELISA-positive super-shedders divided by the number of super-shedders tested by ELISA. In both percentages involving milk ELISA, super-shedders with zero milk production and hence no milk ELISA results were treated as if they were nonlactating cows. In a second scenario, such cows were included in the denominator, and their serum ELISA status was used as their milk ELISA result.
Sample collection and test costs
Labor costs were based on expert opinion from field personnel including veterinarians and technicians. Pre– and post–sample collection labor included preparation for the whole-herd test, ordering required supplies, organization, transport, cow identification using back tags, recording, sample processing, handling and shipping, and was assumed to be performed by non-veterinary-trained labor (e.g., office staff or dairy employee) at $12.50/hr assuming 25% cost of employment (e.g., benefits, insurance, etc.). Fecal, blood, and pen environmental samples were assumed to have been collected by veterinarians at a cost of $125/hr assuming 25% cost of employment.
The total cost of supplies and shipping of a sample to the testing laboratories from California was estimated using actual costs incurred for supplies and shipping and which were calculated at $1.20 for an individual fecal sample, $10.20 for a pool of 10 individual fecal samples, and $6.90 for an environmental sample. For a serum and milk sample, supplies and shipping were estimated at $0.60 and $0.50, respectively.
Actual fees charged by the study laboratories were used in estimating costs. The cost of an HEYM culture varied by the type of fecal sample. For an individual cow fecal sample, serial dilutions of an individual fecal sample, fecal pool, and an environmental sample, the costs were $30, $50, $45, and $30, respectively. Similarly, the cost of qPCR testing of an individual cow fecal sample, fecal pool, and an environmental sample was $35, $45, and $35, respectively. The charge for serum and milk ELISA was $7.30 and $5, respectively.
Estimation of diagnostic strategy cost-effectiveness
The effectiveness of a diagnostic strategy was estimated as its sensitivity to detect super-shedders (number of super-shedders identified by the strategy divided by the total number of super-shedders in the whole herd).
The detection cost per super-shedder cow for each diagnostic strategy was based on its mean cost-effectiveness ratio (MCER). 8 The MCER (cost/super-shedder identified) was used rather than the conventional cost per unit sensitivity because of its easier interpretability. The incremental cost-effectiveness ratio (ICER) 8 was calculated to determine if a diagnostic strategy was cost-effective compared to a reference, that being the strategy with the lowest MCER. The ICER was calculated as:
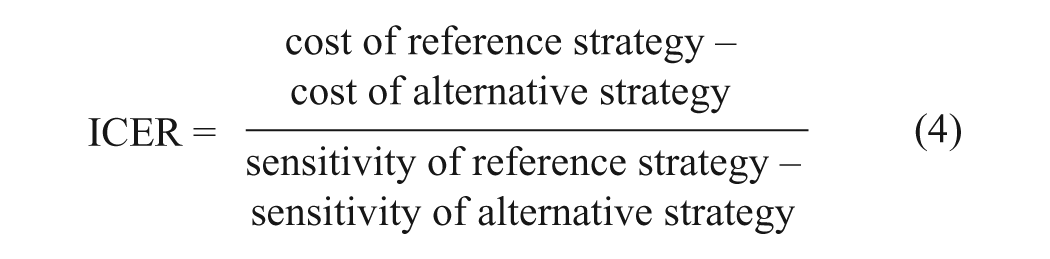
The strategy with the lowest ICER was considered the most cost-effective alternative to the reference strategy. The ICER may be interpreted as an estimate of the cost per unit gain in sensitivity by using the alternative compared with the reference strategy. Strategies that cost more and were less sensitive than the reference were considered unacceptable and were excluded from the analysis.
Results
Diagnostic testing phases 1 to 5
In phase 1, 125 (3.5%) of 3,577 cows and 91 (3.1%) of 2,942 cows were positive for MAP on serum and milk ELISA, respectively. Of the 2,942 cows tested by both serum and milk ELISA, 63 (2.1%) cows tested positive on both assays.
In phase 2, 87 (69.6%) and 58 (63.7%) of the serum and milk ELISA-positive cows, respectively, tested positive (<42 Ct) for MAP DNA in feces by qPCR. Of the 63 cows positive for MAP antibodies in both serum and milk, 47 (74.6%) were MAP positive based on qPCR testing of feces.
In phase 3, qPCR results for pooled fecal samples ranged from 22 to 50 Ct, and HEYM culture results ranged from 0 to >300 CFU/tube. Table 3 summarizes qPCR results of fecal pools and environmental samples by pen.
Results of quantitative real-time polymerase chain reaction (qPCR) for Mycobacterium avium subsp. paratuberculosis (MAP) in environmental samples and fecal pools (based on a whole-herd stratified random sample) from a 3,577-cow dairy in California.*
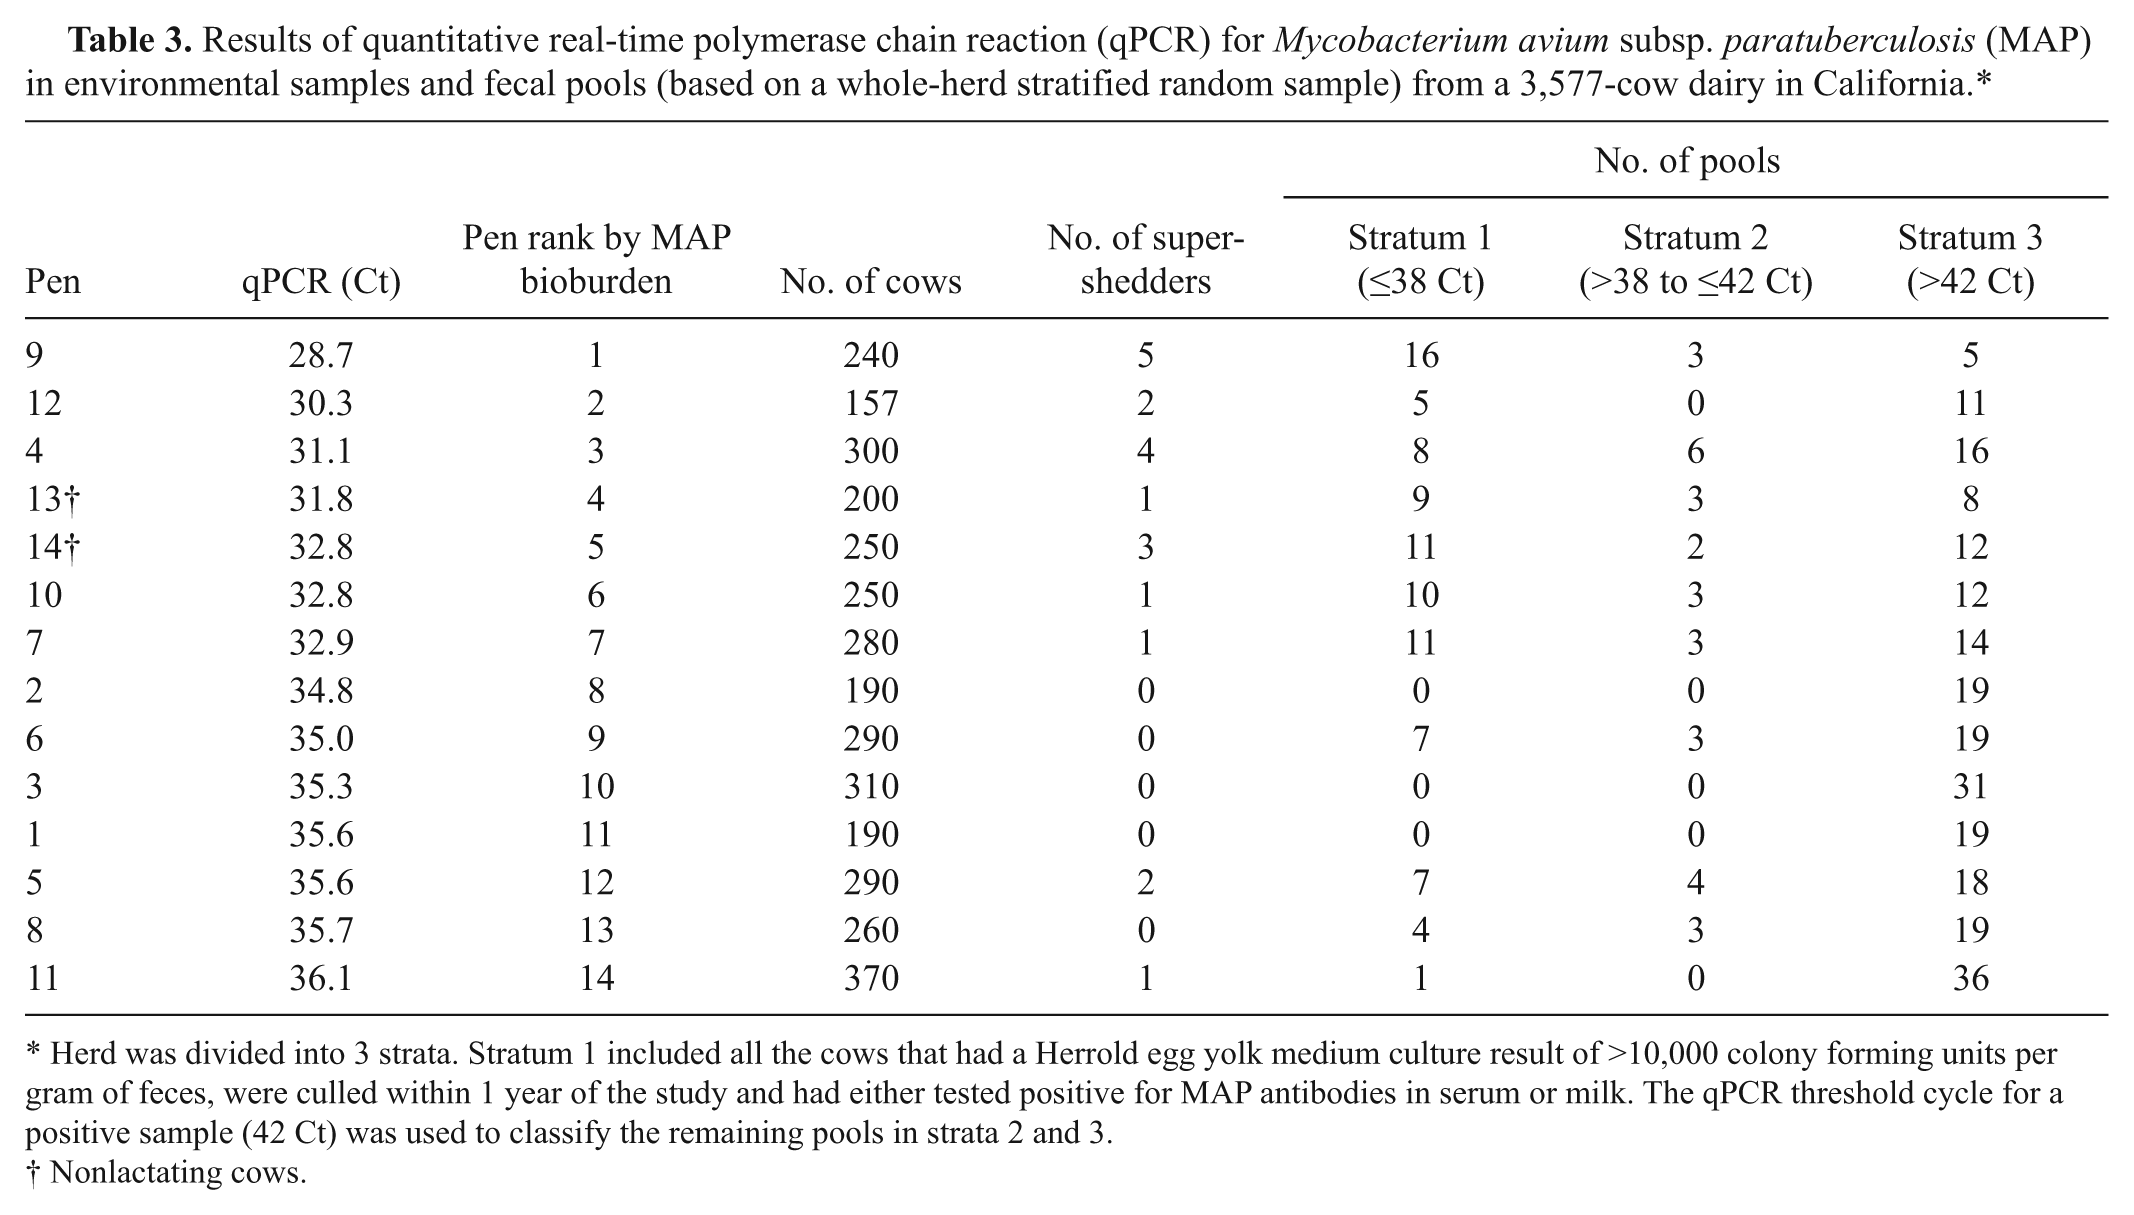
Herd was divided into 3 strata. Stratum 1 included all the cows that had a Herrold egg yolk medium culture result of >10,000 colony forming units per gram of feces, were culled within 1 year of the study and had either tested positive for MAP antibodies in serum or milk. The qPCR threshold cycle for a positive sample (42 Ct) was used to classify the remaining pools in strata 2 and 3.
Nonlactating cows.
In phase 4, fecal samples from the 30 cows that were culled within a year of the onset of the study and that had either tested positive for MAP antibodies in serum or milk were each serially diluted and cultured on HEYM. Ten (33.3%) were identified as super-shedders (median 63,000 CFU/g of feces). The mean (SD) qPCR of the 10 fecal pools that included these super-shedders was 29.2 Ct (2.4) and ranged from 26.1 to 34.4 Ct. The mean (SD) CFU/tube based on all 40 tubes of the 10 fecal pools representing the 10 ELISA-positive super-shedders that were no longer in the herd was 39.3 CFU/tube (39.1) and ranged from 0 to 150 mean CFU/tube.
In phase 5, 10 additional cows tested ≤26.1 Ct on individual fecal qPCR and were from pools with ≤36 Ct. Cows in the 36.0–38.0 Ct pools did not test ≤26 Ct (mean (SD) 47.4 Ct (4.7); range: 32–50 Ct). Of those 10, 8 were confirmed super-shedders (median 28,000 CFU/g of feces). In investigating the qPCR cutoff for identifying super-shedders and culturing fecal samples of cows that tested <32 Ct, 1 additional super-shedder was identified (14,000 CFU/g feces) that had tested at 29.4 Ct by qPCR. Hence, 19 super-shedders were identified and confirmed using culture of serially diluted fecal samples from individual cows.
The remaining pools that tested >38 Ct were categorized into 30 pools in stratum 2 (38 < Ct ≤ 42) and 239 pools in stratum 3 (>42 Ct). A total of 24 CFU (61.5%) and 14 CFU (38.5%) were cultured from the pools in stratum 2 and 3, respectively. Hence, a random sample of 6 and 4 pools from strata 2 and 3, respectively, were selected for qPCR of their constituent fecal samples. The qPCR results of the 100 individual cow fecal samples ranged from 36 to 50 Ct. In summary, the whole-herd stratified random sample based on qPCR results of fecal pools was comprised of 890, 60, and 40 individual cow fecal samples from strata 1, 2, and 3, respectively. In addition to the random samples selected from stratum 2, qPCR results of fecal samples from 75 additional cows that existed (qPCR results mean [SD] = 45.5 [5.8] Ct) as part of phase 1 did not identify additional super-shedders. Thus, the total number of cows tested by qPCR was 1,065 (30% of study herd).
Diagnostic thresholds
The upper limit of the highest Ct pool interval with a super-shedder was 36 Ct. To be conservative, 38 was used as the qPCR Ct cutoff value to identify pools for further individual cow testing. Environmental samples from pens housing suspect super-shedders had a mean of 32.4 Ct, which was used as the cutoff to identify pens for subsequent testing. An S/P ratio ≥0.25 and optical density value of ≥0.07 were used to identify seropositive and milk ELISA-positive cows, respectively. The fecal sample from the lowest shedding super-shedder had a qPCR Ct result of 29.4 and hence, cows in an additional 2-Ct range were identified and their fecal samples serially diluted and cultured on HEYM. ROC analysis was based on 54 cows that had qPCR results from 18.2 to 32.0 Ct. Based on ROC analysis, 25.9 Ct was selected as the cutoff to identify super-shedders using qPCR on individual cow fecal samples compared with the reference test (culture of serially diluted samples on HEYM). The 32-Ct endpoint for serial dilution and culture was conservative and based on the highest qPCR result (29.4 Ct) for super-shedders identified in the present study.
Super-shedders
The 19 super-shedders identified from the 5 testing phases had a median 30,800 CFU/g of feces and CFU values that ranged from 12,600 to 1,260,000/g (Table 4). The cutoff used to identify super-shedders in the diagnostic strategies was 25.9 Ct based on the ROC curve analysis, which maximized the percentage of correctly identified cows (87%) with an area under the curve of 0.88 (95% confidence interval: 0.77–0.96), sensitivity of 73.7%, and specificity of 94.3%. Fecal samples from the 19 super-shedders were constituents of 19 different pools that had a median of 23.5 CFU/tube (range: 5 to >300 CFU/tube), and a mean (SD) qPCR result of 28.0 (2.9) Ct (range: 22.1–34.4 Ct). Of the 19 cows, 10 were lactating, 6 were in their dry period, and 5 were in the hospital pen. Two of the super-shedder cows in milking pens produced “no milk” in their last DHIA monthly milk test and died within 5 days of initial sampling.
Cows shedding Mycobacterium avium subsp. paratuberculosis (MAP) in excess of 10,000 colony forming units (CFU)/gram of feces identified in a 3,577-cow dairy in California using quantitative real-time polymerase chain reaction testing of a stratified random sample of whole-herd, serum, and milk enzyme-linked immunosorbent assay (ELISA), and their fecal sample result tested individually and pooled with 9 other samples.*
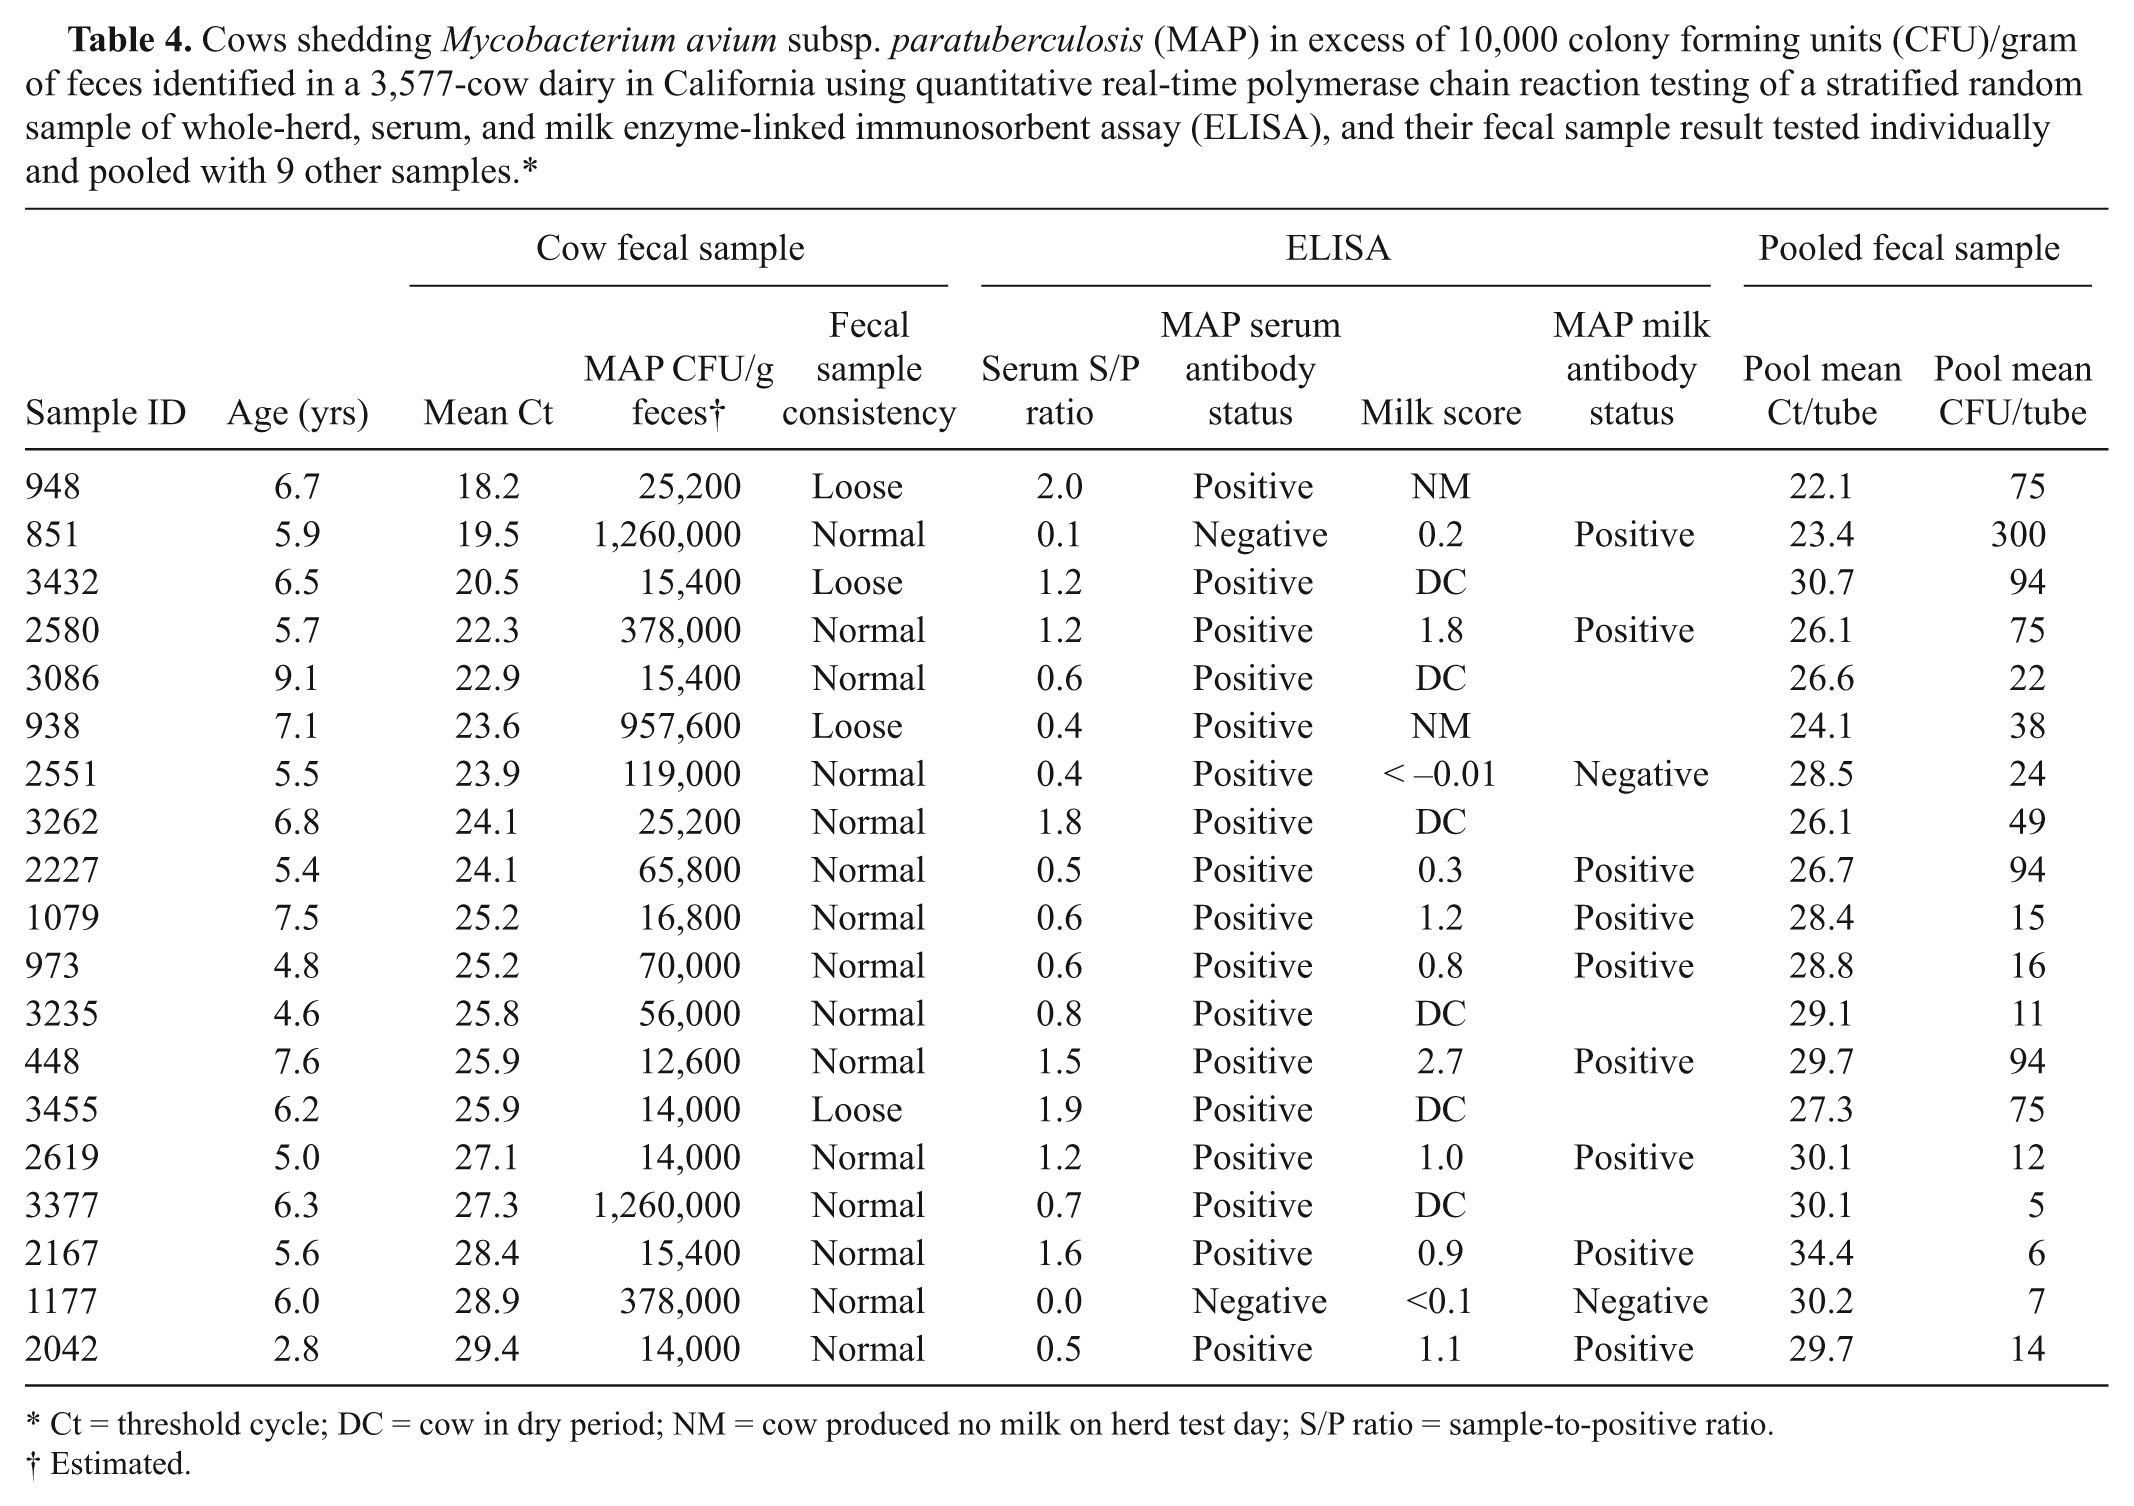
Ct = threshold cycle; DC = cow in dry period; NM = cow produced no milk on herd test day; S/P ratio = sample-to-positive ratio.
Estimated.
Diagnostic strategies
Table 5 summarizes the number of cows eligible for testing, costs involved, and number of super-shedders identified by strategy. For the whole-herd stratified random sample (strategy 1), 16 cows were identified as potential super-shedders (≤25.9 Ct), 14 of which were confirmed super-shedders with a sensitivity of 73.7%. Environmental samples from pens 4, 5, 7, 9, 10, 11, 12, 13, and 14 that housed the 19 super-shedders had a mean (SD) of 32.4 (2.4) Ct (range: 28.7–36.1 Ct). Only pens 4, 9, 12, and 13 had environmental samples with qPCR values of <32.4 Ct and thus were eligible for further testing depending on the strategy.
Results, costs (in U.S. dollars), number of Mycobacterium avium subsp. paratuberculosis super-shedders identified, and sensitivities of 11 diagnostic strategies to identify super-shedders in a 3,577-cow dairy in California.*
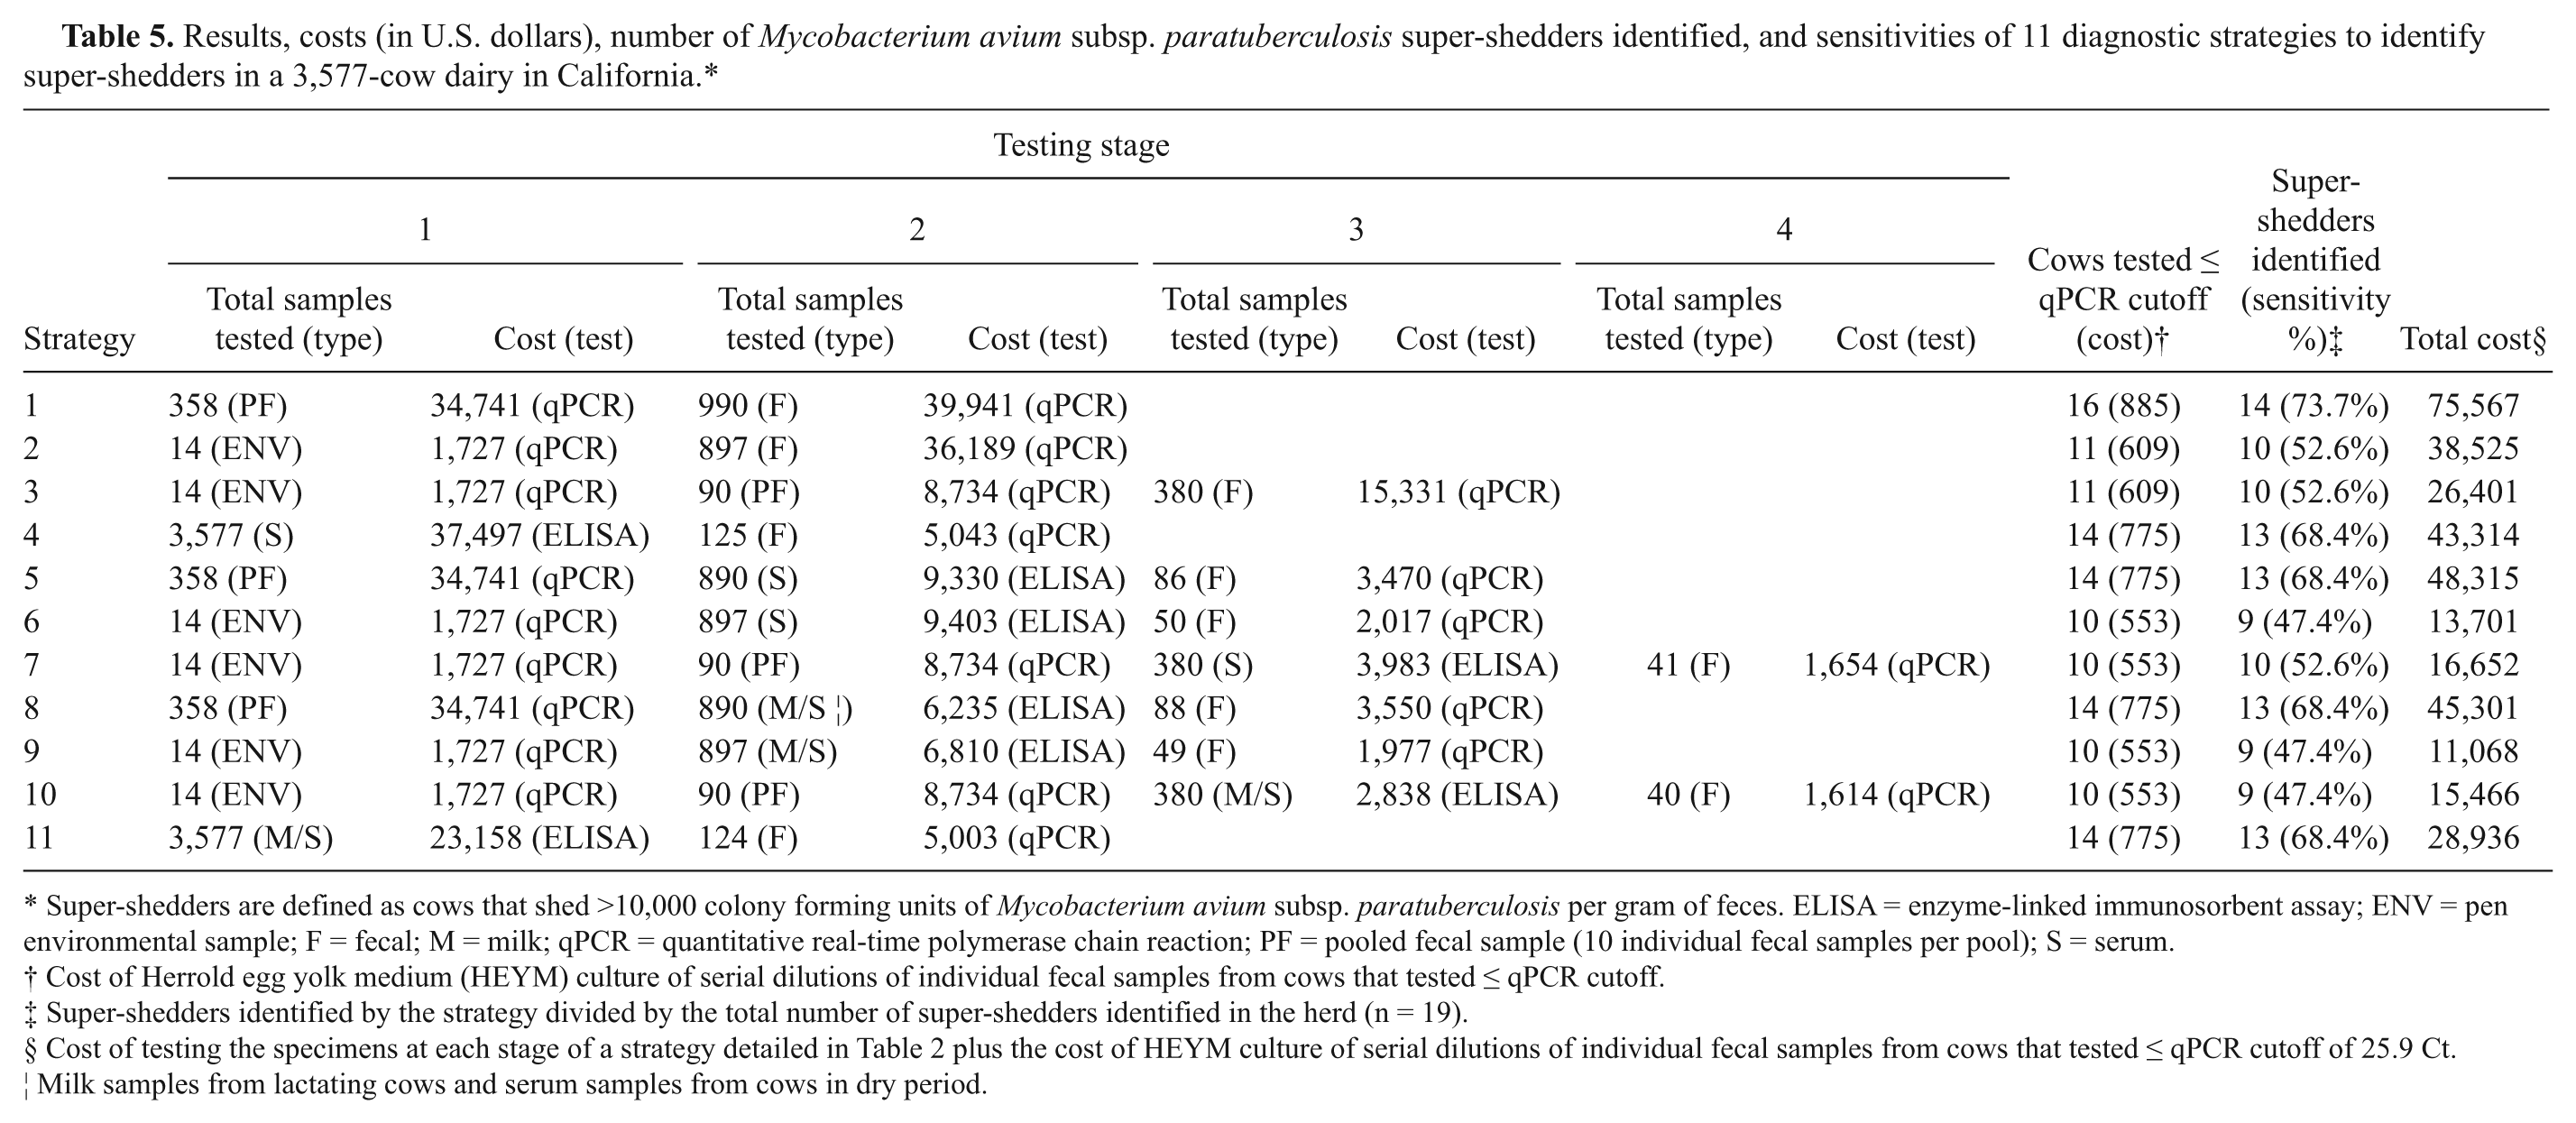
Super-shedders are defined as cows that shed >10,000 colony forming units of Mycobacterium avium subsp. paratuberculosis per gram of feces. ELISA = enzyme-linked immunosorbent assay; ENV = pen environmental sample; F = fecal; M = milk; qPCR = quantitative real-time polymerase chain reaction; PF = pooled fecal sample (10 individual fecal samples per pool); S = serum.
Cost of Herrold egg yolk medium (HEYM) culture of serial dilutions of individual fecal samples from cows that tested ≤ qPCR cutoff.
Super-shedders identified by the strategy divided by the total number of super-shedders identified in the herd (n = 19).
Cost of testing the specimens at each stage of a strategy detailed in Table 2 plus the cost of HEYM culture of serial dilutions of individual fecal samples from cows that tested ≤ qPCR cutoff of 25.9 Ct.
Milk samples from lactating cows and serum samples from cows in dry period.
Prevalence of MAP super-shedder cows
Of the 19 super-shedders identified, none contributed to fecal pools in stratum 2 or 3 of the herd’s stratified random sample. Hence, the prevalence of super-shedders was estimated as 0.5% (19/3577) with a 95% confidence interval of 0.3–0.8%. The prevalence of super-shedders in the MAP qPCR-positive cows was 10% (19/190) with a 95% confidence interval of 6.1–15.2%. The percentage of super-shedders among serum ELISA-positive cows was 13.6% (17/125); in milk ELISA, suspect and positive cows was 9.9% (9/91). In the latter, if serum ELISA results of the 2 super-shedders with zero milk production were substituted for their missing milk ELISA results (similarly included in the denominator) then the percentage of super-shedders among milk ELISA-positive cows would have been 11.8% (11/93). The percentage of super-shedders that tested positive by serum ELISA was 89.5% (17/19), and the percentage of super-shedders that tested positive by milk ELISA was 81.8% (9/11). If serum ELISA results of the 2 super-shedder cows with zero milk production replaced their missing milk ELISA results, the percentage of milk ELISA-positive cows among super-shedders would have been 84.6% (11/13).
Cost-effectiveness analyses
Diagnostic strategies ranged in sensitivity from 47% to 74% and cost from $11,068 to $75,567 (Table 6). Strategy 1, the whole-herd stratified random sample tested using qPCR, yielded the highest sensitivity and had the highest cost per super-shedder identified (MCER $5,398). In contrast, strategy 9, considered the reference to which other strategies were compared in the cost-effectiveness analyses because it had the lowest cost MCER ($1,230), was the least sensitive. Strategies 6 and 10 had the same sensitivity as the reference but were not included in the analysis because they cost more. The most cost-effective alternative to the reference strategy was strategy 11 because it had the lowest ICER ($851). Of the 11 strategies, only strategy 2 had incomplete test results, specifically, qPCR results of individual fecal samples from 481 of the 897 cows. The 481 cows (53.6%) that tested negative on serum and milk ELISA were constituents of fecal pools that tested >38 Ct and hence, were assumed to be qPCR negative. However for cost calculations, the cost of testing all 897 cows using qPCR was considered to avoid biasing the cost-effectiveness analyses.
Cost-effectiveness for 11 diagnostic strategies to identify Mycobacterium avium subsp. paratuberculosis super-shedders on a 3,577-cow dairy in California.*
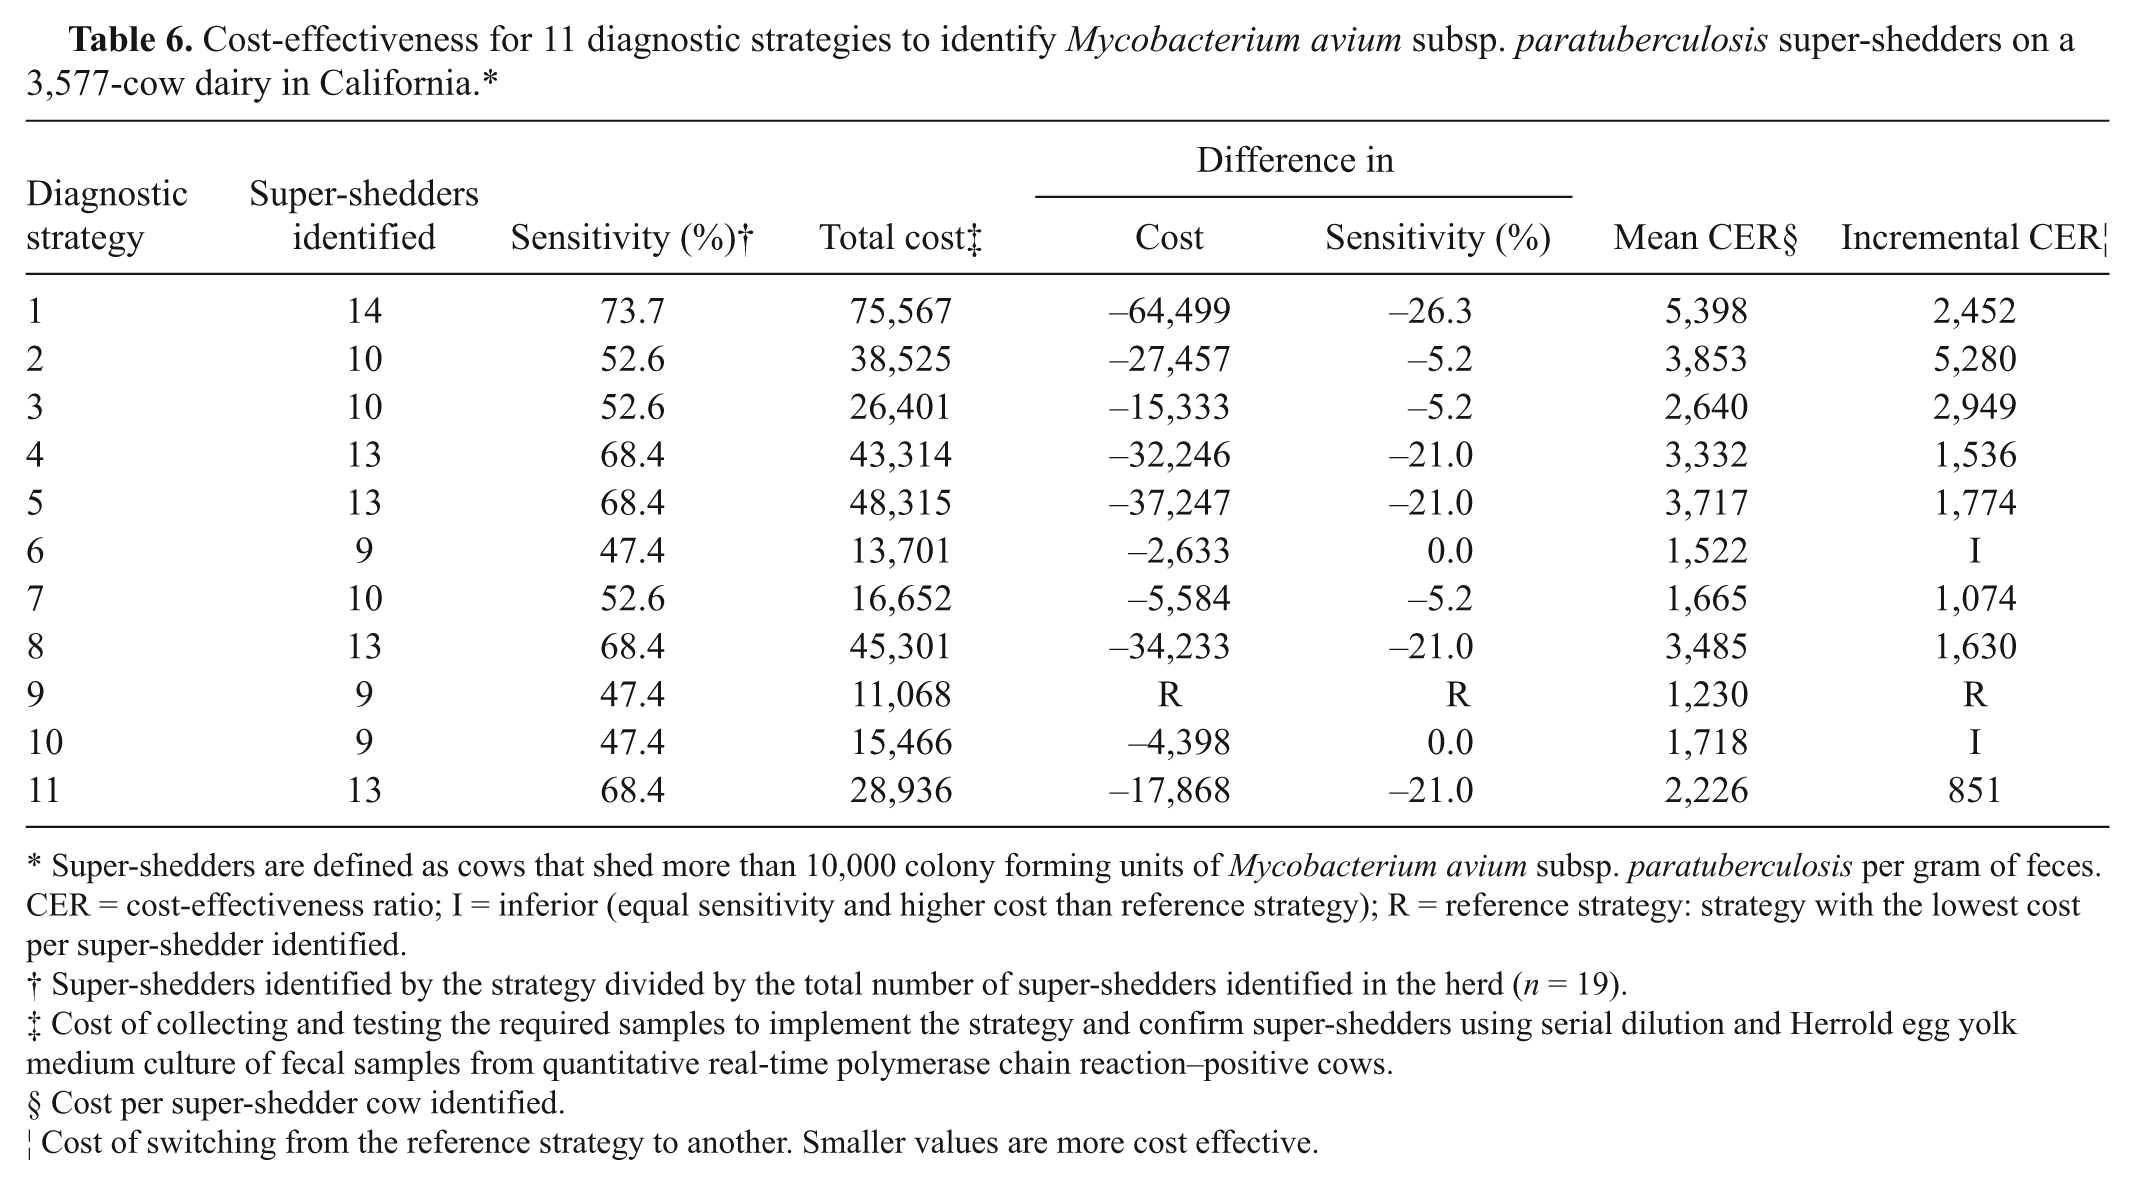
Super-shedders are defined as cows that shed more than 10,000 colony forming units of Mycobacterium avium subsp. paratuberculosis per gram of feces. CER = cost-effectiveness ratio; I = inferior (equal sensitivity and higher cost than reference strategy); R = reference strategy: strategy with the lowest cost per super-shedder identified.
Super-shedders identified by the strategy divided by the total number of super-shedders identified in the herd (n = 19).
Cost of collecting and testing the required samples to implement the strategy and confirm super-shedders using serial dilution and Herrold egg yolk medium culture of fecal samples from quantitative real-time polymerase chain reaction–positive cows.
Cost per super-shedder cow identified.
Cost of switching from the reference strategy to another. Smaller values are more cost effective.
Discussion
Diagnostic strategies considered in the present study successfully identified super-shedders with varying cost-effectiveness depending on the diagnostic test, specimen type, and type of labor used in sample collection and processing. Testing of feces or environmental slurry samples by qPCR was useful in the identification of super-shedders because results were available in a similar timeframe to ELISA testing. Once a super-shedder was identified, culture of serially diluted fecal samples was used to confirm the shedding levels, thus adding confidence to the study findings.
In large herds similar to the study herd, a veterinarian whose testing purpose is to identify MAP super-shedders may elect to use qPCR testing of fecal samples from ELISA-positive cows (milk and serum from milking and dry cows, respectively) in high MAP bioburden pens (strategy 9). Such an approach is expected to cost the least ($1,230) per super-shedder identified with a sensitivity of 47.4%. If a higher sensitivity is required, the most cost-effective alternative may be to perform a whole-herd ELISA (milk and serum for milking and dry cows, respectively) followed by qPCR testing of fecal samples from ELISA-positive cows (strategy 11). The investigator may expect an increase in sensitivity to 68.4% and a total cost of $851 per unit sensitivity increased or $2,226 per super-shedder identified. The second most cost-effective alternative would be to qPCR test fecal samples of seropositive cows contributing to qPCR-positive fecal pools from cows housed in pens with the highest MAP bioburden (strategy 7). The investigator may expect an increase in sensitivity to 52.6% and a total cost of $1,074 per unit sensitivity increased or $1,665 per super-shedder identified. Alternative strategies may have greater sensitivity but may cost more. Finally, the investigator may attain the highest sensitivity by electing to use a whole-herd stratified random sample based on qPCR results of fecal pools as in the present study and expect 73.7% sensitivity for a total cost of $5,398 per super-shedder identified. For such an approach, fecal samples may be collected from the whole herd, pooled into fecal pools of 10 samples, and tested by qPCR. Subsequently, fecal samples of cows identified in fecal pools of ≤38 Ct can be tested by qPCR, and a random sample of the remaining cows tested depending on the frequency of pools in the 38.1–42 Ct and >42–50 Ct range. Such a strategy may have the highest sensitivity but will cost the most compared to other alternatives. One of the limitations of such a strategy is the assumption that the remaining untested cows were not super-shedders. Although more super-shedders may have been identified using a whole-herd test, the cost of $126,268 ($35.30 per sample) and $144,151 ($40.30 per sample) for culture or qPCR, respectively, to detect more, but not all, the super-shedders may have been economically unjustifiable.
A variant of strategy 4 that includes a whole-herd serum ELISA could have been to identify and cull cows with a high likelihood of being infected such as those with a S/P ratio >1.0. 4 Selection of cows based on this criterion would have identified 6 super-shedders, confirmed by fecal culture on HEYM from 41 seropositive cows that tested ≤25.9 Ct. The latter would have cost $39,538 and had a sensitivity of 31.6%. In comparison, a variant of strategy 11 using ELISA testing of milk samples would have cost $23,158 and had a similar sensitivity of 31.6%. However, the potential for sample mix-up may be higher when harvesting milk samples through routine DHIA milk testing, and only lactating cows are eligible for milk ELISA testing.
Sensitivity was considered the most important parameter in the cost-effectiveness analysis for comparison of strategies because the sensitivity of MAP organism–detection tests is a greater challenge than specificity. Potential super-shedders identified using qPCR, the final test in all the diagnostic strategies evaluated, were verified using serial dilution of feces and culture on HEYM. Hence, there were no false-positive super-shedders in the cost-effectiveness analysis. Another alternative would have been to select specificity as the main effectiveness parameter. In this alternative approach, the study would have identified the most cost-effective strategy to detect non–super-shedder cows, an outcome which may not be practical. Even so, investigators may not be able to confirm the super-shedder status of cows identified when implementing a diagnostic strategy because of the typical 4-month turnaround time from sample submission to HEYM culture results. In such cases, false-positive super-shedder cows are possible as evident in Table 5. Although strategy 7 yielded no false positives, all strategies except 1 and 7 had a single false-positive super-shedder (qPCR 25.5 Ct, 0 colonies on HEYM culture, loose feces) that died within a week of initial sampling. Strategy 1 had an additional false-positive super-shedder (qPCR 22.5 Ct, 7,000 CFU/g feces on HEYM culture, loose feces) that was sold less than 1 week after sampling and before test results were shared with the herd manager. Although these 2 cows were classified as false-positives based on current study criteria, their clinical presentation, qPCR results, and, in one case, high CFU/g suggests that they were likely truly MAP infected.
Interestingly, pens with the most super-shedders had the highest MAP bioburden as shown by qPCR results of environmental samples presented in Table 3. The use of milk ELISA as part of a diagnostic strategy to detect super-shedders does not target the entire herd. Super-shedders housed in nonlactating pens or that produce little or no milk can be missed as occurred with 2 super-shedders (sample IDs 948 and 938 in Table 4), and hence, the combined use of milk and serum ELISA is preferable.
One limitation of the study was the use of qPCR testing instead of HEYM culture, which is considered an appropriate antemortem reference test for MAP. However, the long turnaround time for final results of culture makes it impractical given the culling rate of large dairy herds and the continuous movement of cows between pens. The rapid turnaround time for qPCR and its high correlation with culture results 2 were desirable attributes for detection of super-shedders. Although the specificity of both culture and qPCR is essentially perfect, their sensitivity is imperfect and some MAP-infected cows as evaluated by fecal shedding could have been missed. However, the relative percentage may be lower for super-shedders than for all MAP-infected cows. A whole-herd stratified random sample rather than a whole-herd test was used in the current study because the latter was too costly. Such a limitation may be addressed using future studies that compare the cost-effectiveness of the diagnostic test strategies applied to herds of different size, MAP prevalence, MAP super-shedder prevalence, and diagnostic tests, which was not possible without the results of the current study.
The choice of diagnostic tests and specimens affected the sensitivity of the diagnostic strategy for detection of super-shedders. A repeat analysis of the study data using different pay-rate scenarios resulted in varying costs of diagnostic strategies depending on the labor type (data not shown). Total cost for each diagnostic strategy decreased as costs of nonveterinary labor were substituted for costs of veterinary labor. The reference strategy (lowest cost per super-shedder identified) remained the same across the different labor options. Similarly, alternative strategies to the reference strategy maintained the same ranking by cost-effectiveness. Furthermore, a comparison of test costs using estimates from other USDA-approved laboratories (http://www.aphis.usda.gov/animal_health/lab_info_services/approved_labs.shtml) solicited by phone inquiries showed no difference in strategy ranking by cost-effectiveness. For a selected strategy, the total cost depended primarily on the type of labor to perform the sampling and sample processing.
The findings of the current study should be generalized with caution because the study was based in a single herd and variables such as breed, herd size, and MAP prevalence may be important covariates. In addition, the availability and costs of diagnostic tests may change with time. For example, the serum ELISA kit used in the present study has been phased out of the U.S. market and replaced by a new kit.
The results of the present study showed that environmental samples, collected using a standardized protocol as part of a diagnostic strategy, can improve the cost-effectiveness of detecting super-shedders. This is possible because of the rapid turnaround time for qPCR results, which allowed for sample collection and reliable ranking of pens before routine moving of cows between pens. 1 Diagnostic strategies incorporating environmental sampling identified approximately half of the super-shedders and included the strategy with the least cost per super-shedder identified. Diagnostic strategies varied in their cost-effectiveness compared to the least-cost strategy depending on the selected diagnostic tests, specimens collected, and whether they targeted lactating cows or the whole herd.
Footnotes
Acknowledgements
The authors thank the owners of the study dairy for their cooperation, the Veterinary Medical Officers and Livestock Inspectors from the California Department of Food and Agriculture, Ms. Karen Van Hoosear, and Drs. Denae Wagner, Megan Kay, Reza Jafarzadeh, and Alda Pires for technical assistance.
a.
ESP para-JEM culture system II, Trek Diagnostic Systems Inc., Sun Prairie, WI.
b.
Whirl-Pak, Nasco, Ft. Atkinson, WI.
d.
BD, Franklin Lakes, NJ.
h.
SmartCycler, Cepheid Inc., Sunnyvale, CA.
i.
HerdChek, IDEXX Laboratories Inc., Westbrook, ME.
j.
Microsoft Excel 2007, Microsoft Corp., Redmond, WA.
Declaration of conflicting interests
The author(s) declared no potential conflicts of interest with respect to the research, authorship, and/or publication of this article.
Funding
The author(s) disclosed receipt of the following financial support for the research, authorship, and/or publication of this article: This work was supported by the Center for Food Animal Health School of Veterinary Medicine, University of California, Davis; and USDA:CSREES award (2007-35204-18391).