
Abstract
A multiplex DNA microarray chip aimed at the identification of allelic polymorphisms was developed for simultaneous detection of swine disease resistance genes underlying malignant hyperthermia (RYR), postweaning diarrhea, edema disease (FUT1), neonatal diarrhea (MUC4), and influenza (MX1). The on-chip detection was performed with fragmented polymerase chain reaction (PCR)–amplified products. Particular emphasis was placed on the reduction of the number of PCR reactions required. The targets were biotin labeled during the PCR reaction, and the arrays were detected using a colorimetric methodology. Target recognition was provided by specific capture probes designed for each susceptible or resistant allelic variant. Sequencing was chosen as the gold standard to assess chip accuracy. All genotypes retrieved from the microarray (476) fit with sequencing data despite the fact that each pig was heterozygote for at least 1 target gene.
Introduction
During the past decades, genetic selection of pigs focused on production traits such as growth rate, carcass weight, number of piglets weaned per year, and, more recently, quality of meat. However, increasing production performance has led to increased susceptibility to several diseases that significantly affect profitability of breeding farms. Accordingly, there is now a trend toward selection schemes that incorporate criteria known to detect innate resistance to diseases, among which influenza, malignant hyperthermia, neonatal and postweaning diarrheas, and edema disease are of major importance in pig farms. Because of this irreversible trend in animal breeding, there is a need to develop new tools allowing large-scale detection of animals transmitting favorable alleles to their progeny. The current study took advantage of the fact that alleles conferring resistance to the aforementioned series of pig diseases were recently described.9,13,18,26
In general, MX genes are known to encode for antiviral proteins interfering with the replication of RNA viruses (mainly viruses belonging to the Orthomyxoviridae and Paramyxoviridae families). 28 Practically speaking, only some isoforms confer resistance to these viruses. The 3 allelic polymorphisms detected in pig populations consist of 1) a silent substitution (G2065T), 2) a 11-bp deletion (2064-GGCGCCGGCTC-2074), and 3) a 3-bp deletion (1793-TCG-1795; Fig. 1C).21,23 Three different Mx1 isoforms are therefore observed in nature: α (wild-type, 663 residues), β (686 residues, encoded by the 11-bp deleted allelic variant), and γ (662, serine 565 lost). The β isoform was shown to display a loss-of-function phenotype, as expected from its very different C-terminal segment.23,26
Malignant hyperthermia is a condition that develops in genetically predisposed animals upon exposure to halogenated anesthetics.6,32 This condition is also referred to as porcine stress syndrome, which results in losses of slaughter-weight pigs during transport to the slaughter plant (dead and nonambulatory animals), which are of concern to the world swine industry from both a welfare and an economic perspective. 32 Additionally, upon slaughter, in pigs with this condition, muscle pH rapidly decreases, and muscle temperatures are elevated due to increased Ca2+ influx into myo-fibrils and resultant buildup of lactic acid. 32 This results in denaturation of muscle proteins and water loss. 32 The meat from these pigs has a pale, soft, exudative (PSE) appearance and a reduced commercial value. 22 Porcine stress syndrome results from a single coding nucleotide substitution in the RYR gene (C1843T; Arg615Cys) encoding for the skeletal ryanodine receptor (commonly called the stress gene), a protein structurally involved in calcium channels controlling movements of Ca++ from the reticulum sarcoplasm to the cytosol.9,16
Newly weaned pigs are very susceptible to F18-positive Escherichia coli (F18+ E. coli) infections leading to postweaning diarrhea or edema disease. 30 The F18 receptor (F18R) plays a crucial role in this disease by mediating the binding of F18 fimbriated bacteria to the intestinal epithelium. This leads to colonization of the gut mucosa and subsequent secretion of entero- or verotoxins and development of the respective associated disease. The swine population consists of F18R negative (F18R−) and F18R positive (F18R+) animals, and only the latter are susceptible to infection with F18+ E. coli. 8 The F18R status of pigs is genetically determined, 2 and susceptibility to F18+ E. coli infections ap-pears to be dependent on the activity of the FUT1 gene, en- coding for the alpha(1,2)-fucosyltransferase-1.17,18 Sequencing of the FUT1 gene of pigs resistant to F18+ E. coli infection revealed a transition (G→A) of both alleles at bp 307, which results in an amino acid substitution at position 103 (Ala→Thr). 18
Enterotoxigenic E. coli (ETEC) F4, previously known as K88, is also a major cause of diarrhea and mortality in neonatal and newly weaned pigs.11,20 The ETEC adheres to specific receptors on the brush borders of enterocytes of the small intestine, especially the jejunum. Colonizing bacteria produce enterotoxins that stimulate the secretion of water and electrolytes into the gut lumen of the small intestine, thus leading to diarrhea.4,5 Using an in vitro microscopic adhesion test, susceptible and resistant animals can be determined under a unanimous standard, 1 which allows the detection of genetic markers or candidate genes. Only markers have been identified, yet the markers consist of a series of intronic, biallelic, single nucleotides in the mucin-4 (MUC4) gene on porcine chromosome 13, which allow reliable prediction of ETEC-susceptible or -resistant animals (see detailed polymorphisms in Fig. 1D). 13
Techniques for typing polymorphisms include sequencing, 25 restriction fragment length polymorphism analysis, 7 single-strand conformation polymorphism (SSCP) analysis, 27 allele-specific oligonucleotide hybridization,10,15 allele-specific primer polymerase chain reaction (PCR) analysis, 12 oligonucleotide ligation assay, 14 molecular beacons–based analysis, 29 TaqMan method, 3 mass spectrometry, 19 and molecular inversion probes–based analysis. 24 In an attempt to develop an all-in-one assay able to detect the multiple gene polymorphisms associated with innate resistance to the aforementioned diseases, the current study was undertaken to build a microarray platform 31 to study allelic variants in MX1, RYR, FUT1, and MUC4.
Materials and methods
Sample material and DNA isolation
A total of 128 porcine (domestic pig, Sus scrofa domesticus) genomic DNA samples were collected from several breeds (Landrace, Piétrain, Large White, Duroc, Berkshire, KaHyb [Landrace × Large White], Gascon, and Bayeux) and from wild boar (Sus scrofa scrofa) and from different sources. Blood, hair, tail skin, or intestinal tissue DNA was extracted with a kit for DNA purification from blood, a a kit for DNA isolation from forensic samples, a and a kit for DNA purification from very small samples, a respectively. Sperm DNA was extracted as follows: germinal cells were washed 2 times in 10 mM Tris-HCl, 150 mM NaCl, and 10 mM ethylenediamine tetra-acetic acid (EDTA; pH 7.5); lyzed in 10 mM Tris-HCl, 150 mM NaCl, 10 mM EDTA, 2% sodium dodecyl sulfate, and 1 M dithiothreitol (pH 7.5) and incubated at 65°C for 1 hr. Next, proteinase K was added and incubated for 2 hr at 37°C. Then, a phenol-chloroform extraction was performed, and nucleic acids were precipitated by ethanol, dissolved in TE (10 mM Tris-HCl [pH 7.5] and 1 mM EDTA [pH 7.5]) during 24 hr at 4°C, and frozen at −20°C. Spleen tissue DNA was extracted as follows: cells were lyzed with DNAzol b and incubated for 10 min at 37°C, with shaking. Ethanol (100%) was added to precipitate genomic DNA, which was then washed with 75% ethanol, dried, eluted, and finally solubilized in water or 8 mM NaOH. Genomic DNA was quantified spectrophotometrically. c
DNA amplification and production of control polynucleotides
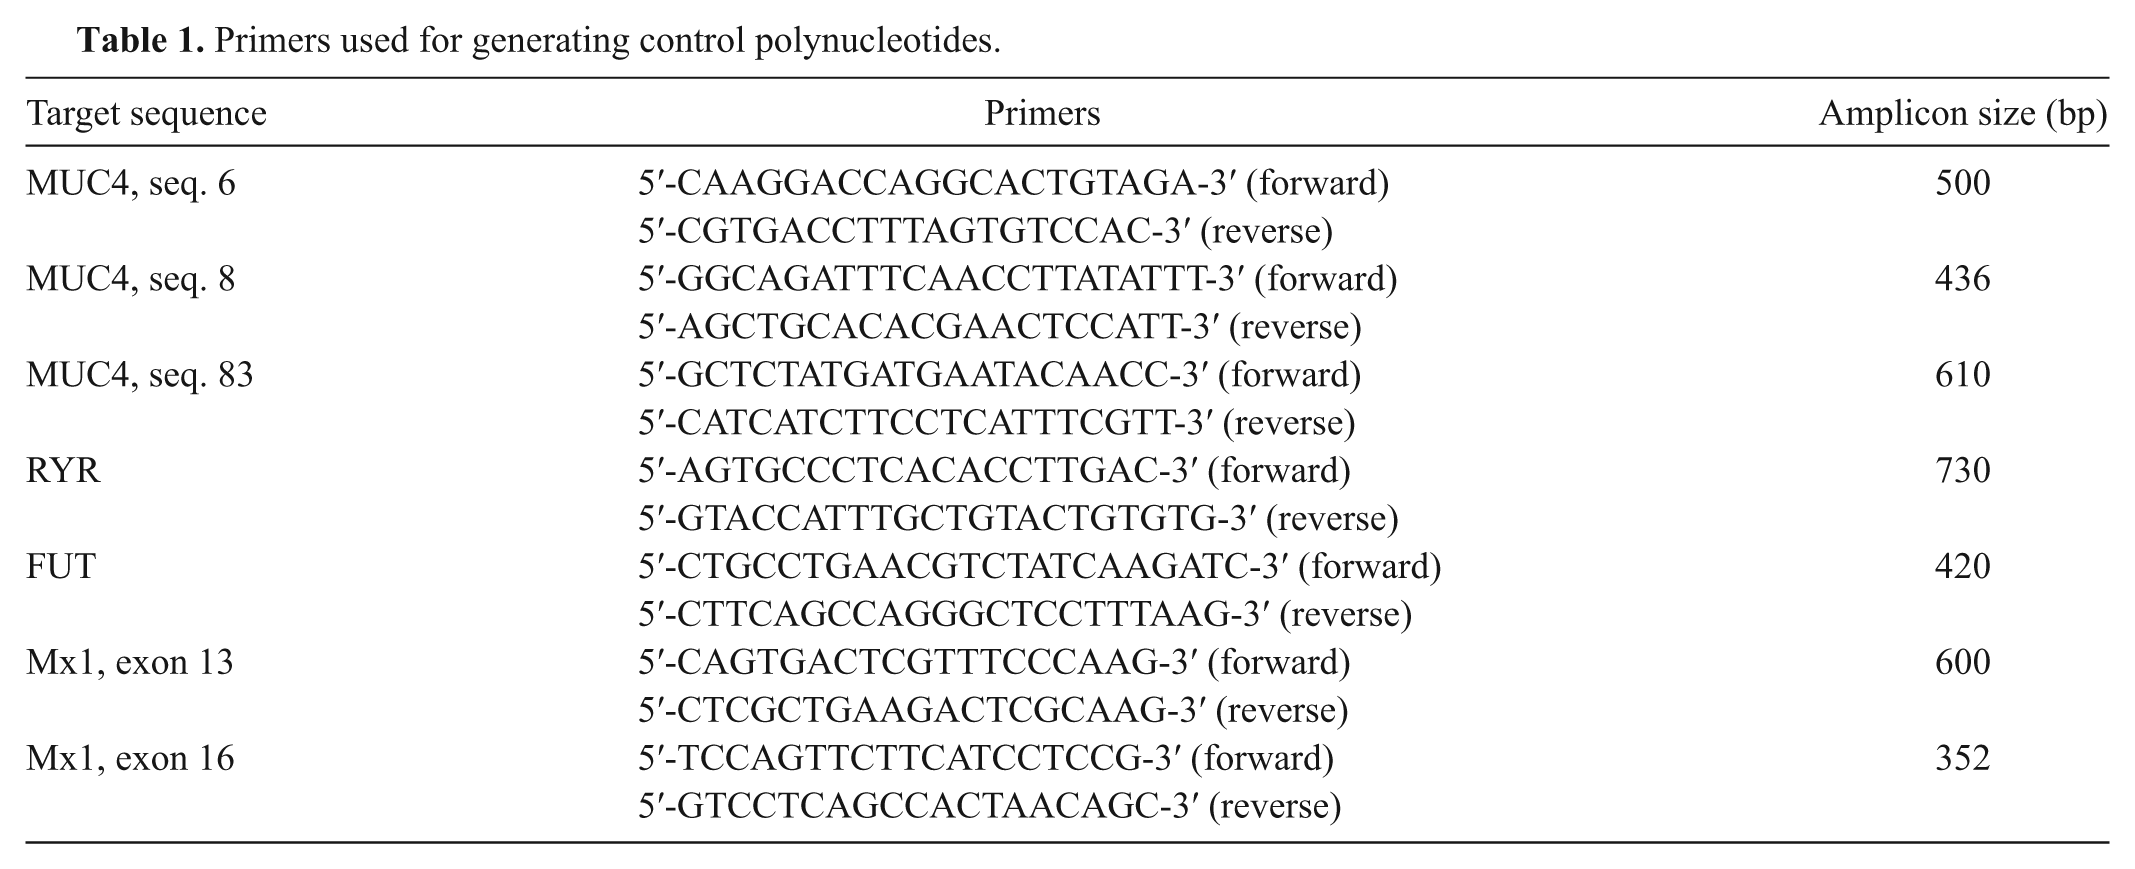
The PCR assays were performed in 50 µl PCR mixture containing the following: 1× buffer II (100 mM Tris-HCl [pH 8.3], 500 mM KCl); 3 mM or 2 mM MgCl2; 0.20 µM of each primer d ; 200 µM 2′-deoxyadenosine-5′-triphosphate (dATP), 2′-deoxycytidine-5′-triphosphate (dCTP), and 2′- deoxyguanosine-5′-triphosphate (dGTP) e ; 150 µM 2′- deoxythymidine-5′-triphosphate (dTTP) e ; 50 µM 2′-deoxyuridine 5′-triphosphate (dUTP) e ; 10 µM biotin-11-dATP f ; 10 µM biotin-11-dCTP f ; 2.5 U Taq DNA polymerase g ; and 25 ng genomic DNA. Two PCR mixes were used (hereafter, MUC-PCR and RFM-PCR). The first PCR mix amplified fragments of the MUC4 sequences 6, 8, and 83, and the second was designed to amplify fragments of RYR, FUT1, and MX1 genes (primers given in Table 1). The RFM-PCR was improved by changing primer concentrations: 0.2 µM for RYR and FUT1, 0.1 µm for MX1/exon 13, and 0.4 µM for MX1/exon 15. The positions of the primers on the gene sequences are presented in Figure 1. Cycling conditions were 30 sec at 95°C; 40 amplification cycles consisting of 30 sec at 95°C, 1 min at 58°C, and 1 min at 72°C; and a final extension step of 10 min at 72°C. Water was used as negative control of the amplification. The PCR reactions were carried out in a thermocycler. h Biotin-labeled PCR products were analyzed on 1.5% agarose gels stained with ethidium bromide. For validation purposes, a set of amplicons, the sequence of which corresponded to resistant and susceptible FUT1, RYR, MUC4, and MX1 alleles, was then cloned in 3 different vector systemsb,i according to the manufacturer’s instructions and reassessed by sequence analysis. The plasmids were subsequently used to test specificity of the principal capture probes.
Primers used for generating control polynucleotides.
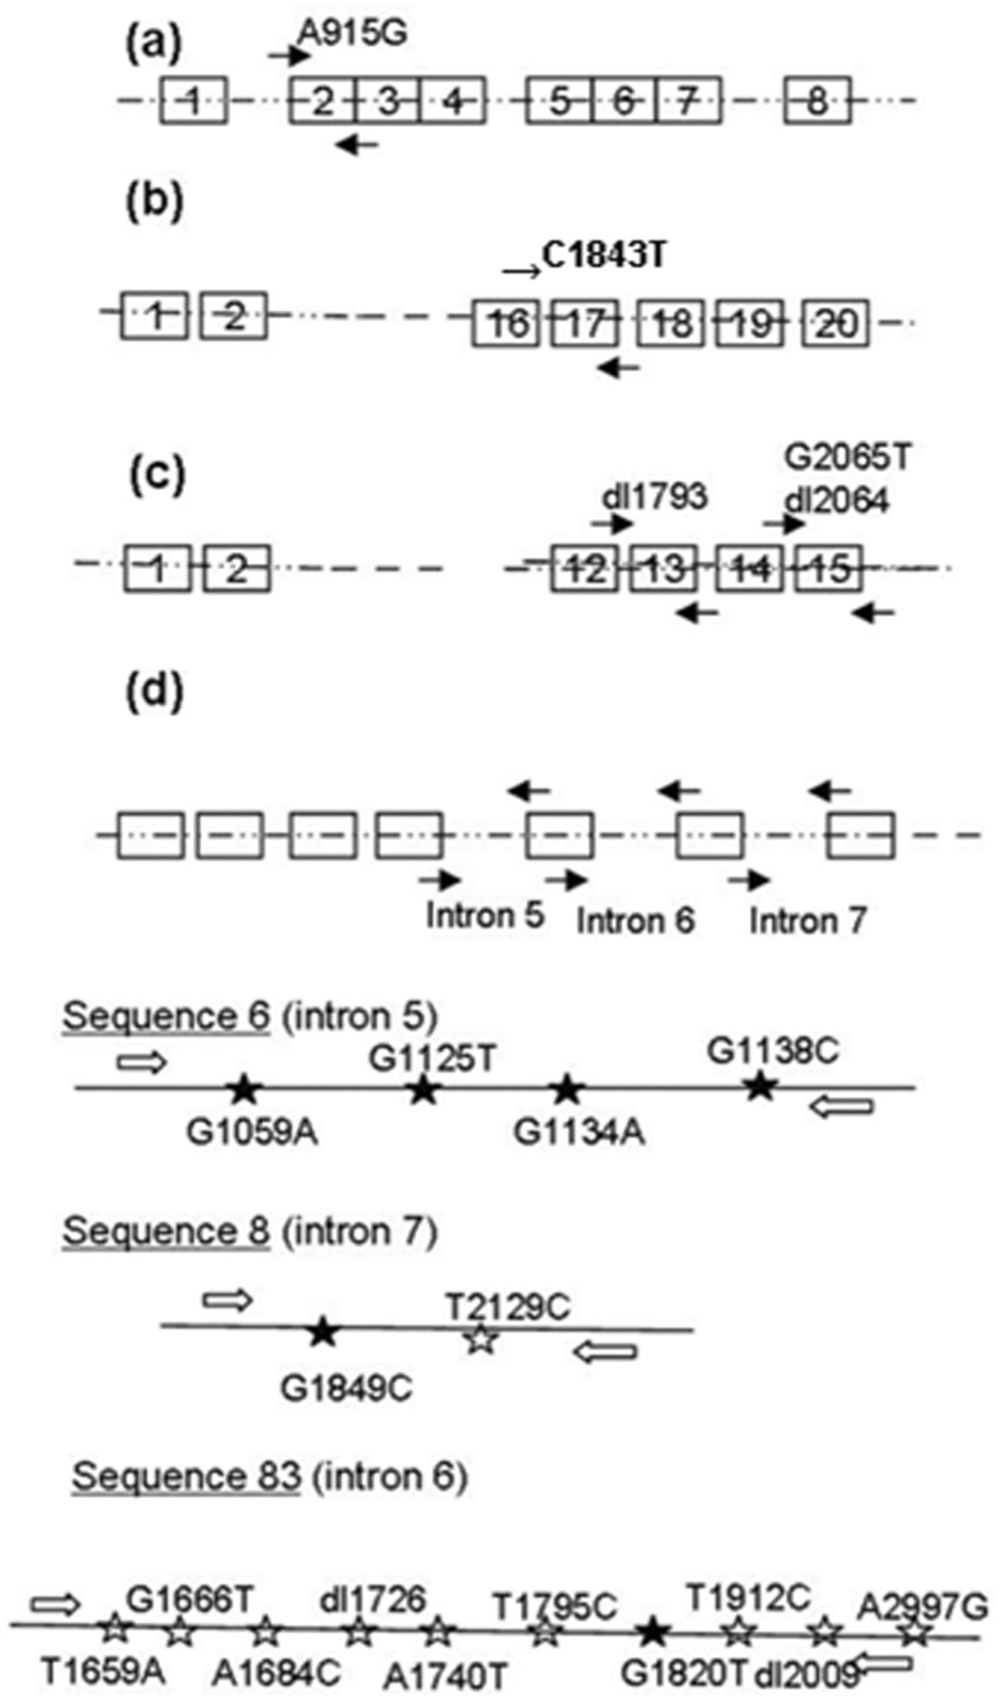
Schematic representation of FUT1 (
Fragmentation of PCR products before microarray analysis
A volume of 30 µl of pooled PCR products (15 µl PCR 1 + 15 µl PCR 2) was diluted in a reaction buffer (40 mM Tris-HCl [pH 8], 10 mM MgSO4, 1 mM CaCl2) and fragmented with DNaseI i for 5 min. 8 The DNase is expected to cut amplicons randomly leading to fragments of approximately 15 to 100 bp. The efficiency of the fragmentation was checked using an automated system. j
Design of the low-density microarray
The low-density microarray developed herein is based on proprietary technology. k The array consists of a glass slide with different probes covalently attached by an amino group located at the 5′ end onto an aldehyde functionalized slide, forming 250 µm-in-diameter spots. All probes were spotted in triplicate. The general design of the array is presented (Supplementary figure). Class-1 spots (principals) consisted of 17 capture probes specifically designed to catch either the resistance or the susceptibility allele previously detected at the FUT1, RYR, MX1, and MUC4 loci (Fig. 1). Six pairs of probes were designed to detect the following single-nucleotide polymorphisms: A915G (FUT1), C1843T (RYR), G2065T (MX1), G1059A (MUC4 sequence 6), G1820T (MUC4 sequence 83), and G1849C (MUC4 sequence 8). A seventh pair of probes was chosen to discriminate GGG versus TAC at positions 1125, 1134, and 1138 within sequence 6 of the MUC4 locus, and an eighth pair was used to establish the presence or absence of the loss-of-function–associated deletion in the MX1 locus (del1793). Finally, a single probe was designed to detect the deletion in exon 15 of MX1 (del2064). Class-2 spots (controls) consisted of 17 capture probes designed to monitor each step of the process: 1) 1 positive and 2 negative hybridization controls, 2) 6 positive detection controls (a biotinylated probe spotted at 6 different concentrations to evaluate detection efficiency and to normalize results), and 3) 4 negative and 4 positive external controls. The external probes were designed for the data analysis and in the same way as the specific capture probes for each allelic variant. The positive external probes are localized within the amplified fragments and must be detected, as they are localized outside of a polymorphic region. The positive probes yield combined PCR/hybridization-positive controls. These positive probes were arbitrarily substituted to generate the negative external probes, for which a background intensity signal was expected.
Microarray running process
For hybridization, a volume of 15 µl of 0.175 N of NaOH was added to 14.3 µl of fragmented amplicons, 7 µl of positive hybridization control DNA fragment, and 14 µl of distilled water. The mix was incubated at room temperature for 5 min. Next, 50 µl of hybridization solution l was added, and the solution was loaded on the array framed by a hybridization chamber. The chamber was sealed by an aluminum pad, and the hybridization was carried out at 60°C for 2 hr under shaking.
When fluorescence detection was used, the slides were first washed 4 times for 2 min at room temperature with a washing buffer l and then incubated for 45 min at room temperature with a cyanine 3–conjugated antibiotin m immunoglobulin G diluted 1:1,000 in a dark room. After washing 5 times with washing buffer, the slides were dried before being stored at room temperature. The detection was performed with a laser confocal scanner. f
For colorimetric detection, reagent l was used according to the instructions of the manufacturer. Slides were washed 4 times for 2 min at room temperature and incubated in pre–blocking buffer for 10 min. The procedure was then continued in the dark, the slides being incubated with streptavidin-conjugated nanogold particles for 45 min and subsequently washed 5 times with washing buffer and once more with rinsing buffer supplied in the kit. Subsequently, slides were treated with kit-supplied revelation mixture for 5 min, rinsed twice for 30 sec with distilled water, and dried vertically. The detection was performed with an automated scanner. l After fluorescence or colorimetric detection, each slide was quantified by the manufacturer’s analysis software, l and results were analyzed with the dedicated software. k
A key point is to work within the rising section of the detection curve because of the need to apply a quantitative criterion to discriminate between heterozygote and homozygote samples. In the plateauing section of the signal (saturation), such a criterion is not applicable. A way to obtain the signal in the working range consists of adapting the amount of fragmented PCR products incorporated for the hybridization step. Because of the high sensitivity of labeling, l different dilutions of fragmented PCR products (15×, 12×, 10×, 8×, 5×) were systematically tested. A progressive decrease of specific and nonspecific signals was measured with progressively increasing dilutions (data not shown). With respect to the discrimination ratio, dilution 5× was chosen because it consistently offered a good compromise between the signal intensity and the discrimination ratio.
The hybridization conditions, such as temperature, mode of denaturation, and incubation time, were first optimized. The effect of the pooling of PCR products on the same array was then controlled. The results obtained from pooled MUC- and RFM-PCR products were similar to those obtained when the 2 PCR assays were hybridized separately with a decrease of approximately 30% of the signal intensities but with no change in the discrimination ratio between sensitive and resistant probes.
Data analysis
Signals yielded by capture probes specific for resistant (R) and susceptible (S) markers were first compared with the signals generated by negative external probes. The positivity threshold was set at a value corresponding to 2.5 (fluorescence detection) or 1.5 (colorimetry) times that generated by negative external probes. Next, assignment of “homozygote” or “heterozygote” status was based on the result of the following equation: |[S – R]/mean [S:R]|, a sample being considered heterozygote/homozygote below/above 1 (fluorescence detection) or 0.66 (colorimetric detection). When contradictory genotypes were obtained from different arrays testing the same DNA sample, the genotype was reported as “nondetermined”; when signal intensity was too low, the genotype was reported as “nondeterminable.” The genotypes generated by the array were then verified against those generated by standard sequencing procedures.
Results
The principle of the chip analysis based on PCR amplification is shown in Figure 2. The method combines the amplification of several target sequences using various specific primer pairs, followed by their fragmentation and discrimination by hybridization on specific capture probes present on the chip. The 4 genes and corresponding allelic variants had been chosen for their involvement in pig diseases as explained in the introduction section, and the localizations of the primers and the polymorphisms are presented (Fig. 1). As aforementioned, 2 different multiplex PCR assays were performed: the RFM-PCR amplifies 4 fragments (RYR, FUT1, MX1/exon 13, and MX1/exon 15) covering 5 possible mutations, and the MUC-PCR amplifies 3 fragments (MUC4 sequences 6, 8, and 83) covering 6 possible mutations.
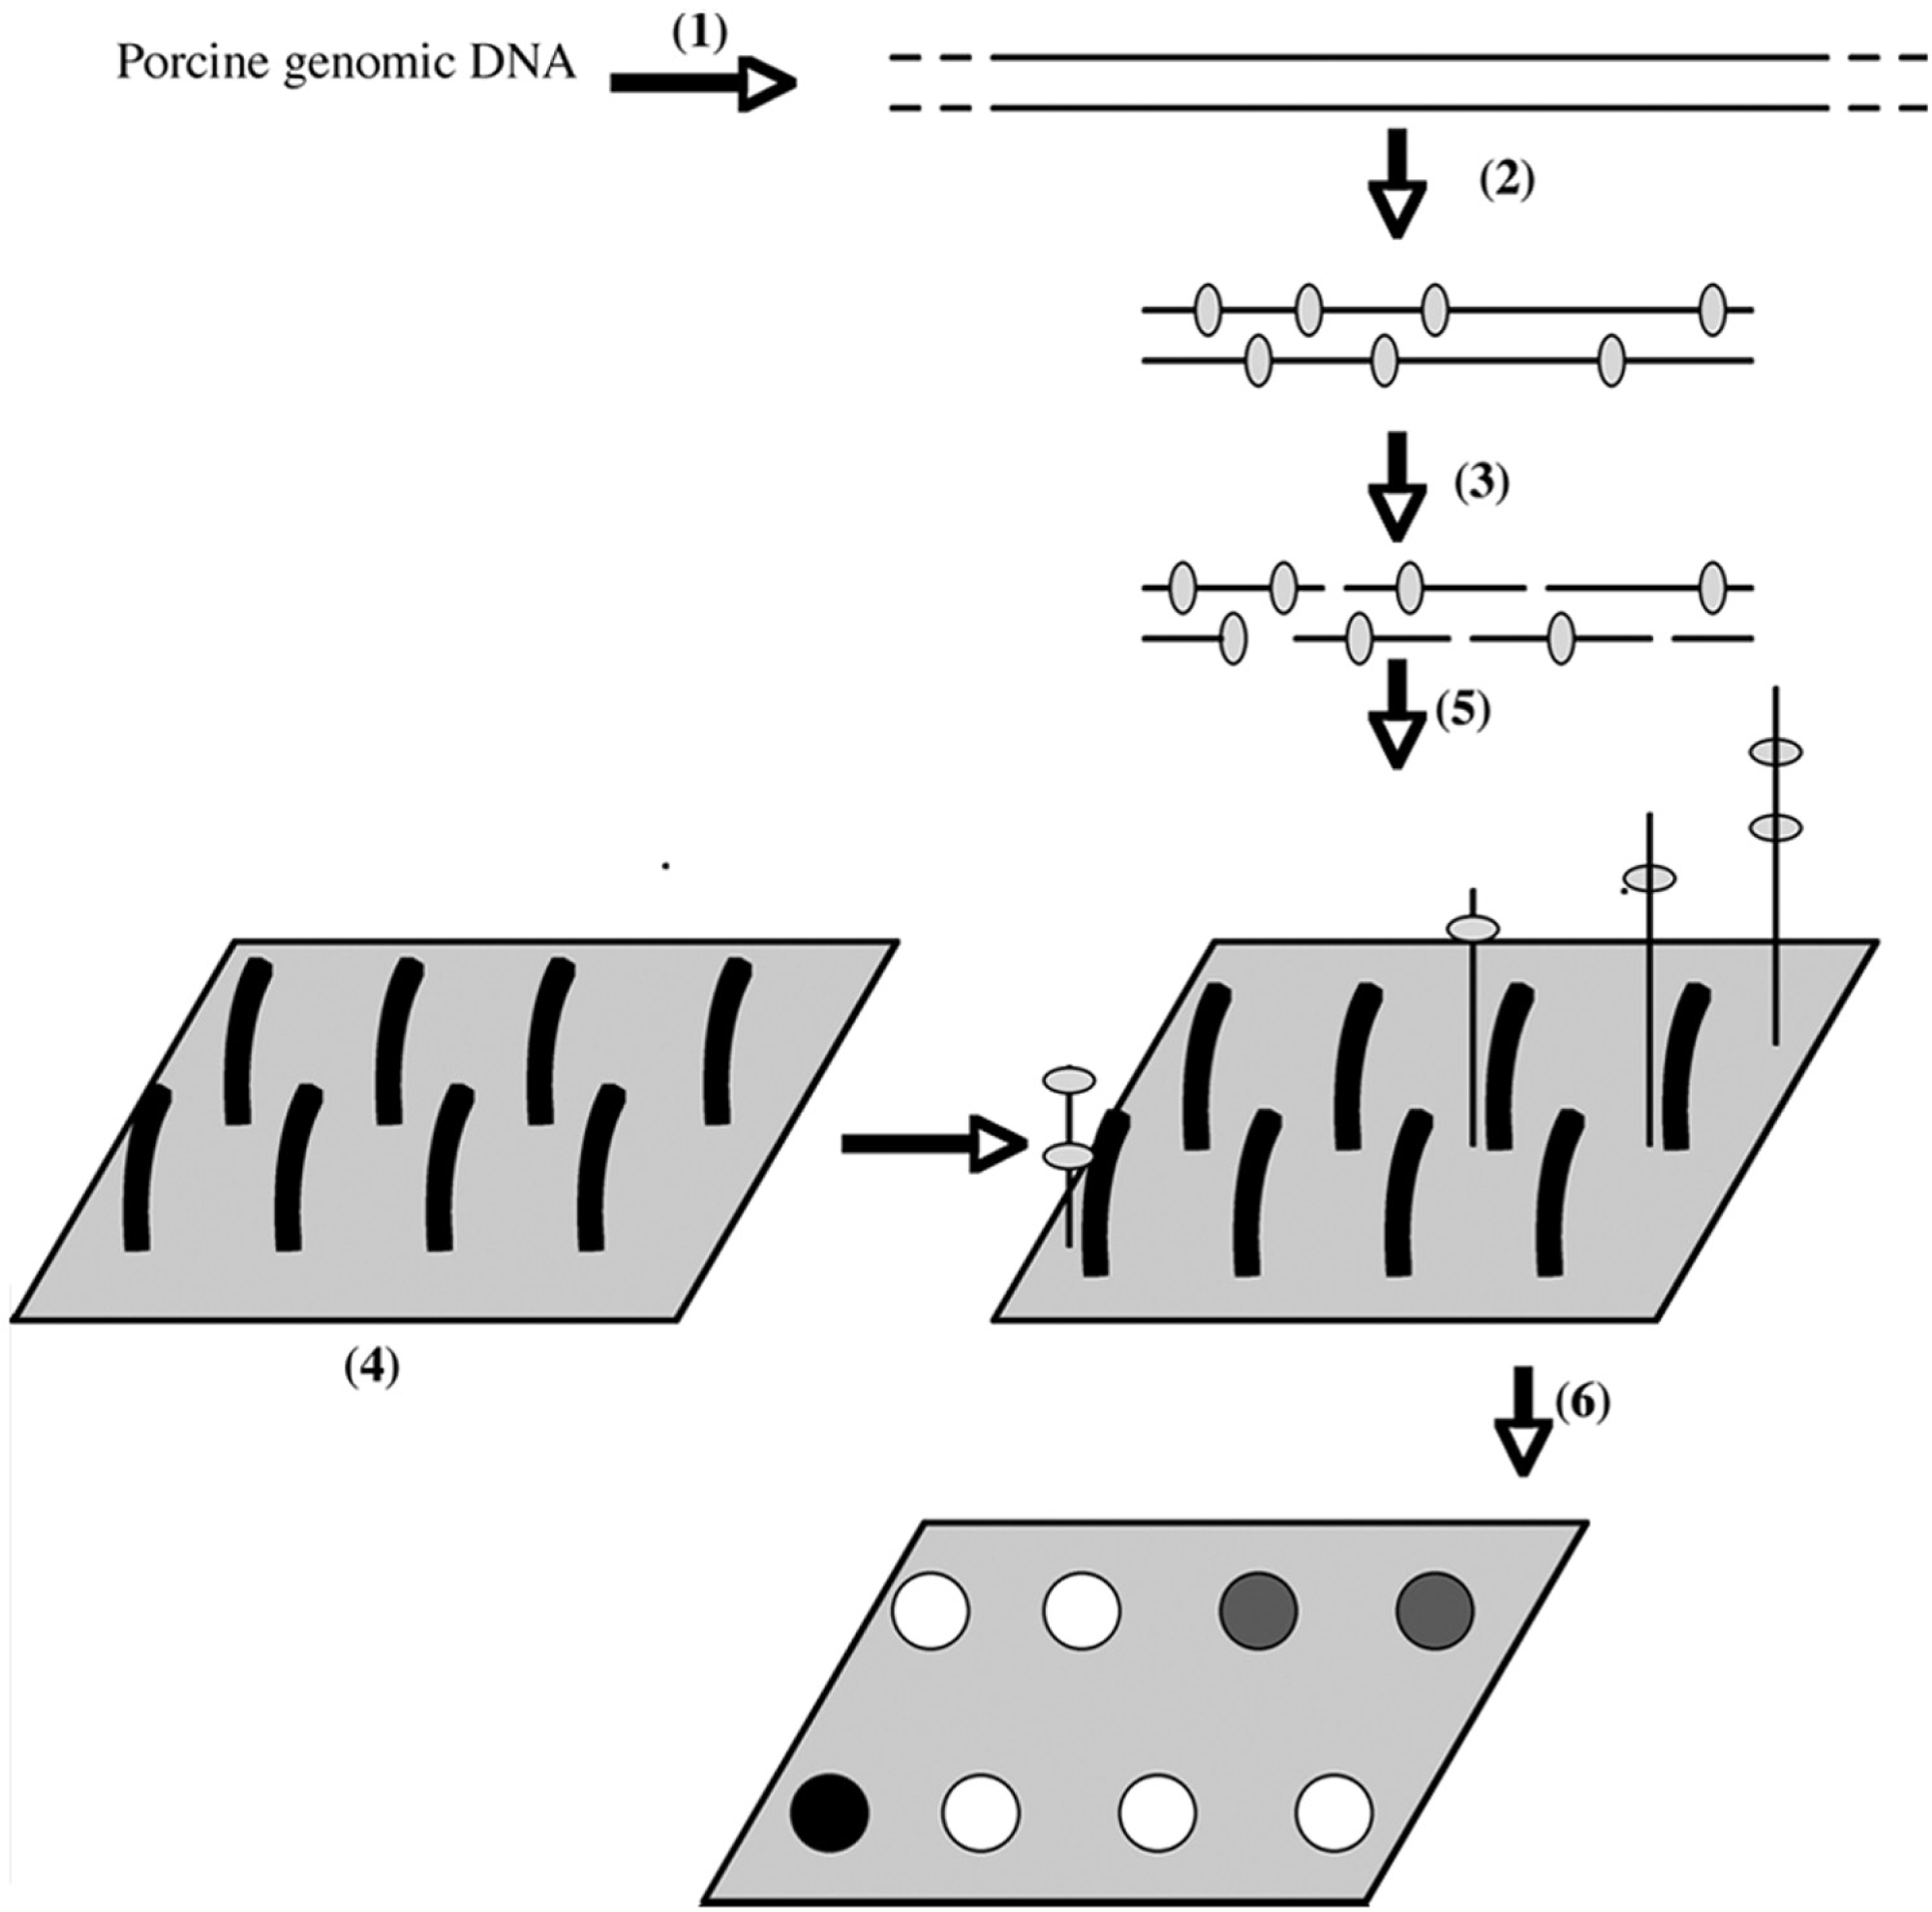
Principle of the array analysis. (1) Porcine genomic DNA is extracted from blood, hair, tail skin, intestinal tissue, sperm, and spleen of several races. (2) Polymerase chain reaction (PCR) amplification is performed with specific primers. During this amplification, the DNA is labeled with biotin. (3) The PCR product is digested with DNase I during a given time. (4) Capture probes, complementary to the amplified sequences, are grafted on a chemically treated glass slide. (5) The fragmented product is hybridized on the array. The amplified sequences hybridize with their complementary capture probes. (6) After the washing steps, the biotinylated bound sequences are detected by fluorescence or by a colorimetric technique (SilverQuant® staining, Eppendorf AG, Hamburg, Germany).
Array quality assessment
Target recognition by the array was checked by hybridization of fragmented PCR products obtained from the control plasmids. Typical microarray pictures obtained while genotyping FUT1 are presented (Fig. 3). Hybridization and detection controls were correctly detected on the chip. The PCR products obtained from plasmid matrices carrying the allelic variants associated with susceptibility and resistance were fragmented and hybridized on the array (Fig. 3a–c). The amplified product specifically hybridized the FUT1 capture probes (Fig. 3a–c), and there was no cross reaction with the negative external controls. Moreover, PCR products from control “susceptible” and “resistant” plasmids hybridized the corresponding FUT1 “susceptible” and “resistant” capture probes, respectively. One of the difficulties was to obtain a quantitative estimation reliable enough to discriminate heterozygote from homozygote genotypes. Indeed, when the susceptible sequence is hybridized, the signal on the resistant spot is low compared with the specific signal measured from the susceptible spot, but it is not null, as shown on the quantitative signal (Fig. 3d). The reverse is true for the resistant sequence. These specific hybridizations were compared with a mix of amplicons from plasmids carrying the sequences associated with both genotypes. The results (Fig. 3c, 3d) show that it is possible to discriminate homozygote and heterozygote genotypes by comparing the difference between the amplitude of the signals retrieved from the 2 spots. On the basis of these studies, which were repeated for all probe pairs, a formula was devised to perform this discrimination, and the threshold values provided in the materials and methods section were established.
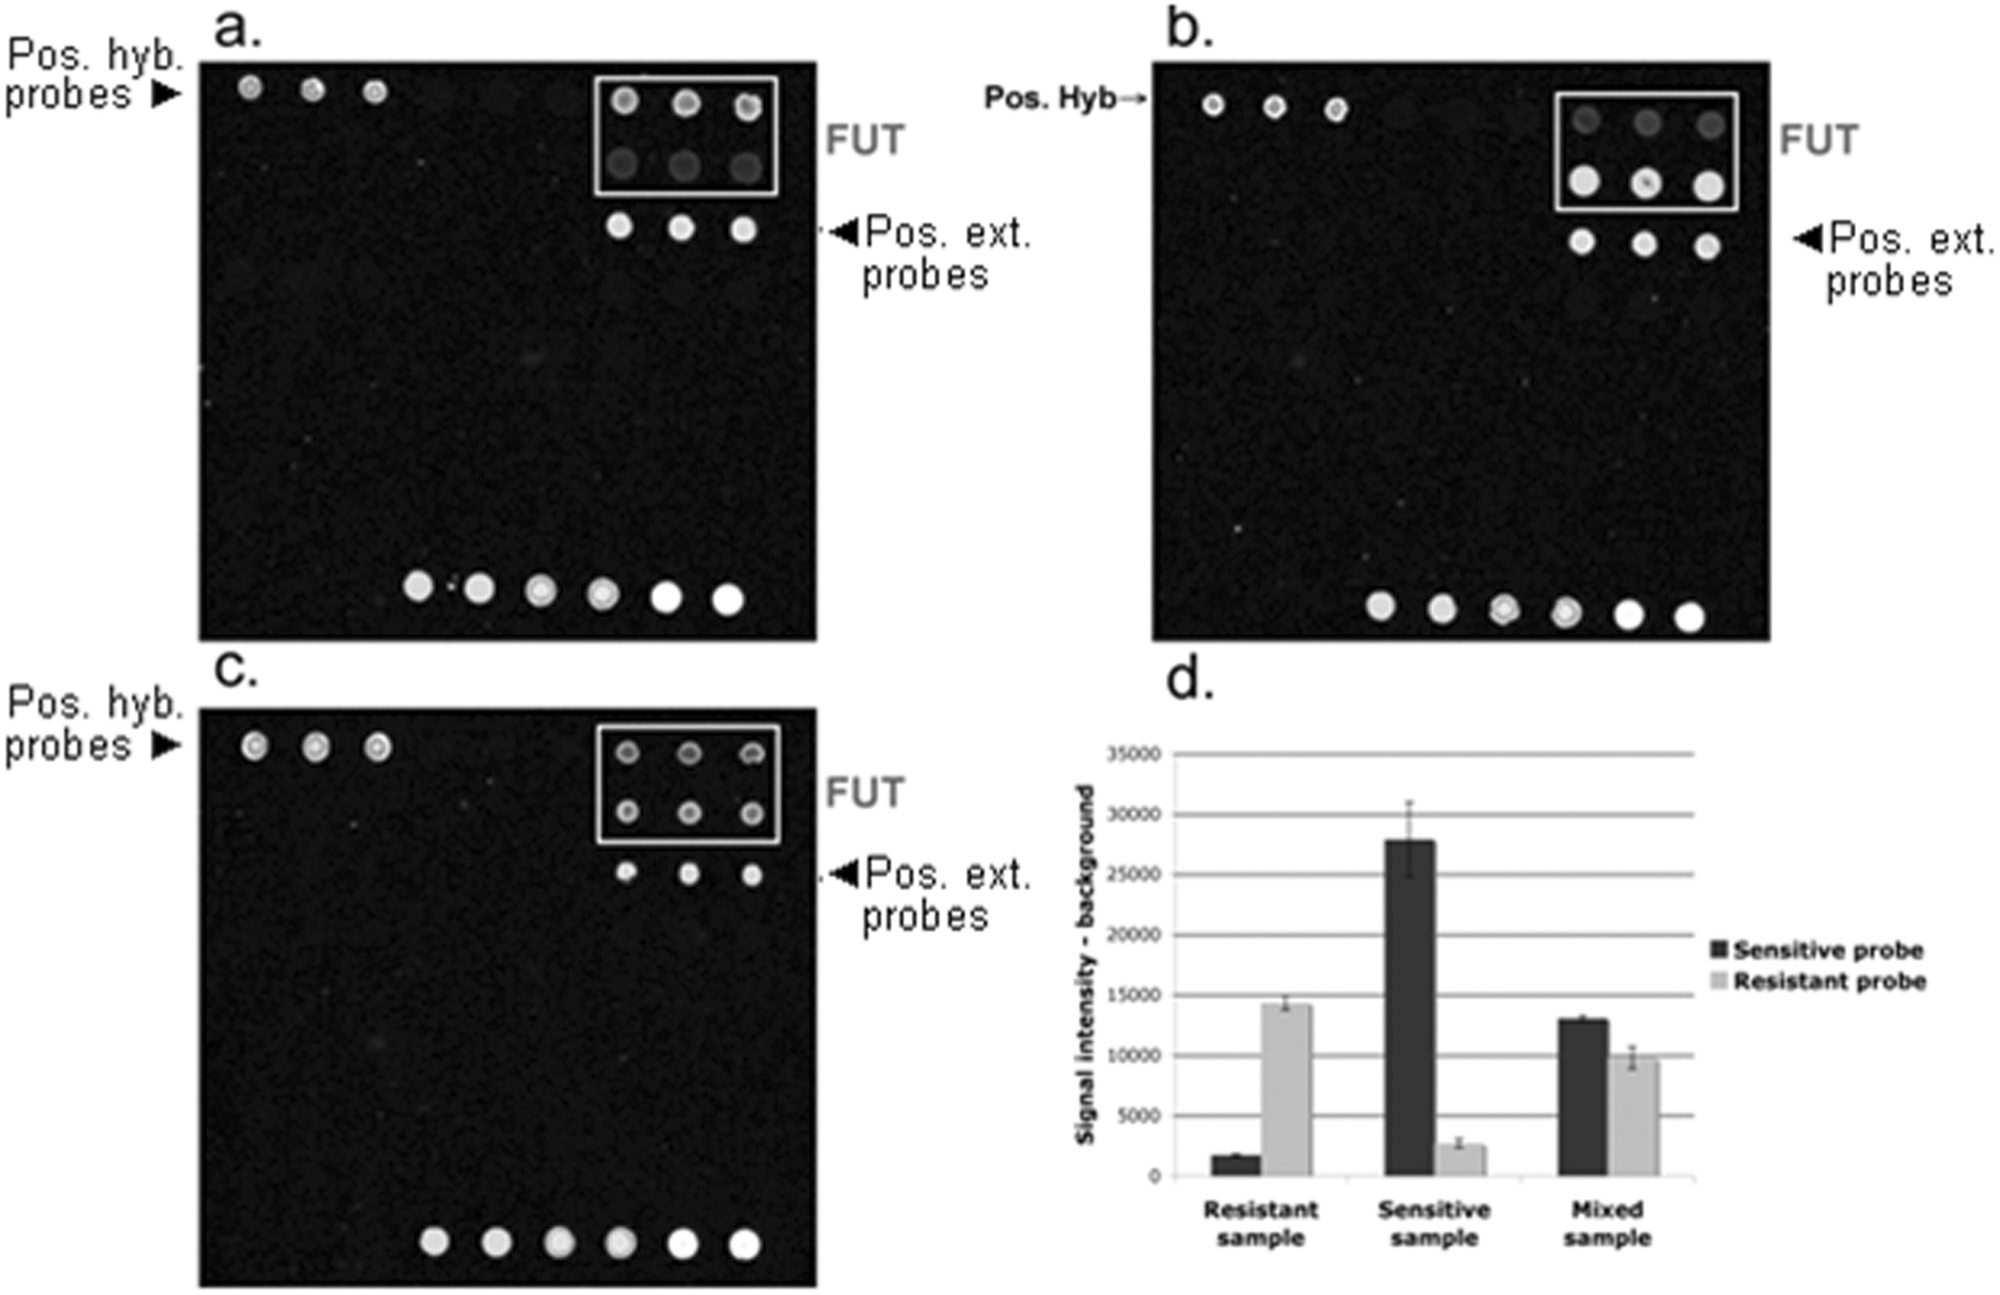
FUT1 allelic variants detection by the FUT1 prototype array. Polymerase chain reaction products amplified from plasmid matrices carrying the allelic variants associated with susceptibility and resistance to edema disease/postweaning diarrhea were fragmented and hybridized on the array. Fluorescent detection was performed, using ScanArray Express™ (Perkin Elmer, Inc., Waltham, MA, with PMT set at 70). (
Array prevalidation
Initially, prevalidation was performed to test for the robustness of the method on real samples covering different genotypes. Sixty different samples of porcine genomic DNA were obtained. The DNA samples were extracted from different sources (sperm, blood, spleen, tissue, and hair) and from different breeds of pigs, PCR amplified, and processed for detection on the array. A total of 24 fragmented products were hybridized in duplicate and detected in both fluorescence and colorimetry. The results obtained were similar in both detection methods and were in agreement with the sequencing data. The hybridization of 1 sample detected in colorimetry or in fluorescence is presented (Fig. 4a, 4b). This sample was heterozygous for FUT1, homozygous resistant for RYR, heterozygous for the deletion in exon 15 of MX1, homozygous nondeleted for exon 13 of MX1, and homozygous susceptible for MUC4 sequences 6, 8, and 83.
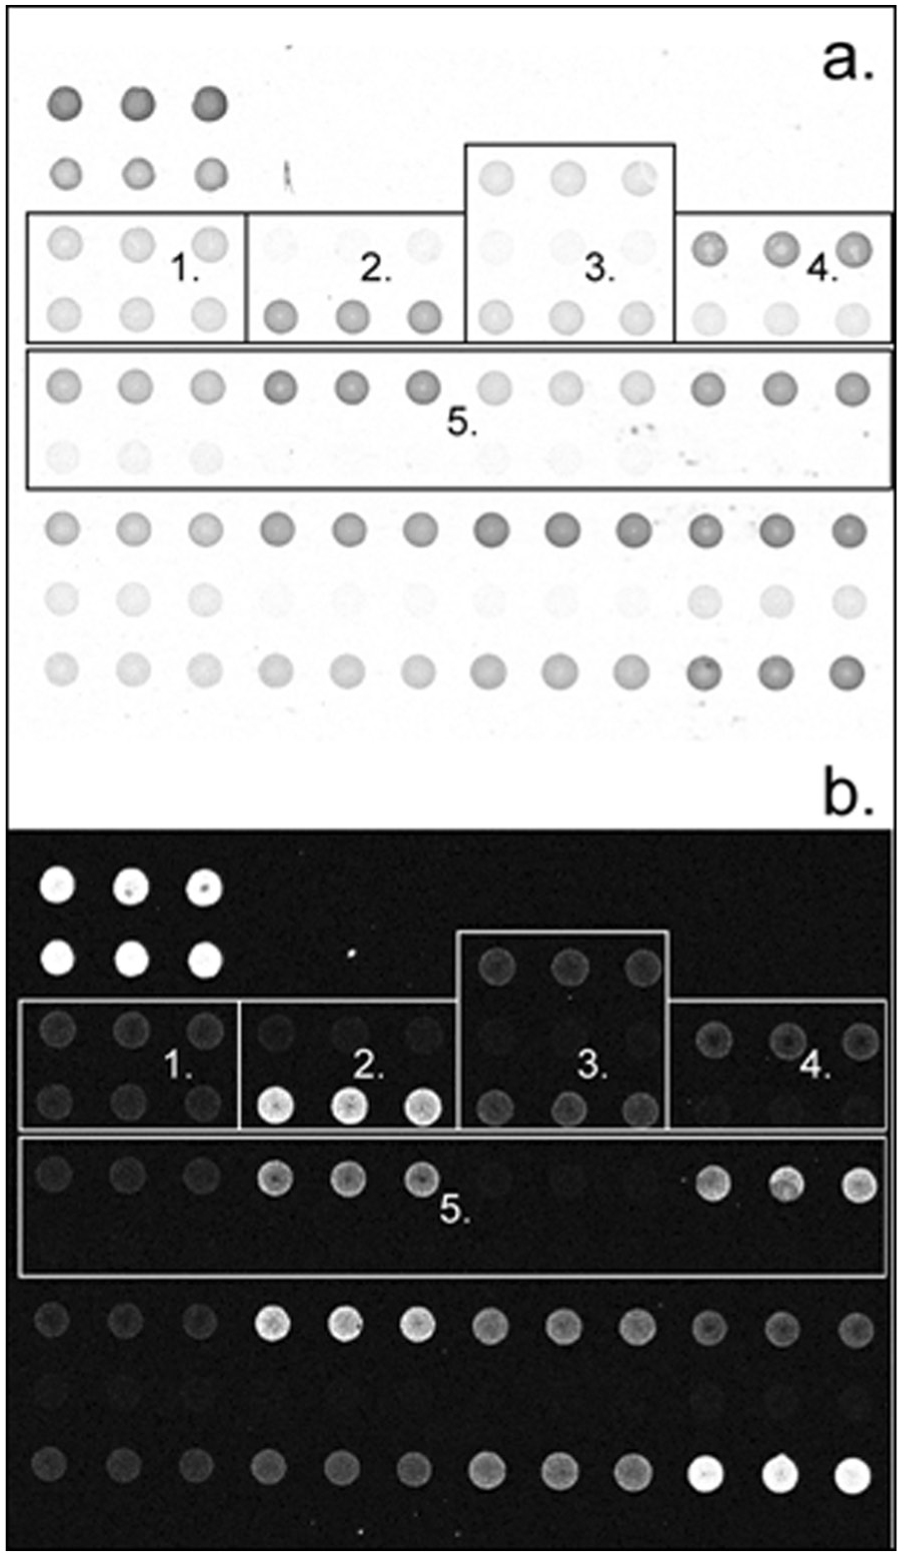
Colorimetric (
It was found that the 2 methods of detection gave similar results; therefore, only 1 method was chosen for further validation. Although fluorescence detection offers the opportunity to scan at different gains, this method is quite expensive compared with colorimetric detection. Therefore, colorimetric detection was chosen. Results obtained from hybridization of 60 samples detected in colorimetry are presented in Table 2. For MUC4 (sequences 6 and 8), RYR, and MX1/exon 13 targets, all microarray results correlated with the sequencing data. The values of 96.6% and 91.4% correlation were obtained between microarray and sequencing results (after improvement of the RFM-PCR) for FUT1 and MX1/exon 15 targets, respectively, due to nondeterminable (signal value too low) and nondetermined (between-duplicates contradiction) samples. Among the 60 DNA samples detected in colorimetry, 6 gave a result considered nondeterminable (1 for FUT1 alone, 4 for MX1/exon 15 alone, and 1 for both FUT1 and MX1/exon 15). This can be due to a low-quality DNA sample or extraction. Moreover, on all 60 samples, 3 gave a result considered nondetermined for MX1/exon 15. When a new mix was prepared to run the RFM-PCR (primer concentrations reduced to 0.1 µm for MX1/exon 13 and increased to 0.4 µm for MX1/exon 15), the 3 nondetermined samples were resolved. In summary, in this prevalidation step, 414 of 420 genotypes sought were correctly assigned by the microarray, and the remaining 6 yielded too weak signals (nondeterminable).
First comparison of array- and sequencing-based genotyping (prevalidation study).*
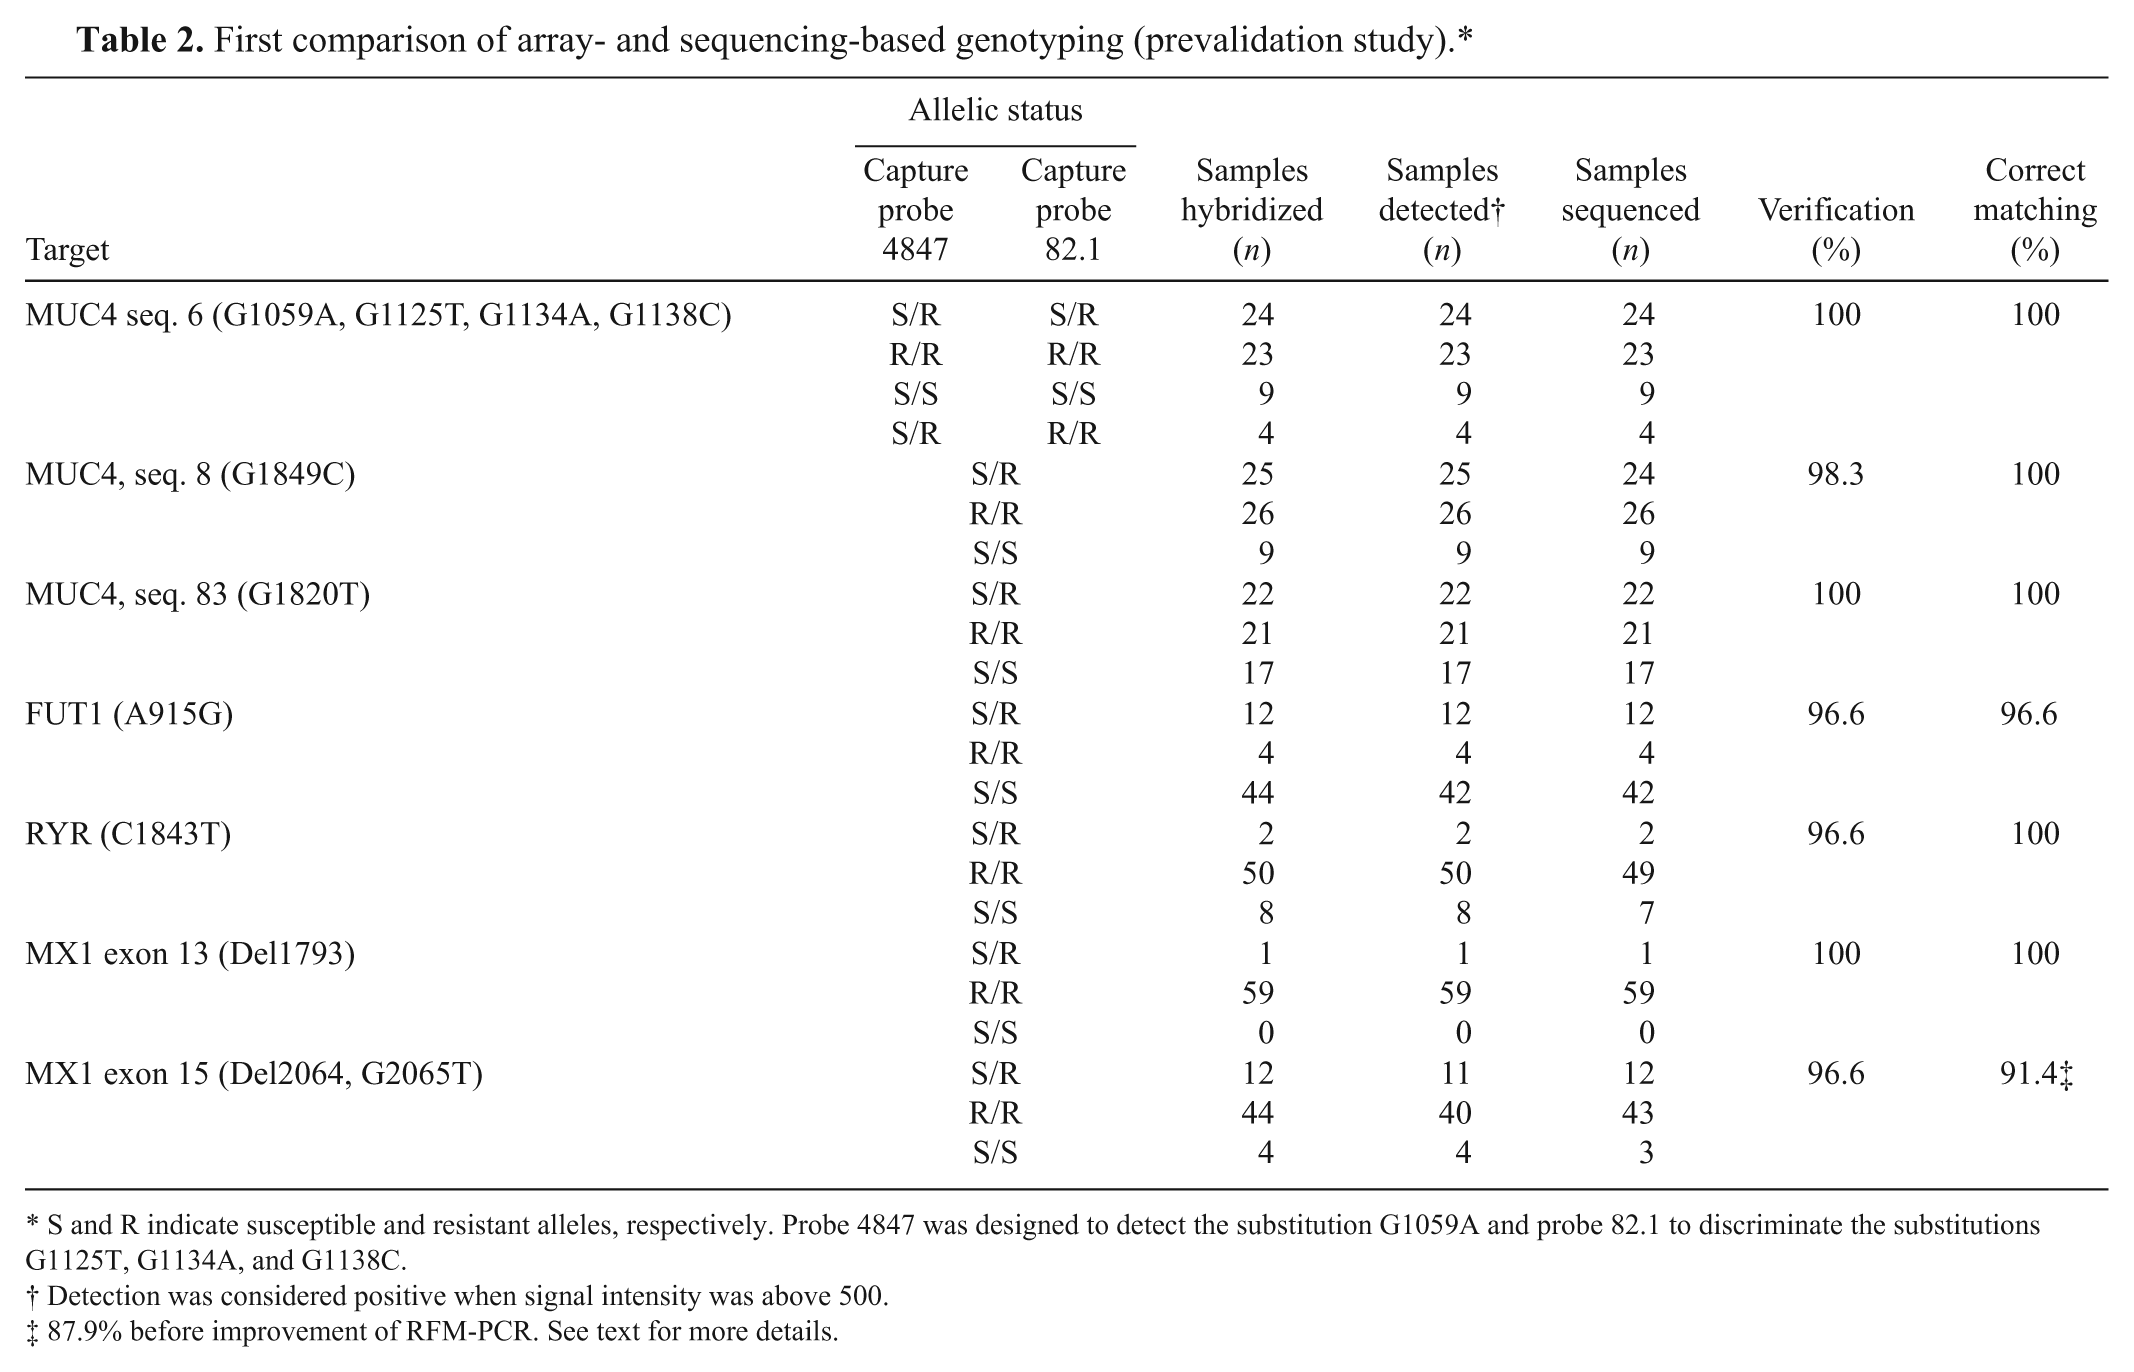
S and R indicate susceptible and resistant alleles, respectively. Probe 4847 was designed to detect the substitution G1059A and probe 82.1 to discriminate the substitutions G1125T, G1134A, and G1138C.
Detection was considered positive when signal intensity was above 500.
87.9% before improvement of RFM-PCR. See text for more details.
Array validation
Validation of the array was then performed on 68 new samples of porcine genomic DNA originating from a University of Liège experimental farm. Polymerase chain reaction, fragmentation, and hybridization in duplicate with a colorimetric detection were performed. Genotyping results are presented in Table 3. There were no nondeterminable samples, most likely because of the standardization of the tissue sampled (tail skin) and subsequent extraction protocol. a All genotypes retrieved from the microarray (476) perfectly fitted with sequencing data despite the fact that each pig was heterozygote for at least 1 target gene.
Second comparison of array- and sequencing-based genotyping.*
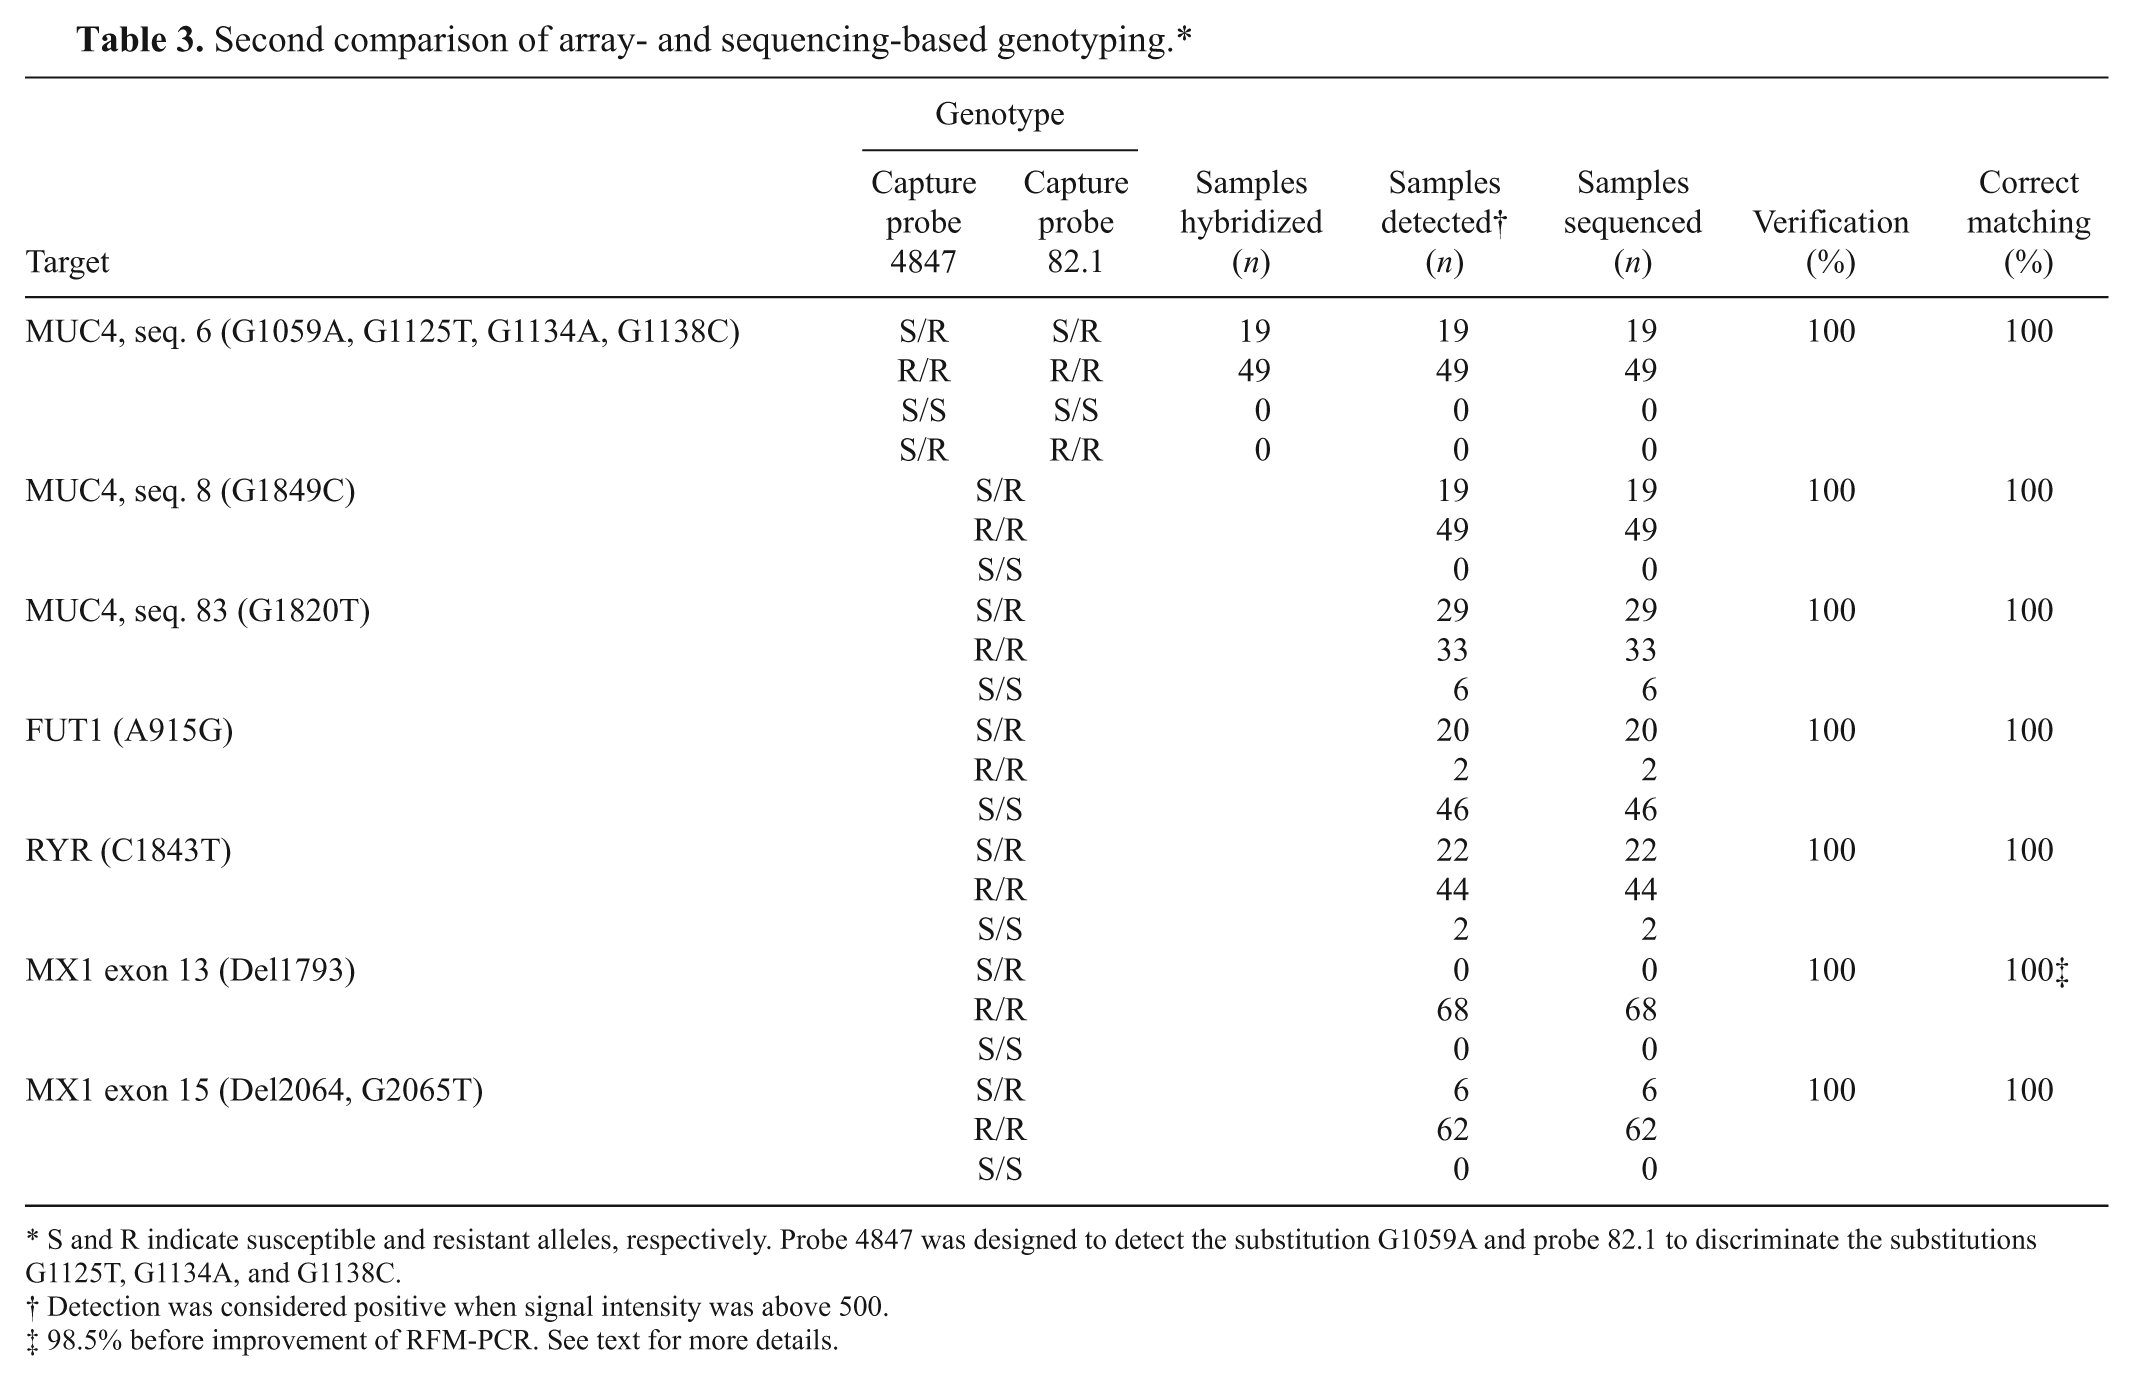
S and R indicate susceptible and resistant alleles, respectively. Probe 4847 was designed to detect the substitution G1059A and probe 82.1 to discriminate the substitutions G1125T, G1134A, and G1138C.
Detection was considered positive when signal intensity was above 500.
98.5% before improvement of RFM-PCR. See text for more details.
Discussion
The current study describes a simple method for the rapid and simultaneous assessment of 11 allelic variants involved in frequent swine diseases, allowing the detection of resistant and susceptible genotypes. The method combines 2 multiplex PCR assays producing fragments of the RYR, FUT1, MX1, and MUC4 genes with an array-based allele detection. This approach is time- and cost-effective because 7 different polyallelic amplicons are identified and quantified in 1 single step. There is almost no limit to the number of capture probes that can be introduced onto an array. In the present work, capture probes specific for each variant were anchored on the chip, but the array can be easily updated in the future when new disease-associated allelic polymorphisms are discovered.
The specificity of the designed capture probes was evaluated by use of plasmids containing the different polynucleotides targeted. The technology developed gave a specific detection of the targets with no cross-reactivity observed. Moreover, it allowed a clear discrimination between homozygous and heterozygous animals. Assay accuracy was first examined and improved by use of 60 samples originating from different pig breeds and tissues. Some DNA samples yielded very low intensity signals, precluding accurate analysis. This was clearly due to the quality of the DNA because no undeterminable results were retrieved when the second collection of 68 fresh and standardized (skin) DNA was screened. In the prevalidation step, a few samples were also considered “nondetermined” due to contradictory results between duplicates. This was solved by modifying the primer concentrations used to PCR amplify MX1/exon 13– and MX1/exon 15–specific polynucleotides. When the validation step was subsequently carried out, the 7 genotypes of each of the 68 animals enrolled were correctly assigned.
In summary, the array developed herein yields rapid, cost-effective, and reliable genotyping of 4 loci underlying resistant or susceptible phenotypes to malignant hyperthermia/stress (RYR), edema disease (FUT1), neonatal (MUC4) and postweaning E. coli–associated diarrhea (FUT1), and respiratory infections by influenza viruses (MX1). Moreover, this new DNA array is able to discriminate a homozygous from a heterozygous animal, regardless of the disease-resistance gene considered. The preliminary data reported suggest that the array might be a promising tool for mass screening, which would result in improvement of innate resistance among pig populations.
Footnotes
Acknowledgements
The authors thank Eppendorf Array Technologies and especially Sandrine Hamels, Vincent Bertholet, and Angelo Stiliaras for their help in the design of the probes and the data analysis software. Soumya Pastoret and Hélène Ameels contributed equally to this work.
a.
NucleoSpin®, NucleoSpin® DNA Trace, NucleoSpin® Tissue; Macherey-Nagel GmbH & Co. KG, Düren, Germany.
b.
pCRII-TOPO, pcDNA3; Invitrogen Corp., Carlsbad, CA
c.
NanoDrop ND-1000, NanoDrop, Wilmington, DE.
d.
Eurogentec SA, Seraing, Belgium.
e.
Roche, Basel, Switzerland.
f.
Scan Array Express, PerkinElmer Inc., Waltham, MA
g.
Ultratools, Manchester, Lancashire, England.
h.
PCT-200 Peltier Thermal Cycler, MJ Research Inc., Waltham, MA.
i.
pGEM®-T Easy vector, Promega Corp., Madison, WI.
j.
DNA 1000 LabChip®, Agilent Technologies Inc., Santa Clara, CA.
k.
SNP Tool software, Eppendorf Array Technologies SA, Namur, Belgium.
l.
SilverQuant®, Eppendorf AG, Hamburg, Germany.
m.
Jackson Immuno Research Laboratories, West Grove, PA.
The author(s) declared no potential conflicts of interest with respect to the research, authorship, and/or publication of this article.
The author(s) disclosed receipt of the following financial support for the research, authorship, and/or publication of this article: The current work was supported by the “Ministère de la Région Wallonne” under the contracts 0215188 and 0215373.