
Abstract
Many of the disease syndromes challenging the commercial swine industry involve the analysis of complex problems caused by polymicrobial, emerging or reemerging, and transboundary pathogens. This study investigated the utility of the Lawrence Livermore Microbial Detection Array (Lawrence Livermore National Laboratory, Livermore, California), designed to detect 8,101 species of microbes, in the evaluation of known and unknown microbes in serum, oral fluid, and tonsil from pigs experimentally coinfected with Porcine reproductive and respiratory syndrome virus (PRRSV) and Porcine circovirus-2 (PCV-2). The array easily identified PRRSV and PCV-2, but at decreased sensitivities compared to standard polymerase chain reaction detection methods. The oral fluid sample was the most informative, possessing additional signatures for several swine-associated bacteria, including Streptococcus sp., Clostridium sp., and Staphylococcus sp.
Introduction
Agriculture accounts for $1.24 trillion, or 12.3%, of the gross domestic product in the United States. Any deliberate or natural disruptions resulting from the introduction of new infectious diseases can produce enormous impacts, which can affect domestic consumption, exports, and in the case of zoonotic pathogens, public health. Examples include the introduction of Influenza A virus subtype H1N1 and Porcine epidemic diarrhea virus in swine.25,30 In addition, foreign animal diseases, such as African swine fever and classical swine fever, remain constant threats. The best assurance for the timely identification of known and unknown threats is to employ techniques that can detect endemic, emerging, and foreign animal diseases using a single test. At present, steady-state and real-time polymerase chain reaction (PCR) assays that are widely used for diagnostic pathogen detection and characterization are limited, in that only a single or a few organisms can be investigated in a single assay. While DNA sequencing can greatly expand the scope of pathogen identification, the overall methodology, including data analysis, are lengthy, with costly procedures, and require significant expertise and computational time. In addition, the sensitivity and specificity for the detection of viruses with small genomes may be low as a result of the sample being swamped by host and bacterial sequences. An alternative approach is pathogen microarrays, which probe a sample for specific nucleotide signatures from known agents. Proof of concept has been demonstrated by the application of microarrays for use in clinical medicine, food safety testing, environmental monitoring, and for biodefense.2,12,15,21,22,31,32 The Lawrence Livermore Microbial Detection Array (LLMDA; Lawrence Livermore National Laboratory, Livermore, California) was developed to probe for all known microbiological agents for which whole genomes are available. The most recent version, 8 current as of June 2013, can detect 8,101 species of microbes including 3,856 viruses, 3,855 bacteria, 254 archaebacteria, 100 fungi, and 36 protozoa. The microarray targets both conserved and unique genomic regions of sequenced microbial strains. Multiple microbe targets provide confirmation and can serve as an internal validation mechanism. Ease of use by diagnostic personnel is provided by an automated data analysis algorithm, Composite Likelihood Maximization Method (CLiMax), which is integrated with a web interface that enables LLMDA data analysis within 30 min.
Array technology has been successfully applied to the discovery of agents responsible for undiagnosed syndromes. In addition, some world reference laboratories for transboundary animal diseases, such as the Friedrich-Loeffler-Institut in Germany, the Animal Health and Veterinary Laboratories Agency in the United Kingdom, and the National Veterinary Services Laboratories in the United States, have utilized pan-pathogen microarrays for detection of new or emerging disease agents.
As the cost of technology continues to decrease and throughput increases, it is becoming feasible to include microarrays as everyday tools for use in the diagnostic laboratory. The most common applications in swine are for the diagnosis of unknown and polymicrobial infections. In this study, we leveraged a project incorporating the experimental infection of a large number of pigs with Porcine reproductive and respiratory syndrome virus (PRRSV) and Porcine circovirus-2 (PCV-2) to investigate the application of the LLMDA for use in the analysis of common clinical samples. Both viruses are endemic in pig populations globally and both infections support polymicrobial syndromes, such as porcine respiratory disease complex and porcine circovirus-associated disease (PCVAD).3,4,29
In veterinary diagnostics, serum is a standard sample for evaluating molecular and serological testing for the presence of a variety of pathogens. One alternative is oral fluid, which is typically collected by allowing pigs in a pen or group to chew on a rope. The oral fluid contents include serum components, which leak out of capillary beds that line the buccal cavity. Advantages to oral fluid over serum include: 1) ease of collection by animal caretakers; 2) the relative noninvasive nature of the collection procedure; 3) collection of samples on an as-needed basis; and 4) the collection of a “pooled” sample for increased coverage in large commercial swine operations. Drawbacks include the potential dilution effect of multiple pigs contributing to a single oral fluid sample. Dilution also occurs as a result of the serum component being overwhelmed by other oral fluid contents. It is also possible that only healthy, noninfected animals will actively chew on the rope. And finally, the pathogen may not be shed in oral fluids. However, a previous study 18 demonstrates that, in some cases, oral fluid sampling can detect the introduction of a virus into a population at an earlier time than standard serum sampling protocols.
The purpose of this study was to evaluate the LLMDA for use in serum, oral fluid, and tonsil samples from pigs coinfected with PRRSV and PCV-2. The assay was compared with standard PCR methods for the detection of PRRSV, an RNA virus, and PCV-2, a DNA virus. Because PRRSV and PCV-2 are immunosuppressive, a second goal was to evaluate the presence of other agents that are likely to contribute to disease.
Materials and methods
Pigs and viruses
All experiments involving animals and viruses were approved by the Kansas State University institutional animal care and biosafety committees. The samples for analysis were obtained as part of a study to determine the influence of host genetics in pigs during experimental infection with PRRSV and PCV-2. 23 The PRRSV/PCV-2 inoculum was originally prepared from a lymph node derived from a pig with severe postweaning multisystemic wasting syndrome (PMWS).27,28 Because wild-type PCV-2 subgenotype b does not propagate to high levels in cell culture, we took advantage of the heat stability of PCV-2 to make a virus preparation from a lymph node suspension enriched for PCV-2. The suspension was heat-treated at 55°C for 30 min. Prior to heat treatment, virus isolation for PRRSV was performed on MARC (cloned African green monkey kidney cell line)-145 cells. The treated PCV-2 homogenate was recombined with PRRSV to infect cesarean-derived, colostrum-deprived (CDCD) pigs. A combination lung and lymph node homogenate was prepared from the CDCD pigs, and PRRSV and PCV-2 were isolated from the homogenate by the methods described above. After isolation, the viruses were recombined to yield final concentrations of 103.6 TCID50/dose of PCV-2 and 105 TCID50/dose of PRRSV. The experimental design included the infection of 200 pigs, 7 weeks of age. Each pig was challenged with 1 mL intranasally and 1 mL intramuscularly of viral inoculum. Four weeks prior, one-half of the pigs were vaccinated with a commercial PRRS modified live virus vaccine (AF159149) according to the label instructions. Blood samples were collected from all pigs on 0, 4, 7, 11, 14, 21, 28, 35, and 42 days postinfection (dpi). Oral fluid was collected by suspending a 1.25 cm in diameter twisted cotton rope in a pen of ~12 pigs. One week prior to the initiation of the experiment, pigs were conditioned to chew on the rope. For oral fluid collection, the rope was suspended at approximately shoulder high for the pigs, and pigs were allowed to actively chew on the rope for ~30 min. The rope was removed and placed in a sealed plastic bag; fluid contents were extracted with a double roller wringer and stored at −80°C prior to use.
PRRSV and PCV-2 PCR
Viral DNA and RNA were extracted simultaneously from serum and oral fluid samples using a viral isolation kit a in accordance to the manufacturer’s instructions. Fifty microliters of serum or oral fluid sample was added to 130 μL of lysis buffer. RNA was eluted into 50 μL of elution buffer and 7 μL was added to PCR. DNA was eluted into 50 μL, and 2 μL used for PCR.
Viral DNA was extracted from tonsils using a commercial DNA extraction kit b following the manufacturer’s instructions for tissue. Twenty milligrams of tonsil tissue was added to 180 μL of lysis buffer. PRRSV RNA was quantified by real-time reverse transcription (RT)-PCR assay c according to the manufacturer’s instructions. For consistency, each plate contained quantification standards and control sets d for use with commercial real-time RT-PCR assay c reagents. All PCR reactions were carried out on a thermal cycler e in a 96-well format using the recommended cycling parameters. PCV-2 DNA was quantified using a commercial SYBR Green assay. f PCV-2 DNA was amplified using the forward primer 5′-AATGCAGAGGCGTGATTGGA-3′ and reverse primer 5′-CCAGTATGTGGTTTCCGGGT-3′. Primers were used at a final concentration of 300 μM in a 20-μL reaction. Positive and negative controls were included on each plate. Plasmid DNA with a PCV-2 sequence (field strain PCV-2b 321/393) was used for the PCV-2 standard curve and positive control. Plasmid DNA was isolated using a commercial plasmid purification kit. g The DNA was quantified using a spectrophotometer. h The standard curve for this assay was performed by diluting the purified plasmid DNA 1:1,000 in nuclease-free water followed by 5 serial 1:10 dilutions. The final standard curve possessed 6 points ranging from ~102 to 107 genome copies of template, which produced threshold values between 15 and 33 cycles in the PCR reaction. Standard curves were run in duplicate with nuclease-free water as a negative control. The PCV-2 PCR was carried out using the following settings: activation at 98°C for 2 min, followed by 40 cycles of denaturing at 98°C for 5 sec and annealing/extension at 60°C for 10 sec. The melting curve was performed between 65°C and 95°C using 0.5°C increments. The assay results were reported as log10 PRRSV RNA starting quantity (copy number) or PCV-2 DNA starting quantity per reaction.
Microarray analysis
Each extracted sample possessed a volume of 1 mL, which consisted of 250 μL of oral fluid or serum sample and 750 μL of Trizol LS reagent. i For tonsil samples, 20 mg of tissue was added to 1 mL of TRIzol reagent. The purpose of adding TRIzol was to inactivate all viruses and bacteria in tissue and serum samples so they could be shipped to Lawrence Livermore National Laboratory for molecular analysis. Nucleic acid purification could also be performed using commercially available kits, but only the TRIzol method was used in this study. Each sample was brought to room temperature, 200 μL of chloroform was added, and the tube was shaken vigorously for 15 sec. Samples were incubated at room temperature for 15 min and then centrifuged at 12,000 × g for 15 min at 4°C. The upper aqueous layer was removed by pipetting and placed in a new tube for RNA extraction. The lower phases were saved for DNA extraction. For RNA extraction, 10 µg of glycogen was added to the aqueous phase along with 500 μL of 100% isopropanol. Following 10 min of incubation, samples were centrifuged for 10 min at 12,000 × g at 4°C. The supernatant was removed, and the RNA pellet was washed with 1 mL of 75% ethanol. The sample was vortexed and centrifuged at 7,500 × g for 5 min at 4°C. Following centrifugation, the supernatant was removed, and the RNA was air dried for 10 min. RNA pellets were resuspended in 30 μL of diethylpyrocarbonate water, and RNA concentration was determined by a spectrophotometer h and a fluorometer. j
For DNA isolation, 300 μL of 100% ethanol was added to the interphase/organic phase; the tube was inverted several times, and then incubated for 3 min at room temperature. Samples were centrifuged at 2,000 × g for 5 min at 4°C, and the supernatant was discarded. The DNA pellet was washed with 1 mL of sodium citrate–ethanol solution (0.1 M sodium citrate in 10% ethanol, pH 8.5), incubated for 30 min at room temperature, centrifuged at 2,000 × g for 5 min at 4°C, and the supernatant was removed. The sodium citrate–ethanol wash procedure was repeated once more. Following the wash procedures, 2 mL of 75% ethanol was added to the pellet and incubated at room temperature for 20 min and centrifuged at 2,000 × g for 5 min at 4°C. The supernatant was removed, and the samples were air dried for 10 min. DNA pellets were resuspended in 50 μL of 8 mM NaOH solution, and the DNA concentration was determined by a spectrophotometer h and a fluorometer. j
For each sample, 5 μL (0.67–28.4 ng/μL) of extracted RNA was used as input into the random amplification procedure. The random amplification was initiated by first converting the RNA to complementary (c)DNA as described previously. 10 To complete the amplification of the samples, 5 μL of the double-stranded cDNA reaction was mixed with 10 μL of 5× Phusion high-fidelity buffer, k 1 μL of deoxyribonucleotide triphosphate (10 mM), 1 μL of primer 5′-GATGAGGGAAGATGGGG-3′ (100 pmol/μL), 0.5 μL of DNA polymerase, k and 32.5 μL of water. This 50 μL was then cycled in a thermocycler l with the following conditions: 98°C for 2 min, 35 cycles of [98°C for 1 min, 60°C for 1 min, 72°C for 1 min], and 72°C for 10 min. Amplified cDNA was purified using a commercial DNA purification kit. m The amplified cDNA yield was 644–1580 ng as determined by a fluorometer. j For each DNA sample, 5 μL (0.036–0.90 ng/μL) was used as input into a commercial amplification kit n reaction using the standard manufacturer’s protocols. The amplified DNA was purified using a DNA purification kit, m and the yield was determined to be 5,400–9,200 ng by fluorometer. j
Approximately 400–500 ng of amplified cDNA and DNA were mixed together and labeled using a 1-color labeling kit o following the standard manufacturer’s protocols. Comparative genomic hybridization (CGH) mix p was prepared following the standard manufacturer protocol with 10 µg of fluorescently labeled DNA added for each sample. Each labeled sample was mixed with the CGH mastermix, denatured at 95°C for 3 min, and incubated at 65°C until the arrays were ready to load. The LLMDAv7 4x180K microarray q was utilized for this work, and samples were loaded onto the array and allowed to hybridize for 40 hr at 65°C in a rotator oven r set to rotation speed 20. After hybridization, the microarrays were washed following standard manufacturer protocols with CGH wash buffers. s Each array was washed for 5 min in CGH Wash 1 at room temperature followed by 1 min in CGH Wash 2 at 37°C. After washing, the microarrays were exposed to a stream of nitrogen gas to remove any particulates from the array surface. Microarrays were scanned on a microarray scanner t at a resolution of 2 µm.
Microarray data was analyzed using the CLiMax method developed at Lawrence Livermore National Laboratory. 8 The log likelihood for each of the possible targets is estimated from the BLAST similarity scores of the array feature and target sequences, together with the feature sequence complexity and other covariates derived from the BLAST results. 8 Presented are the data for microbe sequences that were ≥99% threshold.
Results
Analysis of the inoculum used for experimental infection of pigs
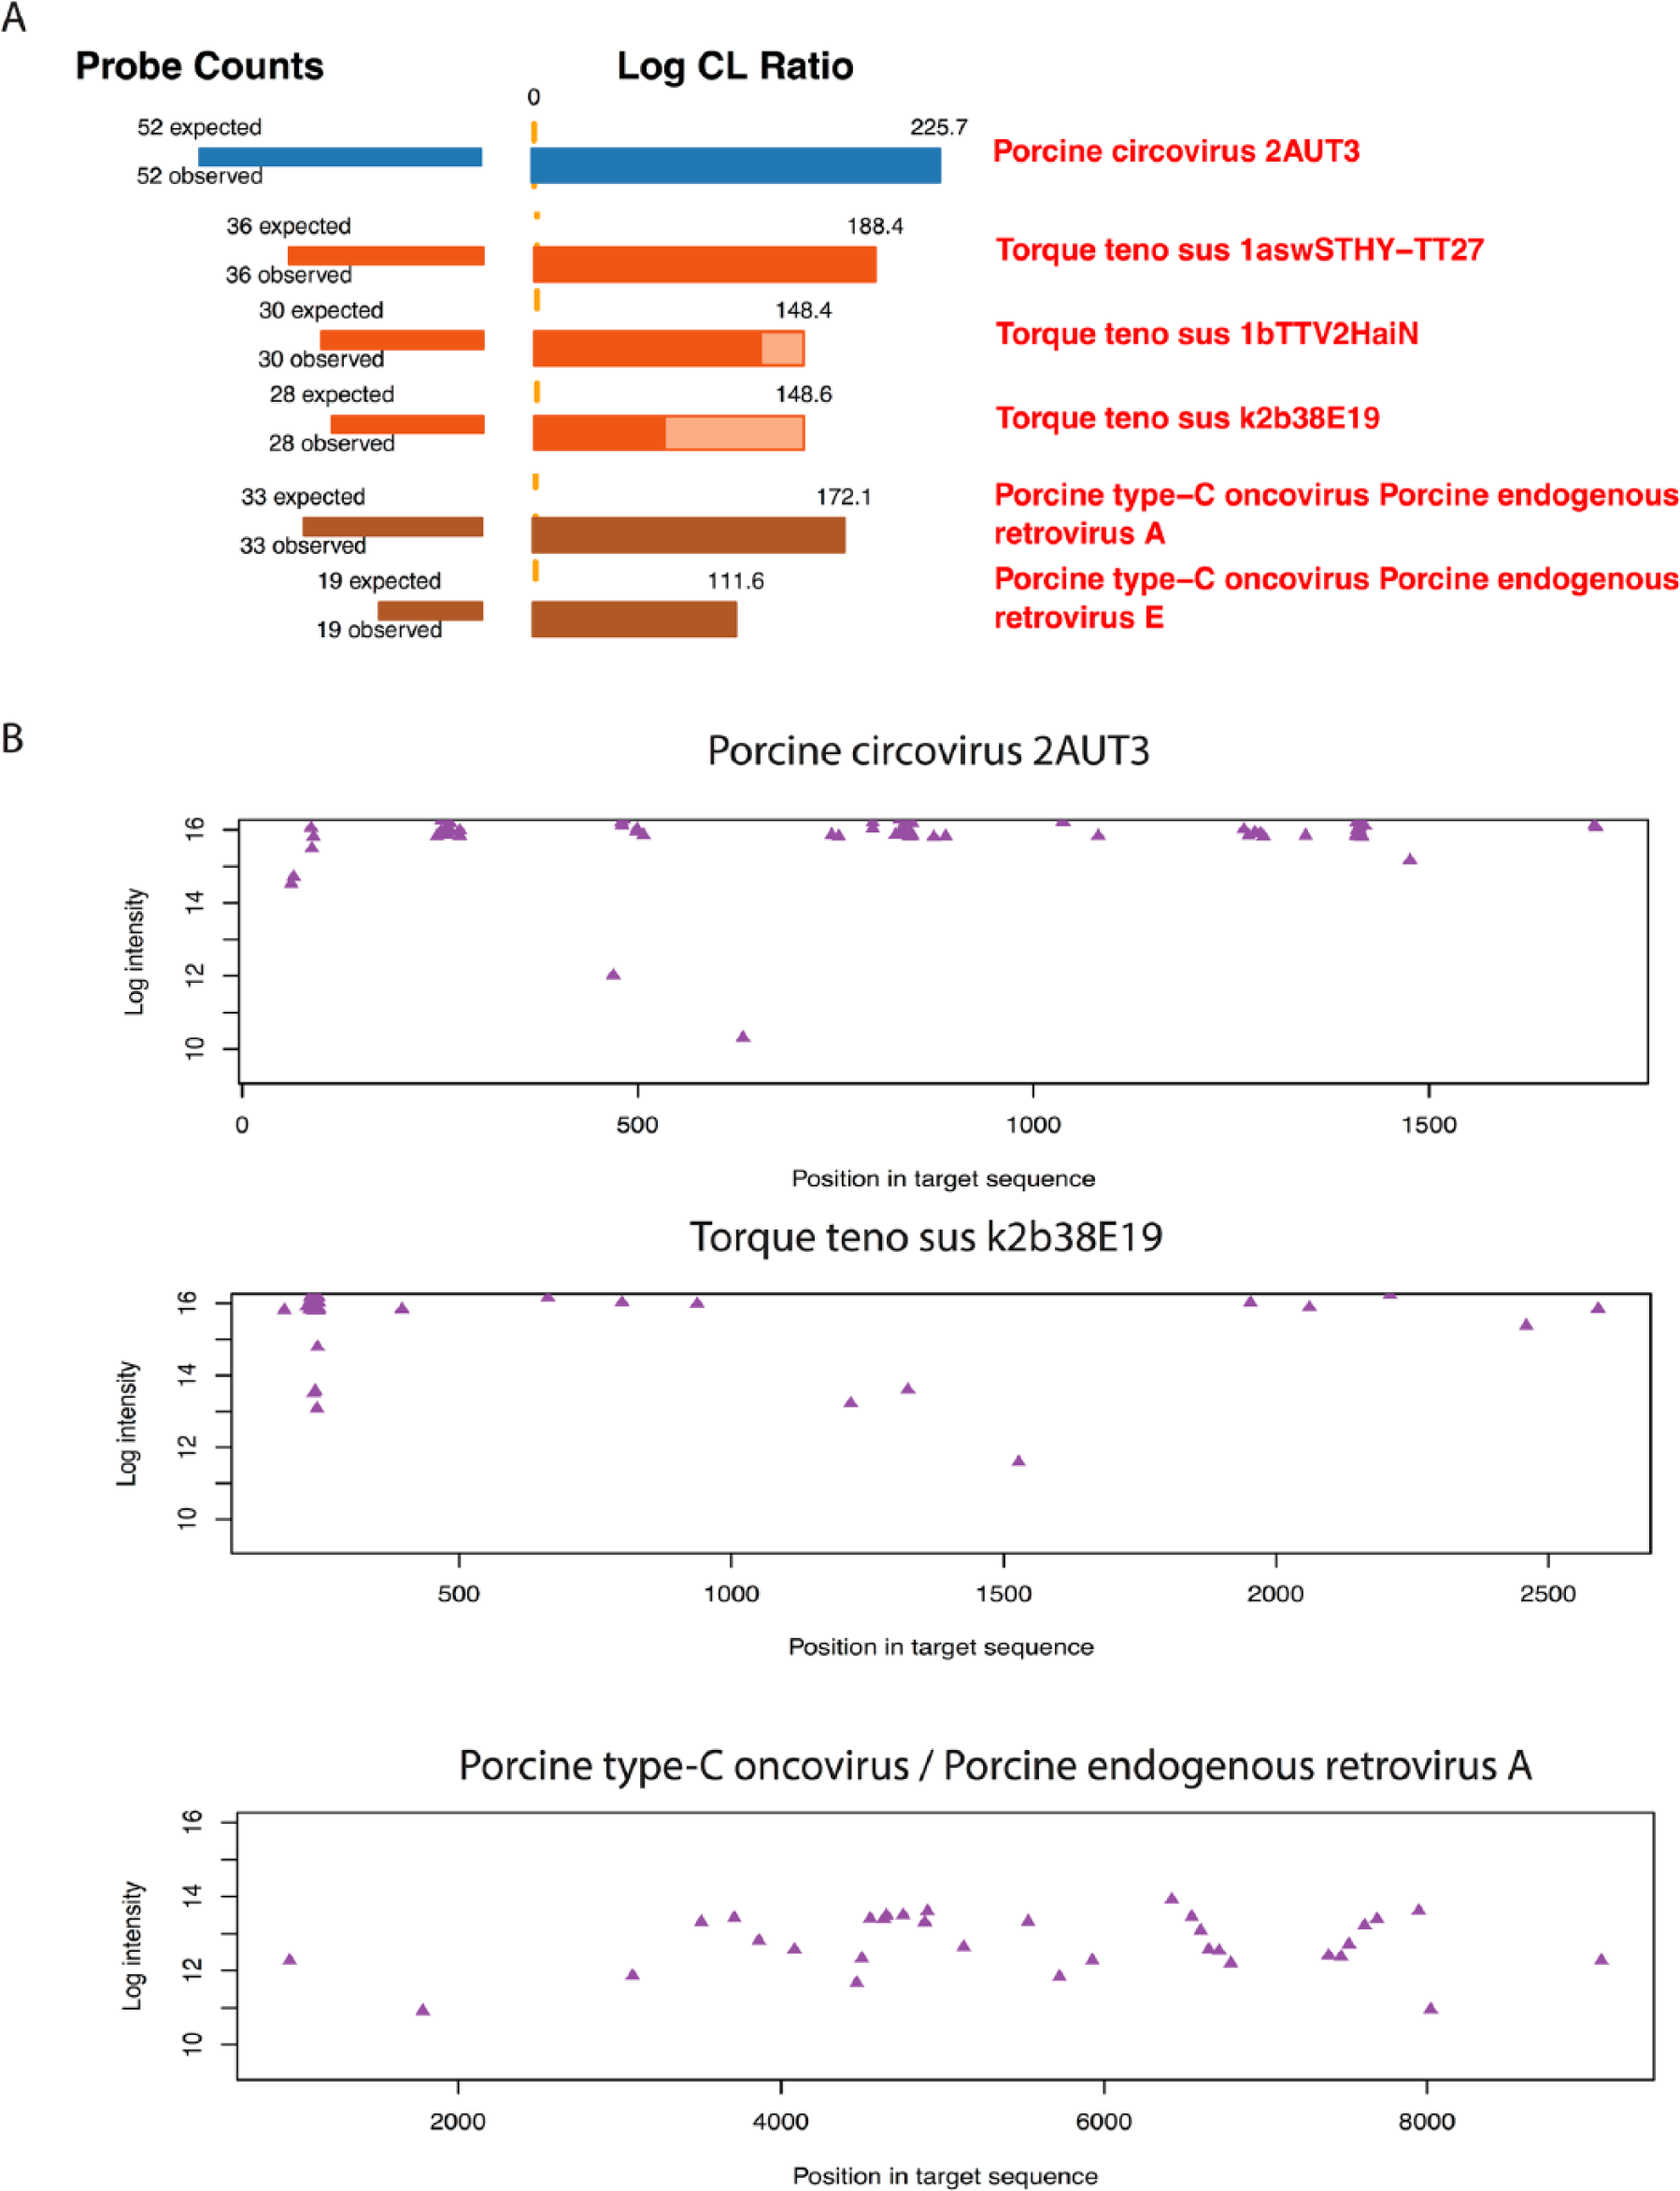
Pigs were infected with an inoculum derived from 2 sources: heat-treated homogenized pig lymph node and the simian cell line, MARC-145. Because it was not possible to grow PCV-2 to sufficient levels in culture, we incorporated a heat-treated homogenate originally obtained from a pig that exhibited PMWS. As summarized in Table 1, the LLMDA analysis of the PCV-2 inoculum identified PCV-2 and additional signatures from 2 virus families. The first was torque teno sus virus (TTSuV), a member of a circular single-stranded DNA virus in the family Anelloviridae. Signatures revealed the presence of 2 genera, Iotatorquevirus, represented by TTSuV-1a and -1b, and Kappatorquevirus, represented by TTSuV-k2, subgenotype b. The second group of viruses identified was Porcine type-C oncovirus genotypes A and E. The second group of viruses belongs to a group collectively referred to as porcine endogenous retroviruses (PERVs). TTSuV and PERV are ubiquitous within pig populations throughout the world. An example of the outputs for the array analysis results, including log-odds ratios and the array features detected versus expected for the 3 viral families, are shown in Figure 1A. The light- and dark-colored portions of the bars represent the unconditional and conditional log-odds scores, respectively. The conditional log-odds scores show the contribution from a target that cannot be explained by another, more likely the target above it. The unconditional scores illustrate that some similar targets share a number of probes. For TTSuV, features that are unique to 1a, 1b, and k2b were all detected, as illustrated by the dark colored bars in Figure 1A. For PERV A and PERV E, specific features were also detected as illustrated by the dark colored bars in Figure 1A. To further understand the detection of the 3 viral families, CLiMax software was used to generate target sequence-array feature alignment plots, where the intensity of each feature is plotted against its alignment position in the viral genome (Fig. 1B). These plots clarify whether microbe identification is based on the presence of the whole genome or if identification may be due to cross-hybridization from features matching sections of other genomes present in the sample. The sequence-feature alignment plot for PCV-2 showed that the detected array features were distributed across the PCV-2 genome, indicating that the whole viral genome is present in this sample. Similarly, the alignments of features to the target sequences of TTSuV-k2b and PERV A indicated the presence of whole viral genomes. The analysis of the MARC-145 cell preparation identified PRRSV and the presence of Mason-Pfizer monkey virus, a simian endogenous retrovirus that is a likely contaminant of the MARC-145 cell line. As described below, the simian endogenous retro virus was not detected in any of the pig samples.
Pathogen microarray analysis of Porcine circovirus-2 (PCV-2) and Porcine reproductive and respiratory syndrome virus (PRRSV) preparations used for infection of pigs in the current study.
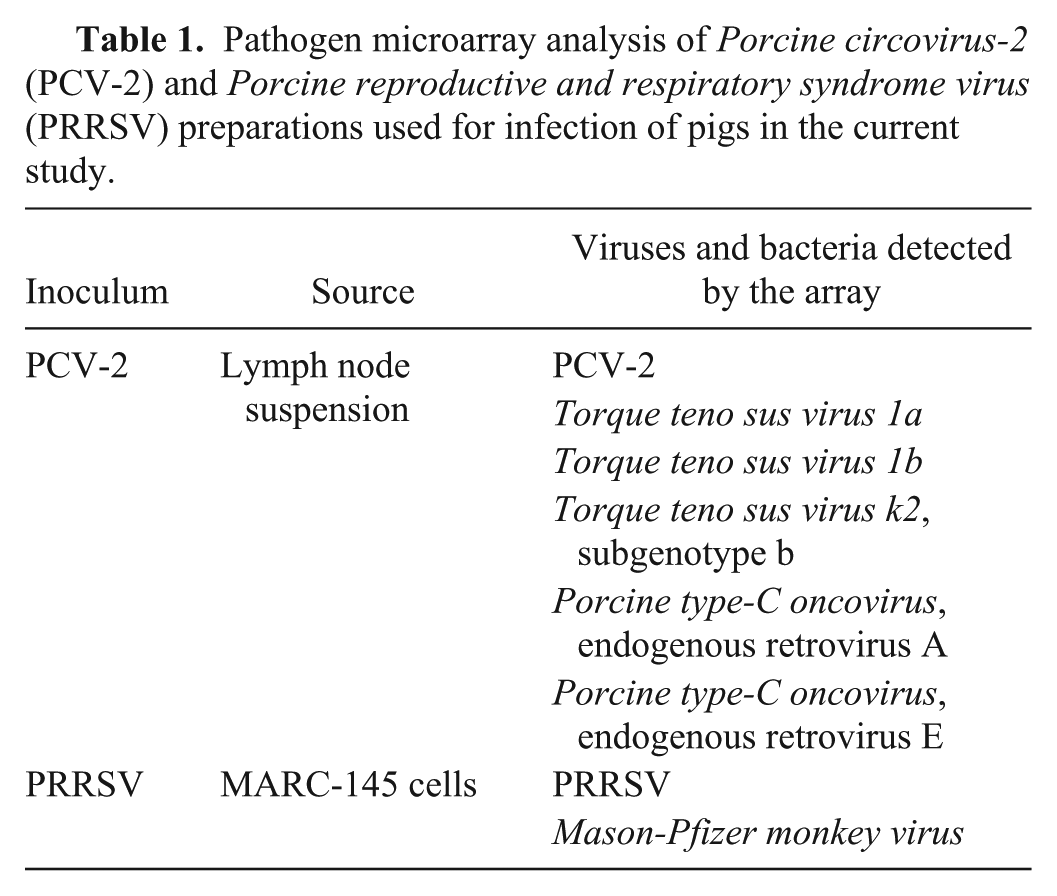
Composite Likelihood Maximization Method (CLiMax) analysis of microarray results detected Porcine circovirus-2 (PCV-2), torque teno sus viruses (TTSuVs), and porcine endogenous retroviruses (PERVs) in the PCV-2 lymph node–derived inoculum.
Analysis of PCV-2 and PRRSV in serum
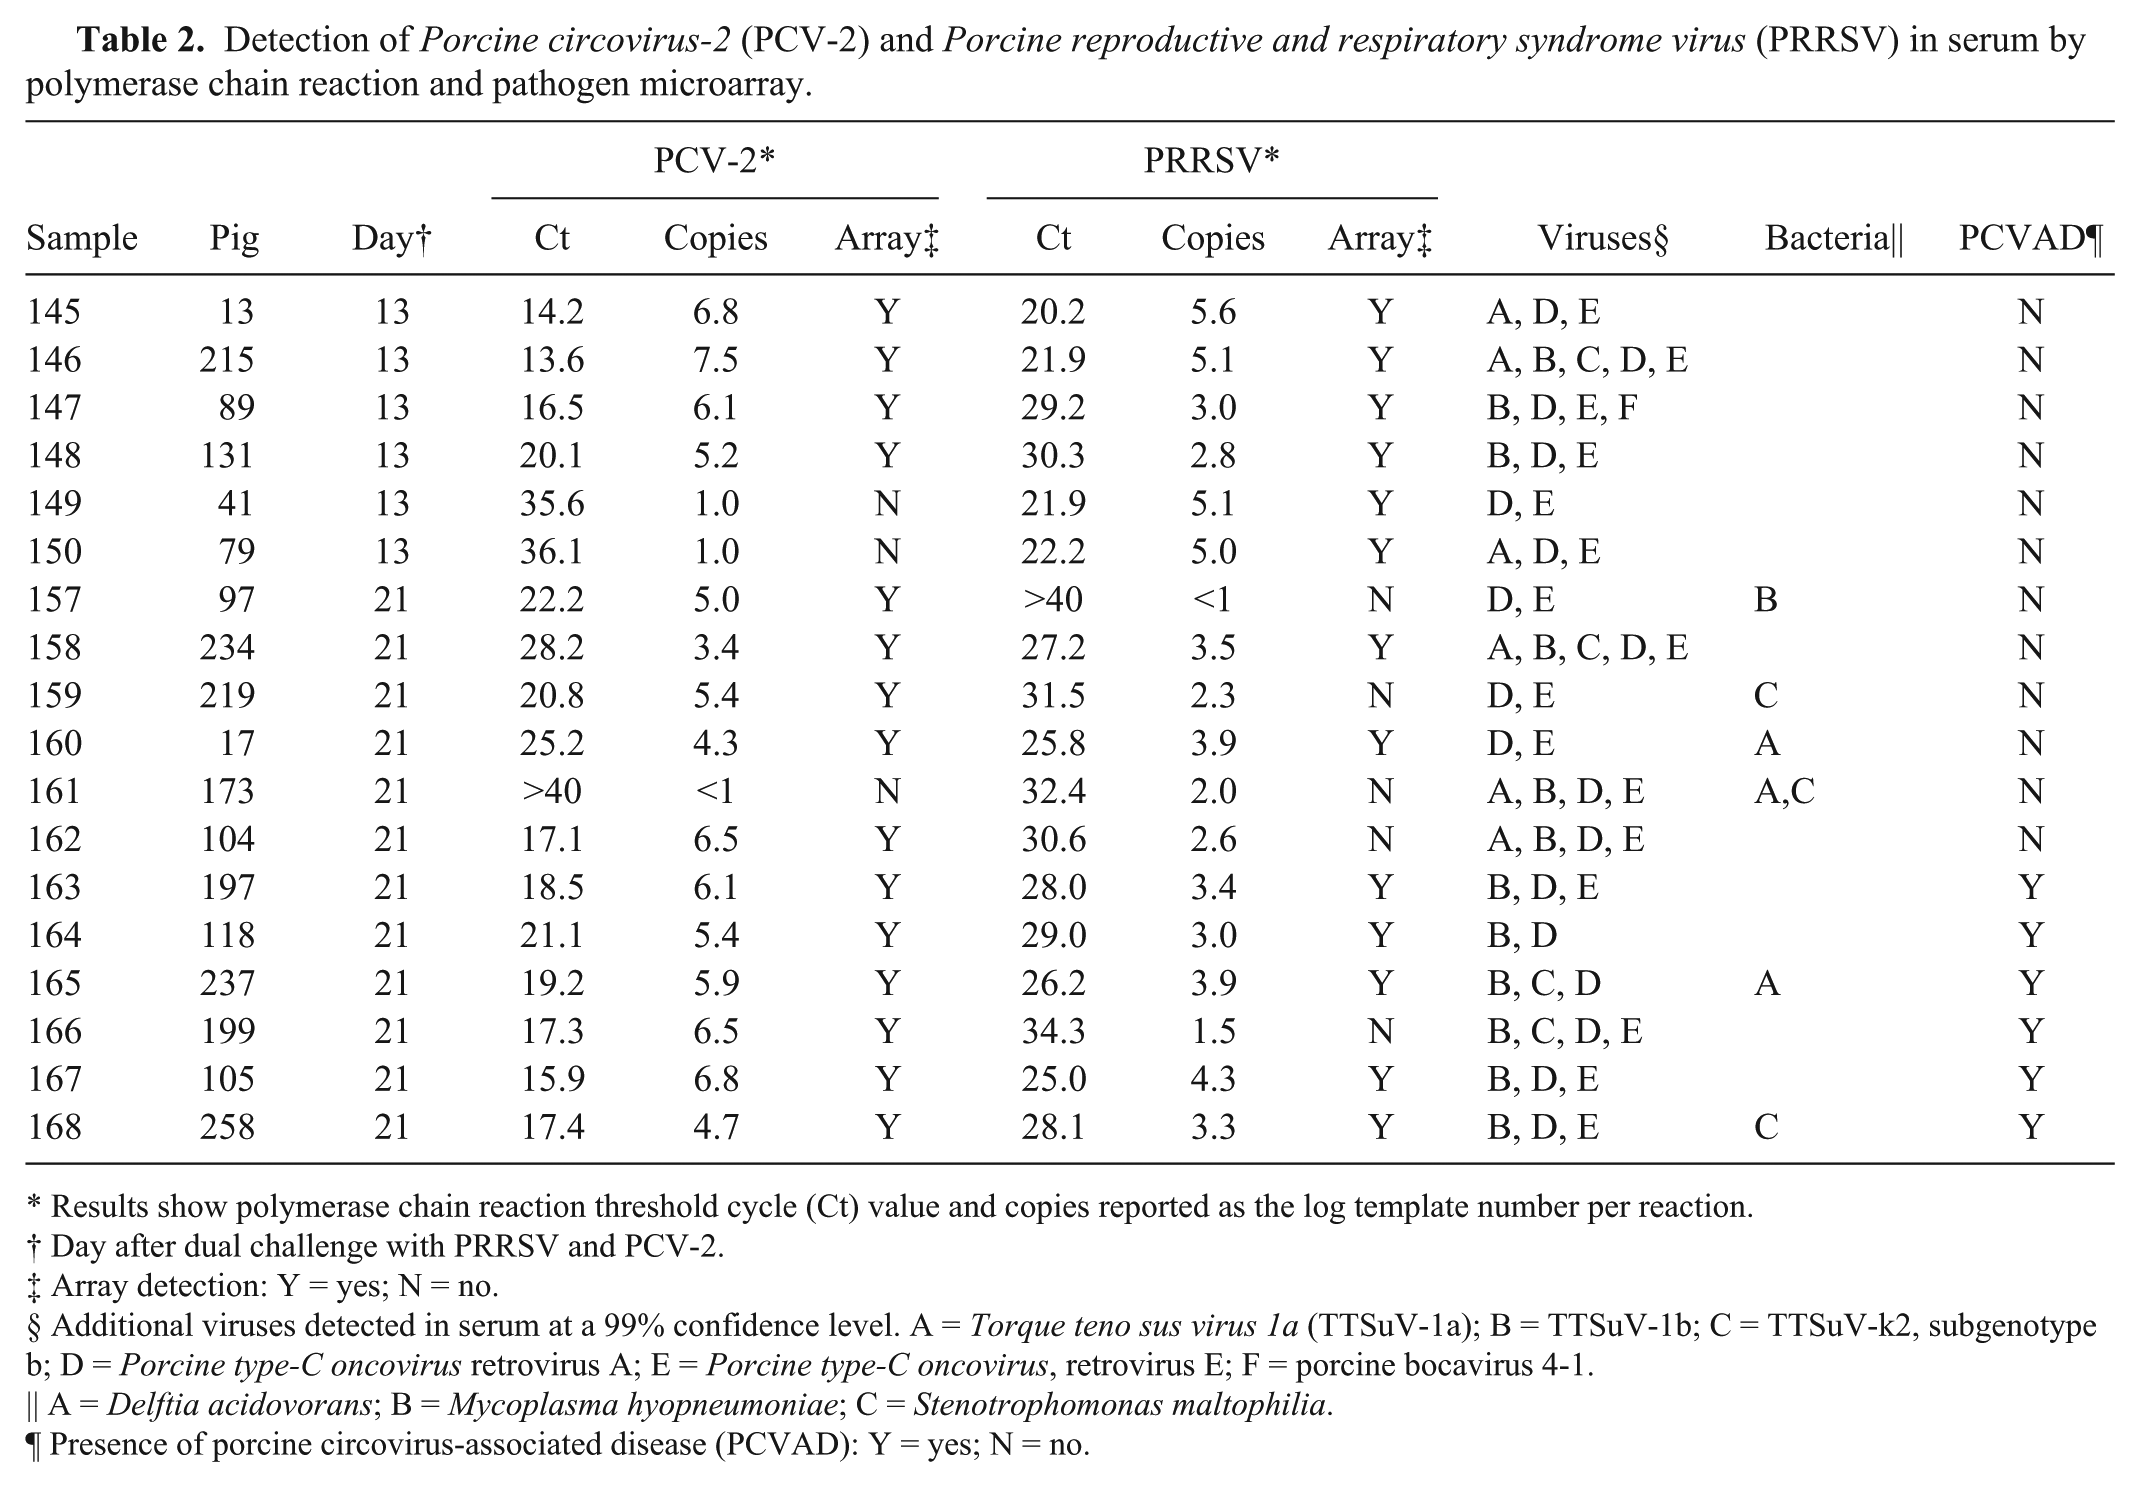
Serum samples for analysis were obtained from pigs at 14 and 21 days after coinfection with PRRSV and PCV-2. Samples were selected based on the presence of different quantities of PCV-2 and PRRSV nucleic acid irrespective of clinical disease presentation. The selection of samples relative to the levels of PRRSV and PCV-2 viremia is shown in Figure 2. Over the course of infection, PRRSV and PCV-2 exhibited different growth kinetics. For PRRSV, the mean viremia peaked at 7 days after infection and then declined until about 42 days, when virus had disappeared from the blood of almost all pigs. In contrast, PCV-2 viremia peaked at about 21 days and remained elevated until the end of the study period. Therefore, the samples collected at 14 and 21 days were likely to include different amounts of PRRSV and PCV-2. The results for the serum samples, presented in Table 2, showed that the LLMDA easily detected PCV-2 and PRRSV. For PCV-2, samples with copy numbers ≥log 3.4 (threshold cycle [Ct] = 28.2) were positive on the array. Similar results were obtained for PRRSV: serum samples with an estimated copy number ≥log 2.8 (Ct = 30.3) were positive on the array; whereas, all samples with a log copy number ≤2.6 (Ct = 30.6) were negative on the array. Even though the data showed that PCR was more sensitive than the array for the detection of PRRSV and PCV-2, the array was able to accurately detect the presence of both viruses when a significant quantity of viral nucleic acid was present.
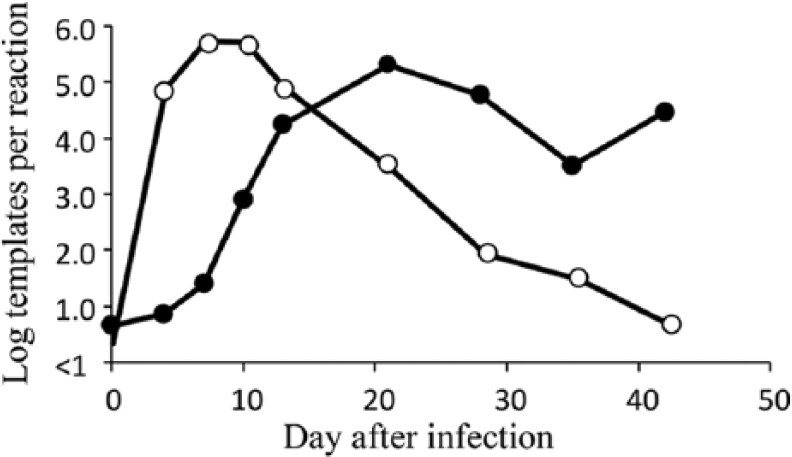
Porcine reproductive and respiratory syndrome virus (PRRSV) and Porcine circovirus (PCV-2) viremia in experimentally infected pigs. Mean viremia for PRRSV shown in open circles and PCV-2 in solid circles. Data is from 200 pigs.
Detection of Porcine circovirus-2 (PCV-2) and Porcine reproductive and respiratory syndrome virus (PRRSV) in serum by polymerase chain reaction and pathogen microarray.
Results show polymerase chain reaction threshold cycle (Ct) value and copies reported as the log template number per reaction.
Day after dual challenge with PRRSV and PCV-2.
Array detection: Y = yes; N = no.
Additional viruses detected in serum at a 99% confidence level. A = Torque teno sus virus 1a (TTSuV-1a); B = TTSuV-1b; C = TTSuV-k2, subgenotype b; D = Porcine type-C oncovirus retrovirus A; E = Porcine type-C oncovirus, retrovirus E; F = porcine bocavirus 4-1.
A = Delftia acidovorans; B = Mycoplasma hyopneumoniae; C = Stenotrophomonas maltophilia.
Presence of porcine circovirus-associated disease (PCVAD): Y = yes; N = no.
In addition to PRRSV and PCV-2, the array detected sequences from other porcine viruses in the serum samples. The most common were TTSuV and Porcine type−C oncovirus, which were also present in the inoculum (Table 1). The Mason-Pfizer monkey virus sequence signatures detected in the MARC-145 cell preparation were not detected in serum or in any of the other samples, suggesting that the contaminating virus is not infectious to pigs. A signature for porcine bocavirus 4-1 was identified in 1 serum sample (no. 147). Signatures for 3 bacteria, Delftia acidovorans (samples160, 161, 165), Mycoplasma hyopneumoniae (sample 157), and Stenotrophomonas maltophilia (samples 159, 161, 168) were also detected.
Peak clinical signs of PCVAD occurred between 22 and 35 dpi (data not shown), which correlated with the presence of high levels of PCV-2 in the blood (see Fig. 2). Six of the pigs included in Table 2 possessed clinical signs and lesions on postmortem examination consistent with PCVAD. Clinical signs included tachypnea, dyspnea, pyrexia, muscle wasting, loss of condition, rhinorrhea, coughing, lethargy, and pale discoloration. Histologic lesions included multifocal interstitial pneumonia, lymphohistiocytic infiltration in the alveolar septa and peribronchiolar areas, and lymphoid depletion in tonsil and lymph nodes with replacement by histiocytes. As detailed in Table 2, mean PCV-2 copy number at day 21 was log 4.1 in the non-PCVAD pigs versus log 5.9 in the PCVAD pigs. Mean PRRSV copy number was log 2.4 in the non-PCVAD pigs versus log 3.2 in the PCVAD pigs. Even though not statistically significant, the PCVAD pigs possessed higher levels of both viruses. Because PCVAD developed after day 21, there were no microbes within the serum sample linked with the eventual clinical outcome.
Analysis of oral fluid samples
Oral fluid is a multisource sample derived from a group of pigs. The composition of oral fluid includes serum exudate from capillaries lining the buccal cavity, saliva, other oral cavity contents, etc. Additional sources of microbes in the sample may include skin and fecal material as well as microbes from environmental sources, such as feed, water, and pen surfaces. For this study, oral fluid samples were obtained at 13 days after infection from 6 pens (~12 pigs per pen). Thirteen days postinfection was a time when significant amounts of both PCV-2 and PRRSV were present in serum (see Fig. 2). PCV-2/PRRSV PCR and microarray results are summarized in Table 3. The pathogen microarray identified the presence of PCV-2 in all samples. Quantities of PCV-2 DNA ranged between 4.3 and 5.6 log templates per reaction. All oral fluid samples were negative for PRRSV by microarray, and only 1 sample was PRRSV PCR positive. The Ct value for the 1 PRRSV-positive sample was 38.6 or <1 log template per reaction. The lack of array or PCR detection of PRRSV indicated a lack of significant virus shedding in oral fluid during the period tested.
Polymerase chain reaction and microarray detection of viruses in oral fluid samples at 13 days after infection with Porcine reproductive and respiratory syndrome virus (PRRSV) and Porcine circovirus-2 (PCV-2).
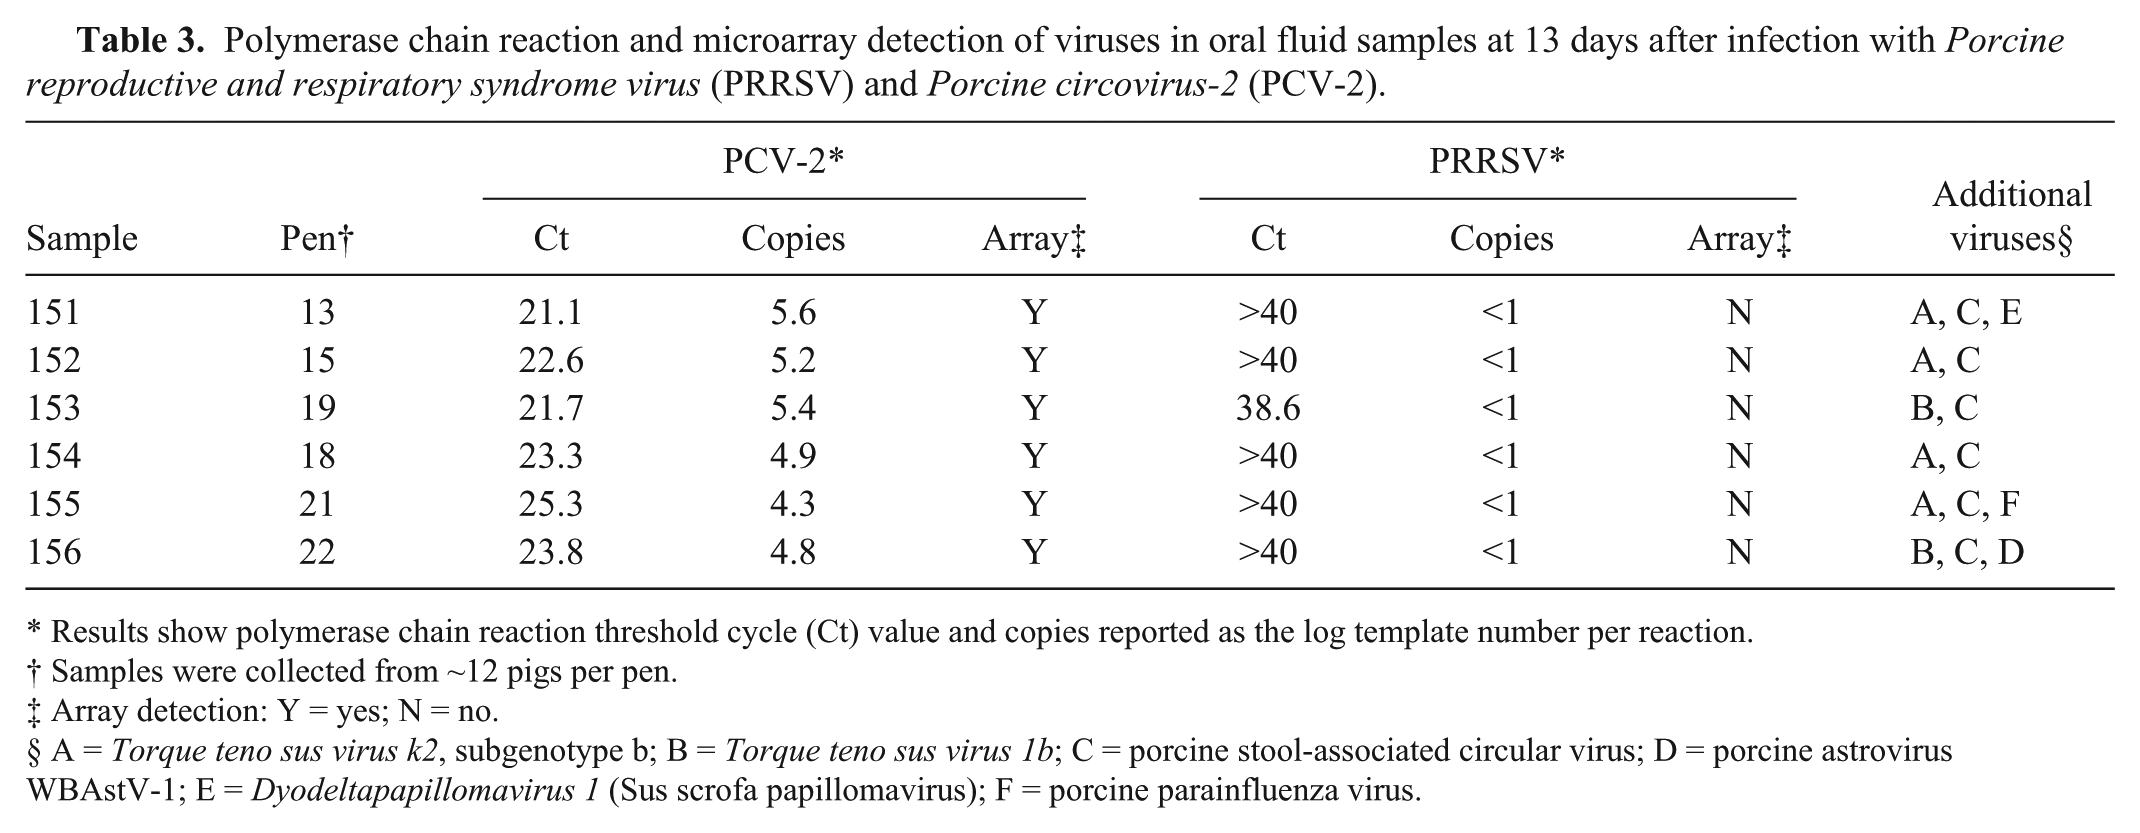
Results show polymerase chain reaction threshold cycle (Ct) value and copies reported as the log template number per reaction.
Samples were collected from ~12 pigs per pen.
Array detection: Y = yes; N = no.
A = Torque teno sus virus k2, subgenotype b; B = Torque teno sus virus 1b; C = porcine stool-associated circular virus; D = porcine astrovirus WBAstV-1; E = Dyodeltapapillomavirus 1 (Sus scrofa papillomavirus); F = porcine parainfluenza virus.
Signatures for a variety of viruses were identified in the oral fluid sample, including TTSuV (6/6 samples), which was also found in serum and the inoculum used for infection. In addition, array signatures revealed the presence of porcine stool-associated circular virus (6/6 samples), astrovirus (1 sample), dyodeltapapillomavirus or Sus scrofa papillomavirus (1 sample), and porcine parainfluenza virus (PPIV; 1 sample). At a lower detection stringency (feature signal at 95% above random controls), astrovirus was detected in 3 additional samples (data not shown). All 4 viruses have been previously described in pigs.5,14,16,24
Signatures related to 15 bacterial genera were identified. As summarized in Table 4, predominate bacteria were Streptococcus suis (6/6 samples), Clostridium sp. (6/6 samples), and Staphylococcus sp. (6/6 samples). Within this group, S. suis is an important swine pathogen and a disease cofactor frequently associated with PRRSV and PCV-2 infections.7,26 The other bacterial pathogens identified were Enterococcus sp. (4/6 samples), Psychrobacter sp. (3/6 samples), Bibersteinia trehalosi (3/6 samples), Aerococcus viridans (3/6 samples), Actinobacillus pleuropneumoniae (2/6 samples), Lactococcus sp. (3/6 samples), Mycoplasma moatsii (2/6 samples), Enhydrobacter aerosaccus (2/6 samples), Bergeyella zoohelcum (2/6 samples), and Lactobacillus sp. (1/6 samples). The signature for a plasmid from Haemophilus parasuis was detected in 1 sample (data not shown).
Microarray detection of bacteria in oral fluid samples at 13 days after infection with Porcine reproductive and respiratory syndrome virus (PRRSV) and Porcine circovirus-2 (PCV-2).*
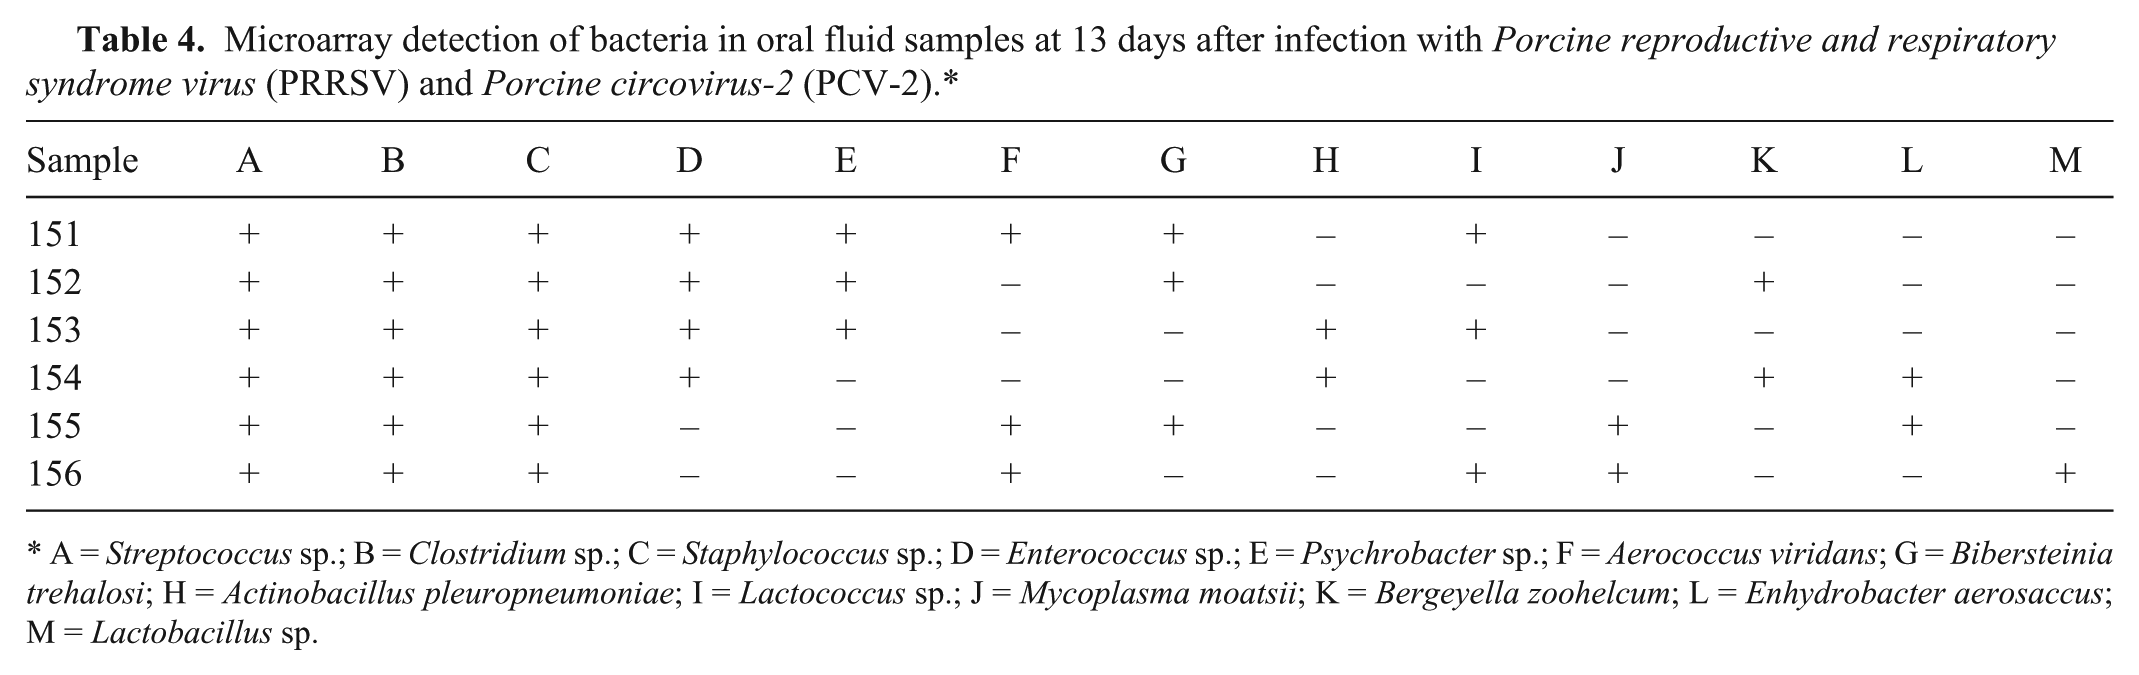
A = Streptococcus sp.; B = Clostridium sp.; C = Staphylococcus sp.; D = Enterococcus sp.; E = Psychrobacter sp.; F = Aerococcus viridans; G = Bibersteinia trehalosi; H = Actinobacillus pleuropneumoniae; I = Lactococcus sp.; J = Mycoplasma moatsii; K = Bergeyella zoohelcum; L = Enhydrobacter aerosaccus; M = Lactobacillus sp.
Microarray analysis of tonsil
The results for tonsil, collected at termination or 42 days after coinfection, are summarized in Table 5. At 42 days, PCV-2 was still present at relatively high levels in the blood, but PRRSV had largely disappeared (see Fig. 2). Of the tonsil samples available for PCR testing, PCV-2 was easily detected in all samples with values ranging between 1.6 and 6.6 log templates per reaction. The microarray detected the presence of PCV-2 in all but 1 tonsil sample, which had a PCR value equivalent to 1.6 log templates per reaction (Ct = 34.4). At 42 days, the array failed to detect PRRSV. Four tonsil samples were positive by PRRSV PCR (Ct = 32.3–36.0 or 0.9–2.1 log templates).
Polymerase chain reaction and microarray analysis of tonsils at 42 days after infection of pigs with Porcine circovirus-2 (PCV-2) and Porcine reproductive and respiratory syndrome virus (PRRSV).
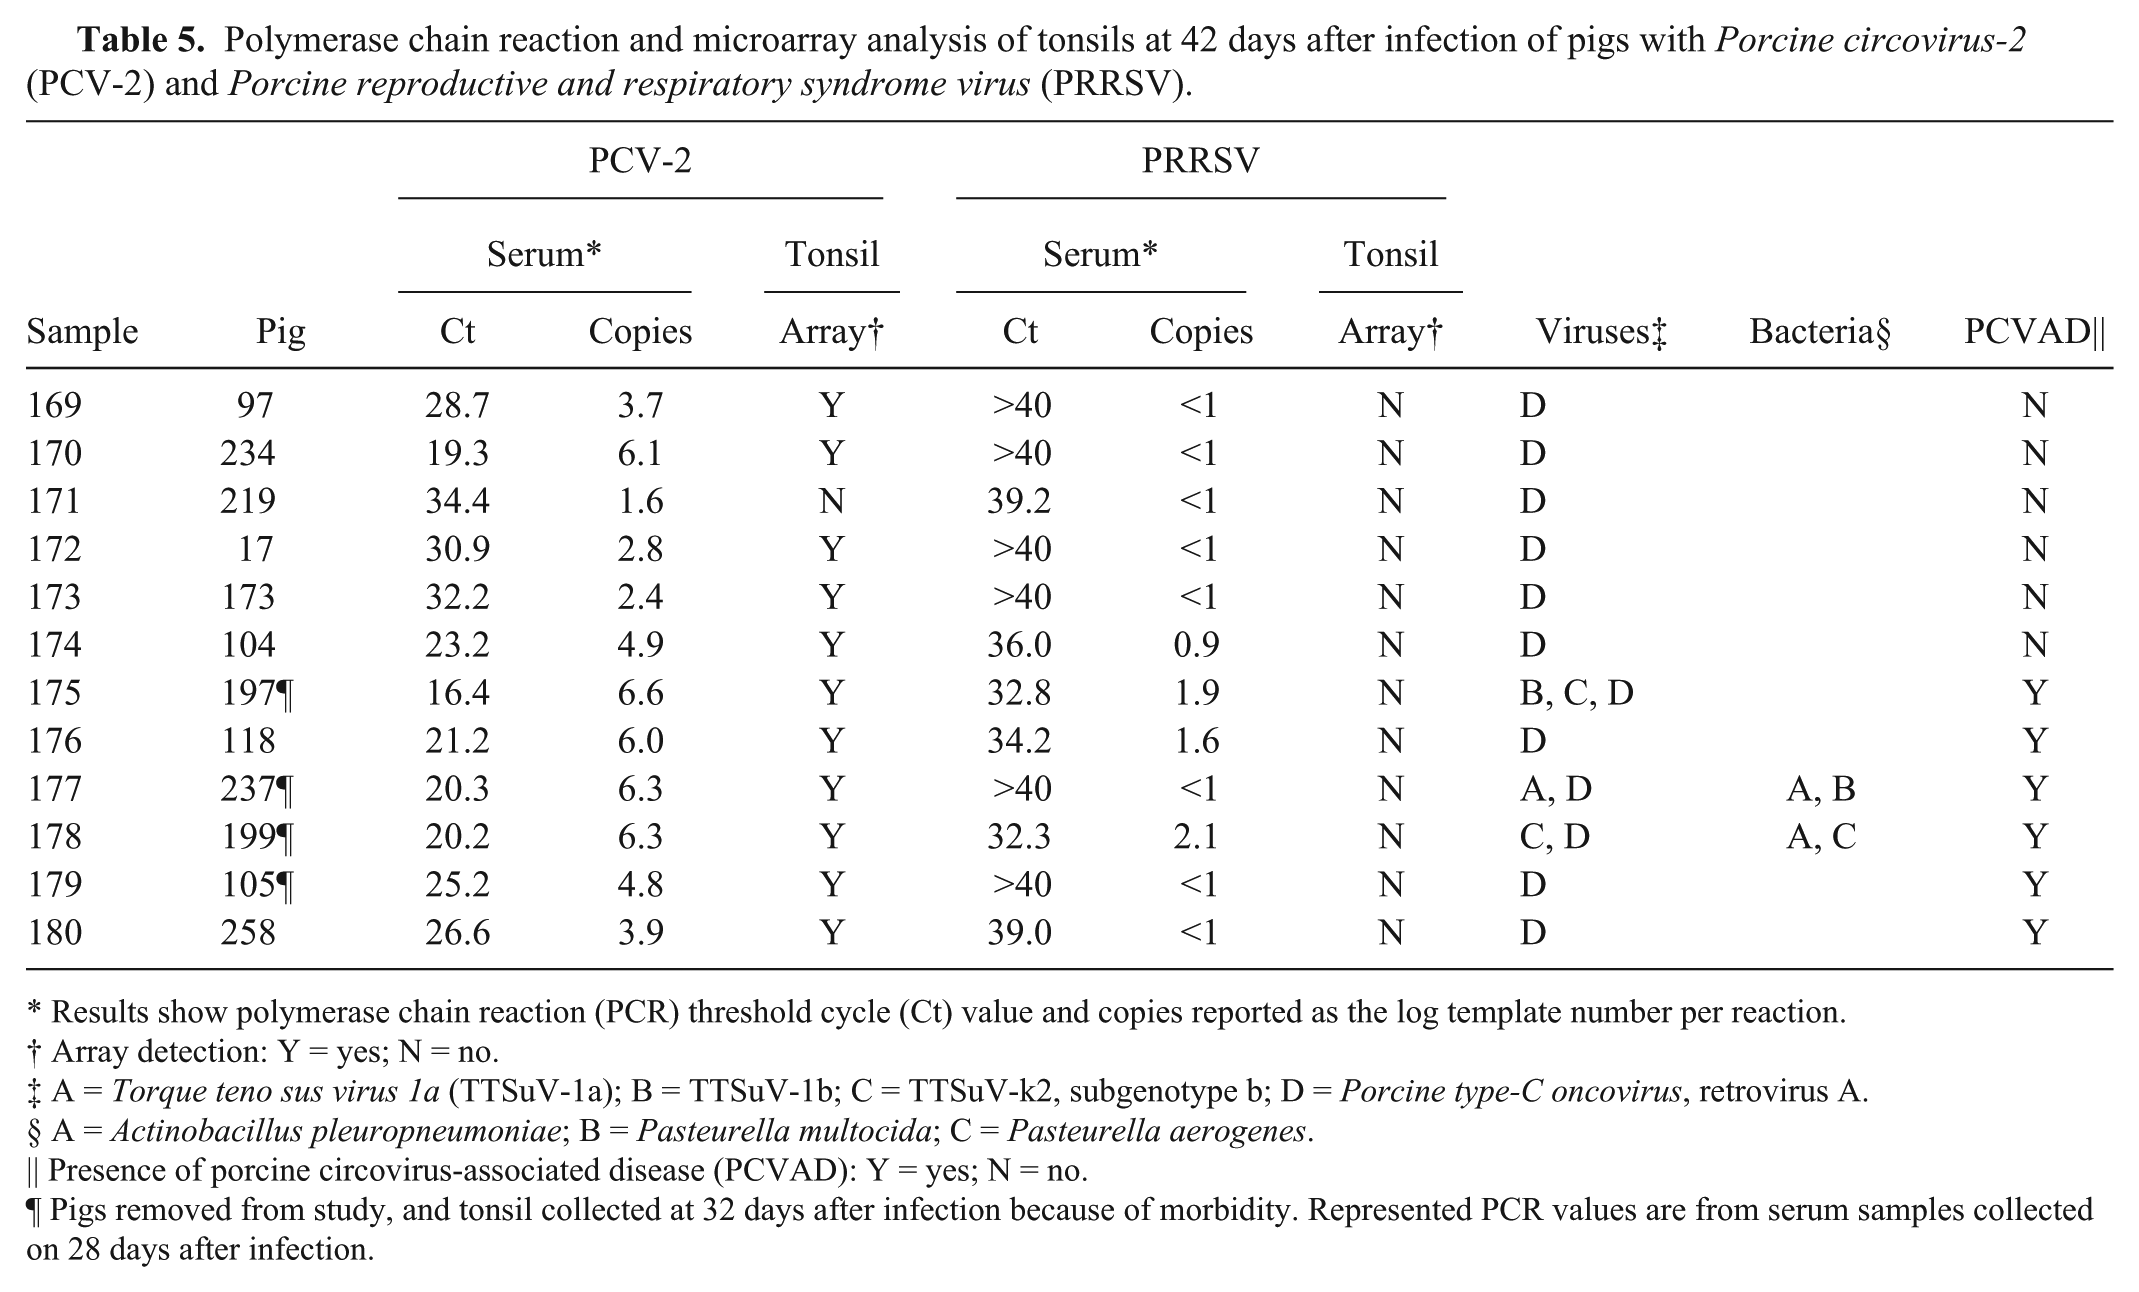
Results show polymerase chain reaction (PCR) threshold cycle (Ct) value and copies reported as the log template number per reaction.
Array detection: Y = yes; N = no.
A = Torque teno sus virus 1a (TTSuV-1a); B = TTSuV-1b; C = TTSuV-k2, subgenotype b; D = Porcine type-C oncovirus, retrovirus A.
A = Actinobacillus pleuropneumoniae; B = Pasteurella multocida; C = Pasteurella aerogenes.
Presence of porcine circovirus-associated disease (PCVAD): Y = yes; N = no.
Pigs removed from study, and tonsil collected at 32 days after infection because of morbidity. Represented PCR values are from serum samples collected on 28 days after infection.
Six of the tonsil samples were collected from pigs with clinical signs and showed lesions consistent with PCVAD. Four of these pigs were euthanized at 32 dpi due to severity of clinical signs. At the time of postmortem examination, all 6 PCVAD pigs had significant levels of PCV-2 in the serum, and all tonsil samples had PCV-2 detected on the microarray.
Other virus signatures detected in tonsil included TTSuV (3/12 tonsils) and porcine oncovirus (12/12 samples). TTSuV was only found in tonsils from pigs with PCVAD. For bacteria, A. pleuropneumoniae was detected in 2 samples, Pasteurella multocida plasmid sequence was found in 1 sample, and Pasteurella aerogenes was found in 1 sample. Bacteria were only found in tonsils from pigs with PCVAD.
Summary of pathogens detected by array
Apart from the association of a given microbe with pigs, one way to evaluate the validity of a result is to determine the number of targets hybridized in the array. A summary of all the viruses and bacteria detected in different sample matrices in this study is presented in Table 6. The number of probes detected, and number of probes designed and expected to hybridize to the target, and the percentage of detected probes are also provided in Table 6. Between 82% and 100% of expected features showed a positive result, providing a high confidence for specific detection. Table 6 also shows that oral fluid provided the greatest number of positive results. The detailed target sequence-array feature alignment plot for oral fluid sample 151 is shown in Figure 3. Multiple microarray features were detected for each pathogen across different regions of the pathogen genome, an additional indication for the positive presence of the pathogen. The plots for the other oral fluid samples (152–156) show that multiple array feature regions across the genomes were detected for each microbe (Supplementary Figures 1–5, available at http://vdi.sagepub.com/content/by/supplemental-data).
Summary of infectious agents detected by the pathogen microarray.*
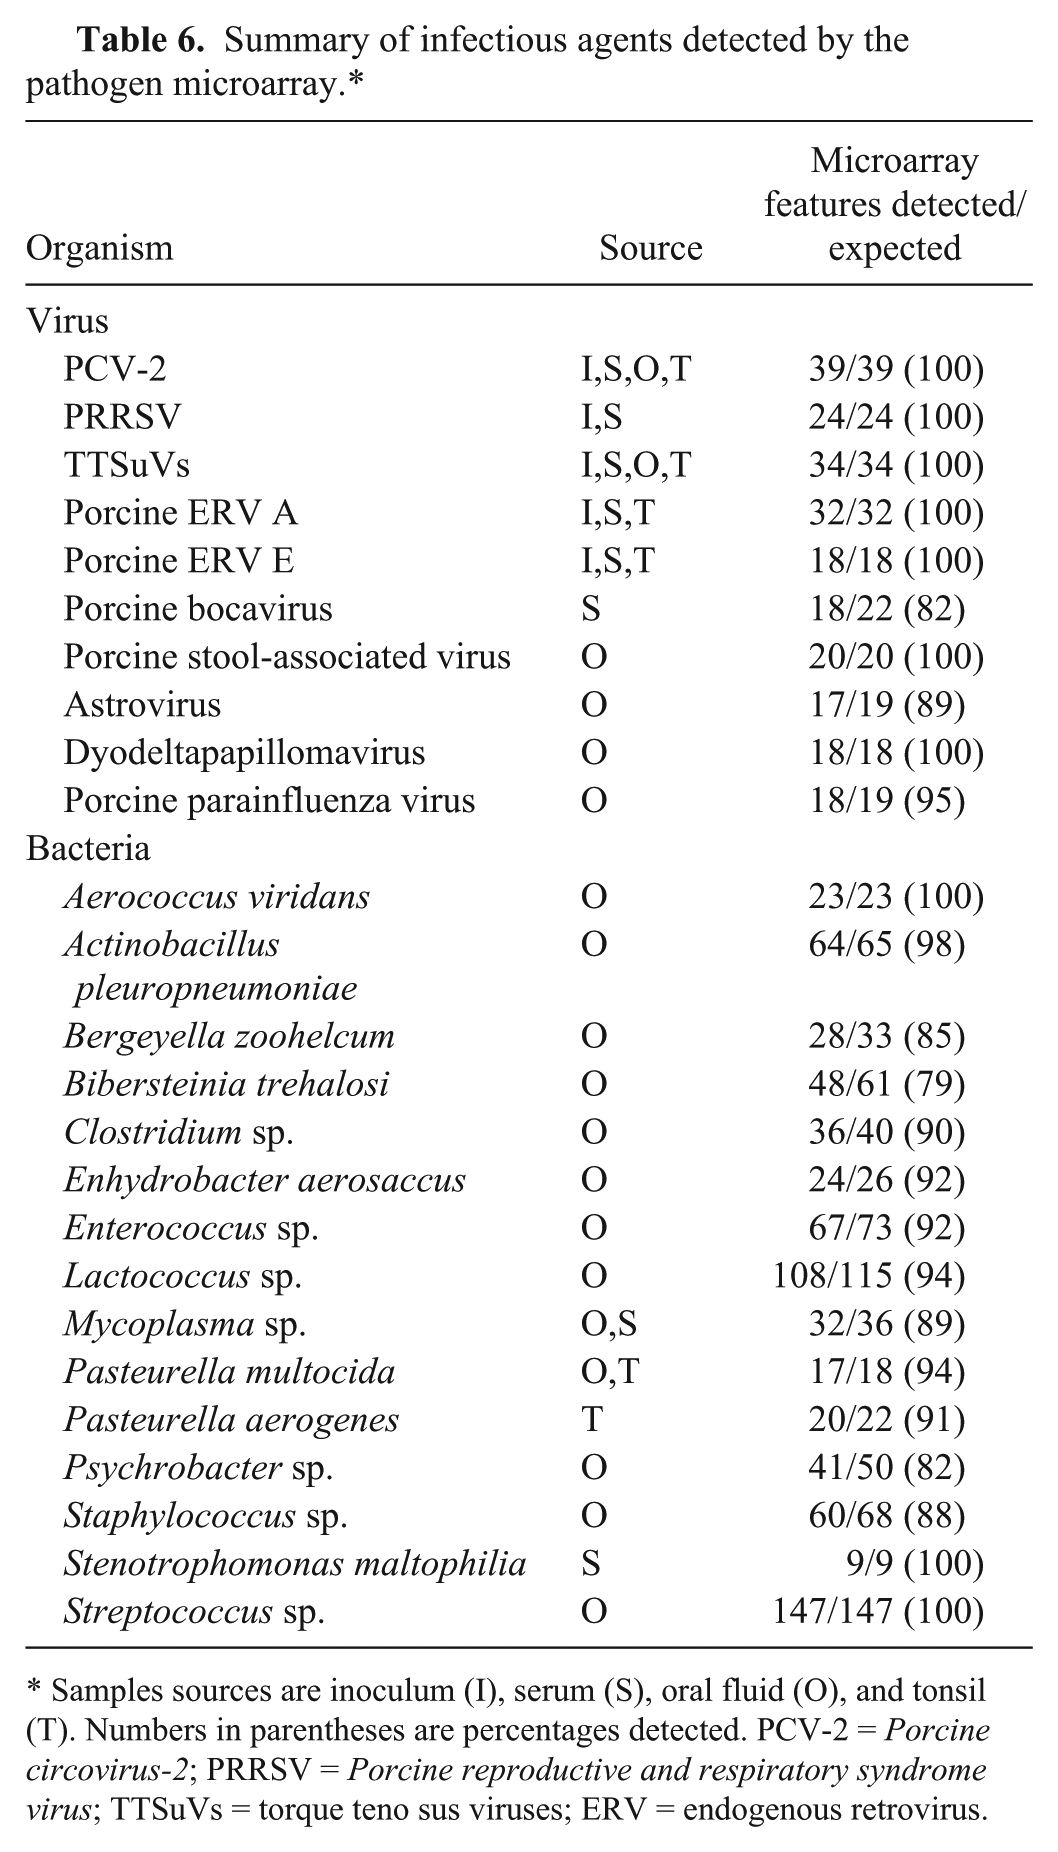
Samples sources are inoculum (I), serum (S), oral fluid (O), and tonsil (T). Numbers in parentheses are percentages detected. PCV-2 = Porcine circovirus-2; PRRSV = Porcine reproductive and respiratory syndrome virus; TTSuVs = torque teno sus viruses; ERV = endogenous retrovirus.
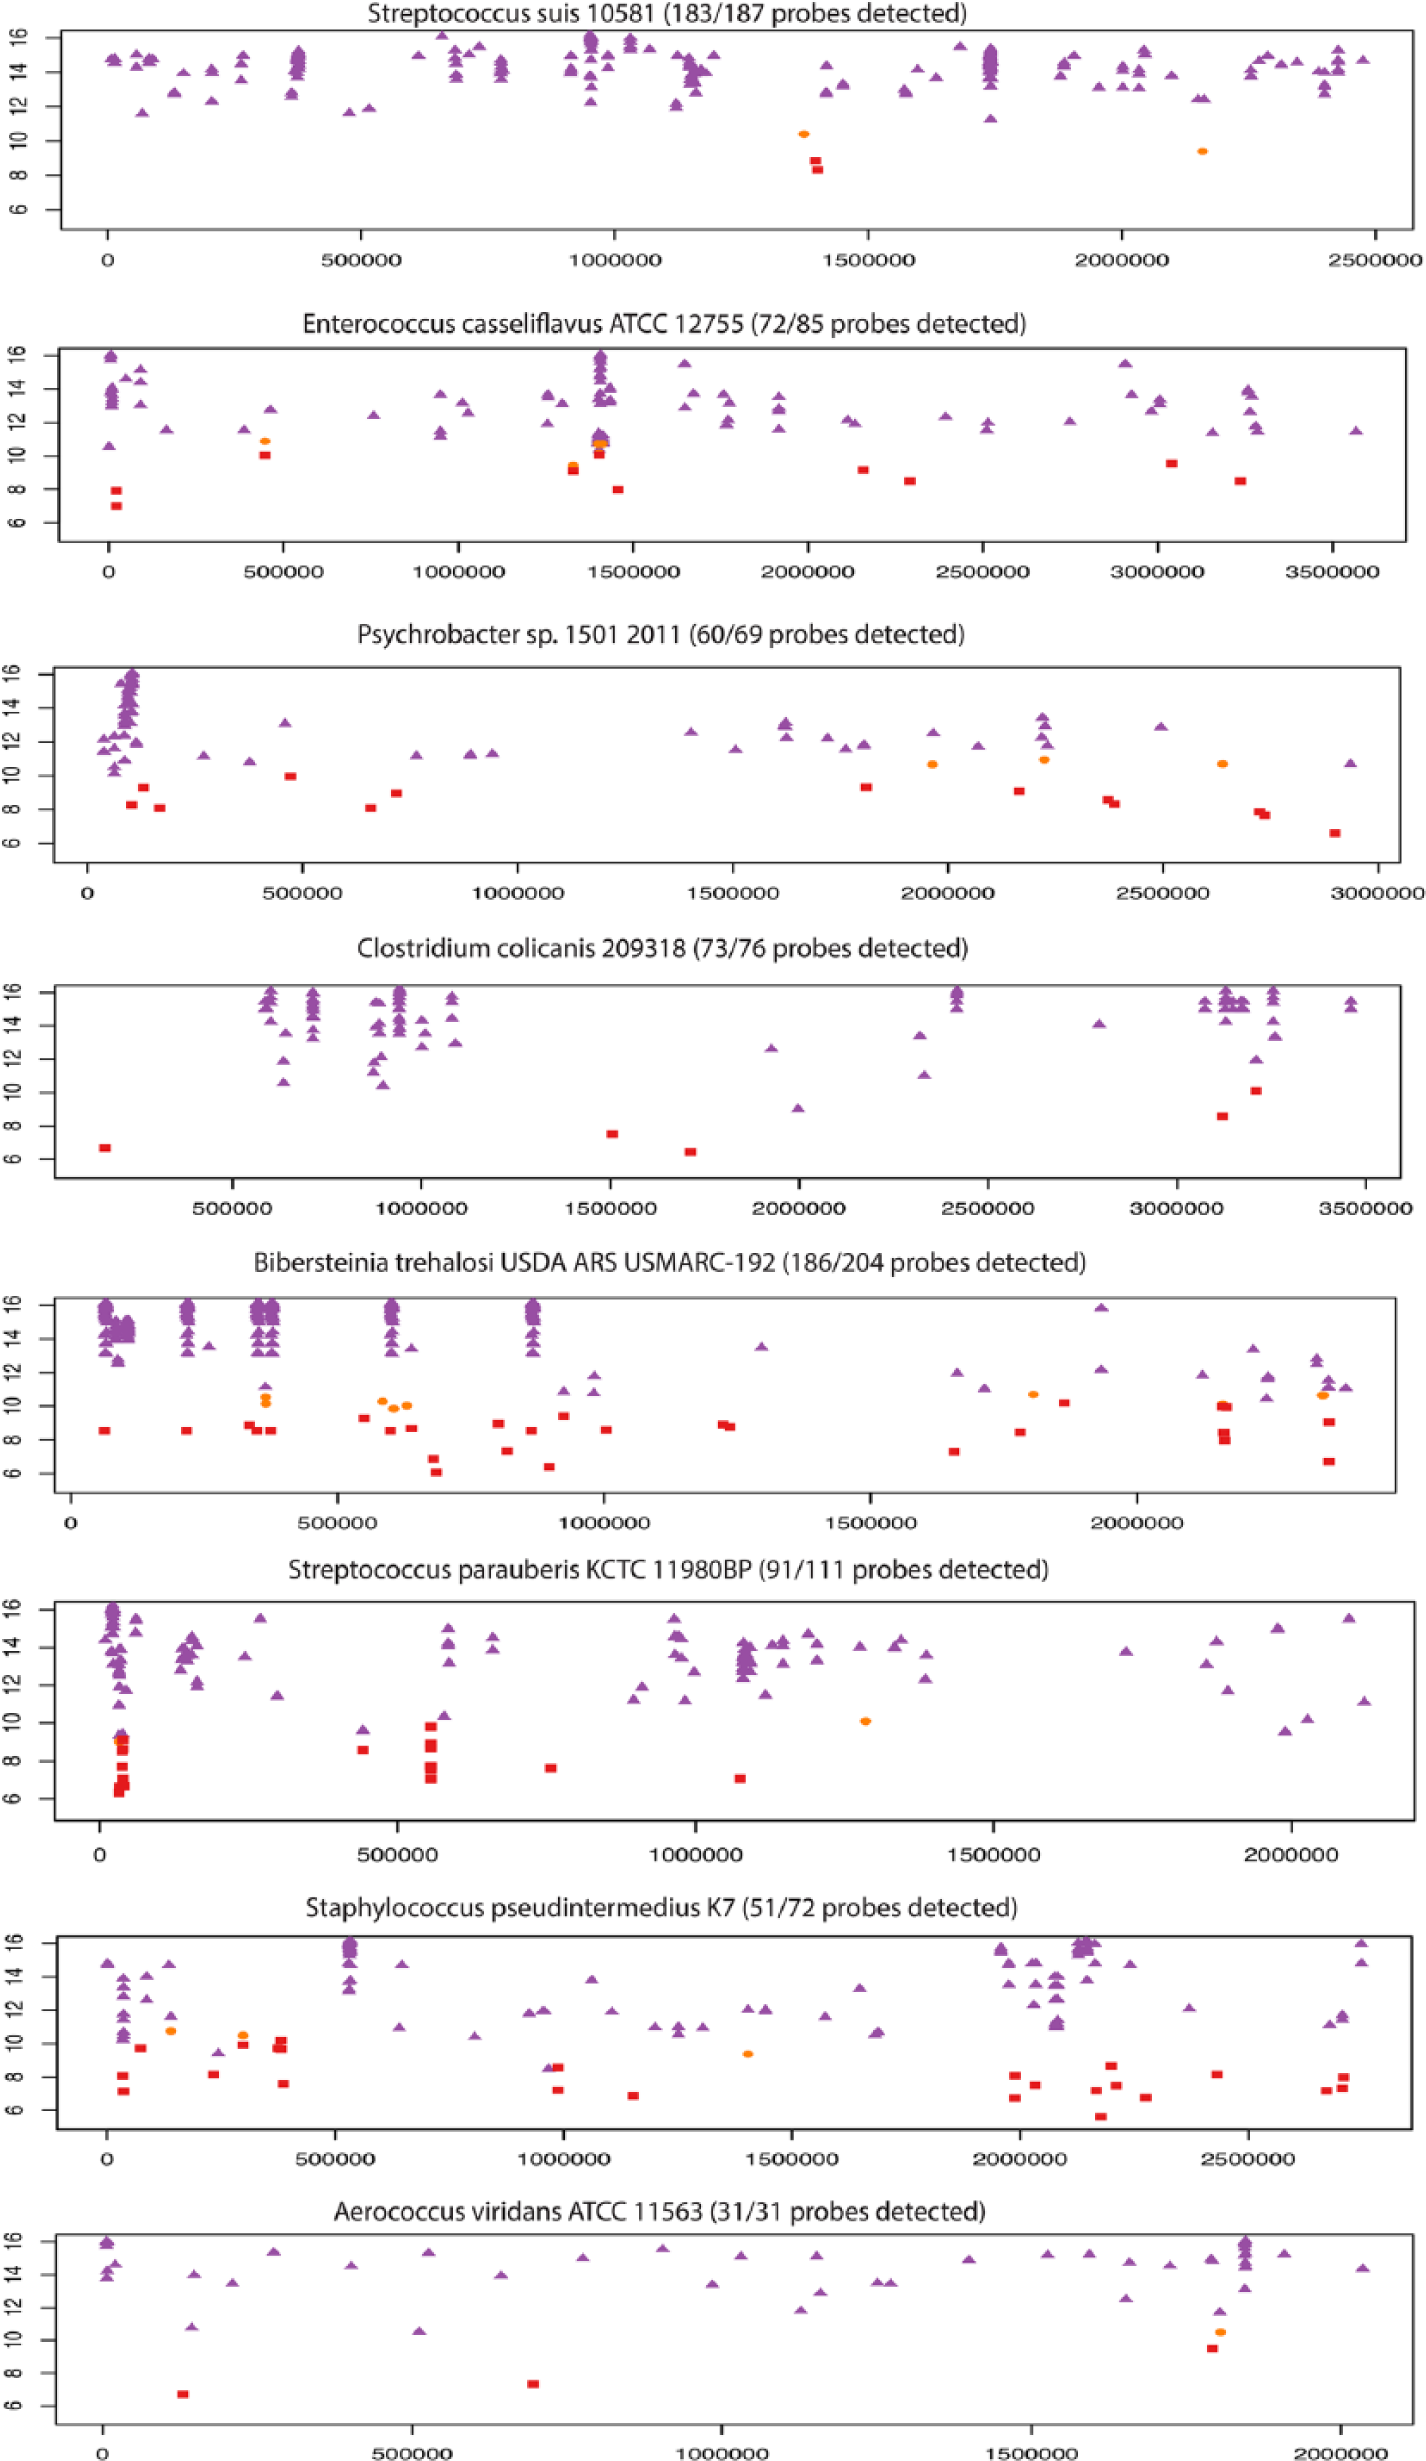
Target sequence-feature alignment plots for the bacteria detected in oral fluid sample 151, showing feature intensity versus feature position in the bacterial genomes. The purple triangles indicate positive features with intensity >99th percentile compared to random control features; the orange ovals indicate features with intensity <99% but >95% of negative random control features; the red rectangles indicate features with intensity <95% of negative random control features.
Discussion
Along with PCR and DNA sequencing, microarrays provide an efficient method for microbial detection and discovery. Microarrays create the opportunity to query hundreds of thousands to several million sequence-specific DNA signatures, all in parallel.8,21,31 A widespread perception is that microarrays are primarily useful for identification of microbial agents isolated in culture. This is perhaps because of the use of microarrays to identify or characterize unknown isolates from complex diagnostic investigations or extraneous agents in culture. This study addresses longstanding questions regarding the utility of microarrays as a tool for analyzing primary diagnostic samples. As the cost of microarrays decrease, the application for use in routine diagnostics and disease surveillance in veterinary livestock is expected to increase, especially in the analysis of syndromes that result from polymicrobial interactions. However, the application of microarray technology in the veterinary diagnostic field creates several challenges, including: 1) attaining sufficient sensitivity to detect all relevant microbes; 2) validating positive results and eliminating false targets; 3) assessing the roles that detected pathogens may or may not play in disease syndromes; and 4) integrating the results into good herd management decisions.
In this study, we tested samples from a study using an experimental infection model for the analysis of PCV-2 and PRRSV in clinical samples. PRRSV and PCV-2 are common pathogens in the commercial swine industry and participate as cofactors in a variety of polymicrobial disease syndromes.3,19 This model system created the opportunity to validate the detection of known agents as well as determine the presence of other infectious agents. The starting point for the microarray analysis of clinical samples was the material used for the experimental infection of pigs. Besides the detection of signatures for PRRSV and PCV-2, the microarray identified signatures of TTSuV, porcine oncoviruses, and a simian retrovirus. TTSuV and PERVs are commonly associated with pigs and were also identified in the clinical samples.20,33 The simian retrovirus was likely from the MARC-145 cell line used for propagation of PRRSV, but was not detected in any of the pig samples. The presence of TTSuV and porcine retroviruses suggests that the source was from the lymph node used to prepare the PCV-2 inoculum. This result emphasizes the importance for thorough analysis of virus preparations for the presence of adventitious agents, especially those preparations used for developing experimental animal models. However, in this case, both TTSuV and porcine retroviruses are already endogenous to pigs. PERVs are not considered significant pathogens of swine. How TTSuV functions as a pathogen remains controversial and under intense study. The strongest connection between TTSuV and disease is as a cofactor in PCV-2–associated syndromes. 6 PCV-2 and TTSuV have been previously identified together in association with PMWS. 34 Interestingly, TTSuV was found in most serum samples, including all 6 PCVAD pigs, and was found in the tonsils of 3 pigs removed at 32 dpi because of morbidity associated with PCVAD.
Serum is a routine diagnostic sample used for the molecular detection of a variety of pathogens. The LLMDA easily identified PCV-2 and PRRSV in sera from experimentally infected pigs (Table 2). Based on comparisons with standard PCR methods, the LLMDA was estimated to be about 2 orders of magnitude less sensitive. The level of sensitivity was consistent regardless of sample source. In samples such as tonsil and oral fluid, the absence of PRRSV detection by the LLMDA was because of insufficient PRRSV RNA. Therefore, the array is likely to deliver a positive result for these and likely other pathogens when clinically relevant quantities of microbe nucleic acid are present. In addition to TTSuV and porcine oncoviruses, a porcine bocavirus signature was identified in a single serum sample (Table 2). Bocaviruses are members of the Parvoviridae family and represent a diverse group. A previous report 11 identified a high frequency of bocavirus sequences in samples from commercial operations. The role of bocaviruses as pathogens remains unknown. Signatures from 3 bacteria were identified in several serum samples (see Table 2). Mycoplasma hyopneumoniae is an endemic pathogen of swine and a cofactor frequently associated with PRRSV and PCV-2 infections. 19 The second bacterium, S. maltophilia, is also associated with pigs. Its role as a pig pathogen is unknown, but is reported as a contaminant of extended pig semen. 1
For disease surveillance at the population level, oral fluid has emerged as an important clinical specimen. The principal advantages include the ease of collection and the capacity to detect infectious diseases in pig populations sooner.9,13,18 Theoretically, a small number of oral fluid samples can detect all of the microbes present in a population. There are likely several components within oral fluid, which can affect nucleic acid amplification, such as naturally occurring inhibitors. Many of these effects are negated by properly processing oral fluid samples, including the use of cotton rope for sample collection. 17 As summarized in Table 3, PCV-2 was easily detected by the LLMDA; however, all samples were negative for PRRSV. The inability to detect PRRSV was easily explained by the small quantity of PRRSV present in oral fluids, despite the fact that samples collected on day 13 were tested, which is near the peak of viremia (Fig. 2).
As expected, signatures were detected for a variety of viruses and bacteria in oral fluid samples. In addition to pig-associated flora, oral fluid will likely contain microbes from environmental sources, such as feed, water, etc. Even though these bacteria may not participate in clinical disease in the pigs, they are potential sources of meat contamination in postharvest processing. Besides TTSuV, several viral signatures were detected that represent feces-associated porcine viruses, including stool-associated circular virus 2 (PoSCV-2) and a porcine astrovirus. Stool-associated viruses were first described by the metagenomic analysis of fecal samples. 5 The role of PoSCV-2 as a significant pathogen of swine remains unknown. Porcine astroviruses represent a diverse group, first characterized in the 1980s. Because the most frequent source for isolation is fecal material, astroviruses have been linked to a variety of intestinal diseases. 16 The presence of feces-associated microbes in the oral fluid samples is likely the result of the pig’s oral contamination by fecal material in the environment. Other viruses detected in oral fluid samples were Dyodeltapapillomavirus 1 or Sus scrofa papillomavirus, and PPIV. Dyodeltapapillomavirus was first identified in a skin sample from a normal pig and is not considered a significant pathogen of swine. 24 PPIV is linked to respiratory diseases in swine. 14 Though uncommon, the presence of PPIV along with PRRSV and other respiratory pathogens can contribute to more severe disease. Overall, although the viruses identified in oral fluid may have only a limited impact on swine health, they can function as disease cofactors in pigs that are immunosuppressed as a result of PRRSV or PCV-2.
As summarized in Table 6, several bacteria were identified in the oral fluid samples. Some are linked with PRRSV infection, and function as cofactors to cause more severe disease. 3 Examples including M. hyopneumoniae (identified in serum), P. multocida, A. pleuropneumoniae, and S. suis are cofactors linked to porcine respiratory disease complex. Signatures for P. multocida and A. pleuropneumoniae were also present in tonsil. Molecular signatures for S. suis were found in all oral fluid samples. PRRSV has been shown to increase susceptibility of pigs to diseases caused by S. suis. Nursery pigs inoculated with PRRSV followed by S. suis develop moderate to severe respiratory disease, mild to severe lameness with associated joint effusion, and have increased mortality.7,26 The remaining bacteria are considered normal flora or opportunistic; present on surfaces in the upper respiratory tract, oral cavity, epidermis, or present in feces. 19
The last sample evaluated in this study was tonsil, a tissue that is sampled by scraping, swabbing, or removal at the time of postmortem examination. Similar to the results obtained for serum and oral fluid, PCV-2 was easily detected. The inability to detect PRRSV was the result of low amounts of virus at the time of euthanasia (see Fig. 2). TTSuV and porcine oncovirus signatures were also detected.
This study demonstrates the utility in the use of LLMDA in routine clinical diagnostics and surveillance. The study also demonstrates the unique properties of each clinical sample. Even though serum is widely used in molecular diagnostics, oral fluid may emerge as the sample of choice for conducting routine swine herd surveillance. However, our results indicate that the sole use of oral fluid samples should be done with caution, as the important swine pathogen PRRS is present at levels too low to be detected by either PCR or microarray even near the times of highest viremia during the course of infection.
Footnotes
a.
Ambion MagMax 96 viral isolation kit, Applied Biosystems, Foster City, CA.
b.
QIAamp DNA mini kit, Qiagen GmbH, Hilden, Germany.
c.
EZ-PRRSV MPX 4.0 real time RT-PCR target-specific reagents, Tetracore Inc., Rockville, MD.
d.
Tetracore quantification standards and control sets, Tetracore Inc., Rockville, MD.
e.
CFX96 Touch real-time PCR detection system, Bio-Rad Laboratories, Hercules, CA.
f.
SsoAdvanced universal SYBR Green supermix kit, Bio-Rad Laboratories, Hercules, CA.
g.
PureYield plasmid miniprep system, Promega Corp., Madison, WI.
h.
NanoDrop 8000 spectrophotometer, Thermo Fisher Scientific Inc., Waltham, MA.
i.
Life Technologies, Grand Island, NY.
j.
Qubit fluorometer, Life Technologies, Grand Island, NY.
k.
Phusion high-fidelity DNA polymerase, New England Biolabs, Ipswich, MA.
l.
Tetrad thermocycler, MJ Research Inc., Waltham, MA.
m.
QIAquick PCR purification kit, Qiagen GmbH, Hilden, Germany.
n.
REPLI-g midi kit, Qiagen GmbH, Hilden, Germany.
o.
One-color labeling kit, Roche NimbleGen, Madison, WI.
p.
CGH hybridization, Agilent Technologies Inc., Santa Clara, CA.
q.
Custom DNA microarray, Agilent Technologies Inc., Santa Clara, CA.
r.
Microarray rotator oven, Agilent Technologies Inc., Santa Clara, CA.
s.
CGH wash buffers, Agilent Technologies Inc., Santa Clara, CA.
t.
MS200 microarray scanner, Roche NimbleGen, Madison, WI.
Declaration of conflicting interests
The author(s) declared no potential conflicts of interest with respect to the research, authorship, and/or publication of this article.
Funding
The author(s) disclosed receipt of the following financial support for the research, authorship, and/or publication of this article: This research was partially supported by the Lawrence Livermore Laboratory Derived Research and Development effort (14ERD081). This study was performed under the auspices of the United States Department of Energy by Lawrence Livermore National Laboratory under Contract DE-AC52-07NA27344. This research was partially supported by the State of Kansas National Bio and Agro-Defense Facility Fund and USDA NIFA Award 2013-68004-20362, Genetically Improving Resistance of Pigs to PRRS Virus Infections.
References
Supplementary Material
Please find the following supplemental material available below.
For Open Access articles published under a Creative Commons License, all supplemental material carries the same license as the article it is associated with.
For non-Open Access articles published, all supplemental material carries a non-exclusive license, and permission requests for re-use of supplemental material or any part of supplemental material shall be sent directly to the copyright owner as specified in the copyright notice associated with the article.