
Abstract
The automated laser-based hematology analyzer Sysmex XT-2000iV™ provides a 5-part differential count and specific cytograms that are of great interest for large veterinary laboratories. The aim of the study was to validate the Sysmex XT-2000iV compared to the laser-based hematology analyzer ADVIA® 2120 and manual differential in dogs, cats, and horses as well as the impact of anticoagulant (heparin, ethylenediamine tetra-acetic acid [EDTA], and citrate) and storage at 22°C and 4°C. Consecutive fresh K3–EDTA blood samples from 216 cats, 314 dogs, and 174 horses were included. The impact of anticoagulant and sample storage was assessed in specimens obtained from an additional 9 cats, 10 dogs, and 10 horses. Agreement between both analyzers was excellent to good except for monocytes and canine reticulocytes. Spearman rank correlation coefficients (rs) between Sysmex XT-2000iV and manual differential were good to fair and ranged from 0.91 (cat lymphocytes) to 0.44 (cat monocytes). Hematocrit value (Hct), mean corpuscular hemoglobin (MCH), MCH concentration (MCHC; all: P < 0.001), and mean corpuscular volume (MCV; P < 0.01) were higher in canine citrated blood compared to heparin and EDTA. In cats, lymphocytes and monocytes were lower in heparinized blood compared to EDTA (P < 0.05), whereas in horses no significant effect was seen. Regarding storage time and temperature, white and red blood cell counts, hemoglobin, and MCH were stable. Hct, MCV, and MCHC were influenced by erythrocyte swelling. Differential count remained stable for 24 hr (22°C) and nearly 72 hr (4°C) except for monocytes. The overall performance of the Sysmex XT-2000iV was excellent and compared favorably with that of the ADVIA 2120. A special strength was the excellent detection of feline eosinophils.
Introduction
Large-volume, laser-based hematology analyzers with veterinary species-specific software are commonly used in veterinary laboratories, industrial companies, and larger veterinary clinics. Their great advantage is the performance of an automated 5-part differential count whereby results are displayed in analyzer-specific scattergrams, which could be used as screening tools to detect abnormalities of the differential count.
The most commonly used hematology analyzers in veterinary laboratories include the ADVIA® 120 and 2120 a and the Cell-Dyn® 3500. b The laser-based multispecies ADVIA 120 hematology system has been extensively validated for its use in veterinary laboratories for several species, including dog,6,13,14,16 cat,13,14 horse,4,13 cattle, 13 pig, 13 goat, 13 and sheep. 13 The cytograms provided by the ADVIA 120 were considered to be a good screening tool in the automated analysis of canine body cavity fluids 2 and bone marrow. 1 The Sysmex XT-2000iV™ (hereafter, Sysmex analyzer), c a modification of the human XT-2000i system equipped with veterinary software, compared favorably to the Cell-Dyn 350010,11,26 and has been considered suitable for the measurement of canine body cavity fluids. 18 However, a comparison with the ADVIA 2120 has not been made. The impact of sample storage on the results and the morphology of cytograms are of great importance, especially for commercial laboratories that are commonly dealing with preanalytic errors such as the use of an incorrect anticoagulant or sample aging.
Thus, it was the aim of the current study to evaluate the performance of the Sysmex analyzer compared to the ADVIA 2120 (hereafter, ADVIA analyzer) and the respective manual methods for the leukocyte differential count in canine, feline, and equine specimens as well as the reticulocyte count (cat and dog). Equine reticulocytes were not evaluated in the present study as reticulocytes are not released from the bone marrow in healthy horses and only rarely in horses with regenerative anemia, so they are of no diagnostic significance in this species. 22 Moreover, the effect of anticoagulant (ethylenediamine tetra-acetic acid [EDTA], heparin, and citrate) was evaluated for the Sysmex analyzer.
Materials and methods
Study design
The prospective study was performed between July 2006 and September 2007 and was approved by the Ethics Committee for Animal Welfare, Giessen, Germany. For the method comparison study, consecutive fresh (< 6 hr old) EDTA blood specimens from all healthy and diseased dogs, cats, and horses submitted to the Central Laboratory, Department of Veterinary Clinical Sciences, Justus-Liebig-University (Giessen, Germany) were enrolled if there was a sufficient sample volume to be analyzed with both analyzers.
If error messages were generated by either the ADVIA or Sysmex analyzer, a classification into “technical flags” and “morphological flags” was performed. Technical flags included all flags caused by a technical problem of the instruments or if the error message suggested to repeat the sample. Morphological flags were defined as all flags caused by abnormalities of the blood. If a technical flag was generated, the sample was reanalyzed and the results were rejected if the technical flag appeared again in the second measurement. Measurements with morphological flags were accepted. Flagging options of both analyzers, however, were not evaluated in the current study. Instruments were operated by the technicians of the Central Laboratory and 2 of the authors (JN, CD).
ADVIA 2120
The ADVIA analyzer was operated with the veterinary software version 5.3.1-MS. The instrument is a laser-based system, using laser light scatter at a wavelength of 670 nm, cytochemical peroxidase staining, differential white blood cell lysis, and oxazine 750 staining to provide complete blood cell counts. The analysis of nucleated cells is performed with 2 methods in separate channels (peroxidase and baso/lobularity channel) serving as internal control. In the peroxidase channel, differentiation of leukocytes is based on peroxidase staining intensity and light scatter properties of the cells. In the baso/lobularity channel, cells are lysed, and 2 light scatter measurements are performed for analysis of cellularity and nuclear lobularity. Cells are differentiated based on their volume and nuclear lobularity in mononuclear and polymorphonuclear cells. Cells resistant to lysis including human basophils and blasts are shown in the baso region of the baso cytogram. The reticulocyte channel is used to quantify feline eosinophils after staining with oxazine 750 due to the eosinophils’ absent peroxidase staining activity. 23 Internal quality control materials in 3 different concentrations (low, normal, and high) provided by the manufacturer d were measured each day.
Sysmex XT-2000iV
The veterinary software version 00-08 was installed on the Sysmex analyzer, and specimens were measured in the open-tube mode of the analyzer (i.e., the manual mode in which the required sample volume was aspirated by the analyzer out of uncapped tubes), which was also the method routinely performed with the ADVIA analyzer.
Similar to the ADVIA analyzer, the leukocyte count and differentiation is performed in 2 channels, the WBC-DIFF and WBC-BASO channels. In the WBC-DIFF channel, leukocytes are first permeabilized using a surfactant e and then stained with a fluorescent polymethine dye, f which binds to cytoplasmatic organelles and nucleic acids (DNA and RNA). 12 A 5-part differential count including neutrophils, lymphocytes, monocytes, eosinophils, and basophils is obtained by fluorescence flow cytometry using a red semiconductor laser at a wavelength of 633 nm. Separation of cellular populations is based on side fluorescence (SFL) and laser side scatter light (SSC). Cells with a high RNA content, such as monocytes and lymphoid cells, are located high on the y-axis (SFL), while cells with a high complexity, such as eosinophils, are displayed toward the right hand side of the cytogram, reflecting a higher SSC. The different cellular populations are identified by an adaptive cluster analysis system. In human beings, basophils are detected by their lysis resistance in the WBC-BASO channel.
In the WBC-BASO channel, cells (except human basophils) are lysed by a strong surfactant, and SSC and forward scatter (FSC) of lysed cells are determined. The WBC-BASO channel is also the default method for measurement of the total white blood cell count (WBC). A second result for total WBC is obtained from the WBC-DIFF channel serving as internal control.
Three levels of quality control material g were run each day prior to the measurements of patient samples. Technical flags of the Sysmex analyzer (error message “func” or error message suggesting to repeat the sample) are generated in case of a technical problem of the analyzer. Morphological flags are divided in the following subcategories: “Diff ” (abnormalities in the WBC differential parameters), “Morph” (abnormal cell morphology; i.e., abnormal distribution of platelet count [PLT] and red blood cell count [RBC] or abnormal WBC scattergram, anisocytosis of erythrocytes, etc.), and “Count” (abnormality in blood cell numerical count).
Method comparison for the differential and reticulocyte counts
Results of the Sysmex analyzer were compared with the measurement obtained with the ADVIA analyzer. For all samples, an automated differential count and an automated reticulocyte count was conducted. A manual 200-cell differential cell count and a 1,000-cell manual reticulocyte count (only cats and dogs) were determined in addition and served as reference method for the respective variables. For manual reticulocyte count, 50 µl of EDTA anticoagulated whole blood was pipetted in a tube containing the same amount of brilliant cresyl blue h and incubated for 20–30 min. Then, a wedge smear was prepared and was used for microscopic reticulocyte count after air drying. In cats, only aggregated reticulocytes containing > 15 dots of ribosomal RNA were counted, as recommended previously. 24
Validation process
All scattergrams from both the Sysmex and ADVIA analyzers were validated by 2 of the authors (JN, CD) to identify samples in which the accuracy of the manual leukocyte differential was questionable. For the Sysmex analyzer, samples in which the automated differential has to be confirmed by a manual differential count include scattergrams with indistinct separation of the different leukocyte cell populations or when there are discrepancies between the numerical data and visual data in the dot plot. For the ADVIA analyzer, abnormalities that have to be confirmed with a manual differential count include scattergrams of the PEROX channel with indistinct gating borders, moderate amounts of large unstained cells (LUCs) suggestive of activated lymphocytes or lymphoblasts, a discrepancy between the number of neutrophils displayed in the peroxidase channel, and the number of polymorphonuclear cells in the BASO channel indicative of left shift, as well as the presence of lysis resistant cells in the BASO cytogram indicative of blasts. If abnormal scattergrams were detected from either analyzer, these samples were excluded from the statistical analysis of the results of the automated differential count.
Effect of anticoagulant
To evaluate the effect of anticoagulant, approximately 3 ml of blood was taken from 9 healthy cats as well as from 10 healthy dogs and 10 horses. The healthy cats and dogs were blood donors, whereas equine samples were obtained from healthy blood donors and horses with colic in which an additional tube was filled if blood samples for a routine hematological and clinical examination were taken. After insertion of a 22-gauge needle, blood was allowed to flow directly into 1.3-ml tubes containing the anticoagulants K3–EDTA, lithium–heparin, and sodium citrate. Contamination of the needle with anticoagulant was avoided. The filling order of the tubes and order of measurements was first heparin, then EDTA, and finally citrate. The latter were filled such that a ratio of 1:9 citrate-to-blood was obtained. All measurements were performed within 1 hr after sampling to avoid an effect of sample aging.
Effect of storage and storage temperature
For assessment of the impact of storage time and temperature, 16–20 ml of blood was taken from 9 healthy cats as well as 10 healthy dogs and 10 horses into EDTA anticoagulated tubes. Directly after sample acquisition, the blood was stored in equal parts at either 22°C or 4°C. Measurements including complete blood cell, differential, and reticulocyte counts were performed at time points 0, 3, 6, 12, 24, 36, 48, 60, and 72 hr.
Statistical analysis
Statistical analysis was performed with the Graph Pad Prism, i Analyse-it for Excel, j and BMDP. k A Shapiro–Wilk test was applied to verify the assumption of normality, which was shown for most variables. Comparison of the results obtained with both hematology analyzers as well as between the automated analysis and the manual methods (manual differential and reticulocyte count) was performed with a Spearman rank correlation and Passing–Bablok regression analysis. Bland–Altman diagrams showing the mean bias ±1.96 standard deviation were prepared in addition. The bias was defined as the difference between mean measurements obtained with the Sysmex analyzer and the mean results reported with the ADVIA analyzer serving as reference method. Correlations were ranked as “excellent” for Spearman rho (rs) = 0.93–0.99, “good” for rs = 0.80–0.92, “fair” for rs = 0.59–0.79, and “poor” for rs< 0.59. In case of technical flags despite repeated analysis, measurements of the flagged variables were excluded. The effect of anticoagulant on the results was assessed with a one-way analysis of variance with repeated measures. In case of significance, a Bonferroni post hoc t-test was done.
A two-way analysis of variance with repeated measures was used to evaluate the effect of sample storage regarding the factors “time” and “temperature” and to test the interaction between time and temperature (i.e., the different behavior of the curve during the course of time). In 2 cats, results for PLT were not reported by the analyzer at time point 72 hr (22°C) due to the repeated error message “analysis error or abnormal sample.” In 1 of the 2 cats, reticulocyte count was missing for the same reason. Due to missing values, a Wald test was used for statistical analysis. Due to non-normal distribution, a logarithmic transformation was performed for lymphocytes, monocytes, and eosinophils. Level of significance was set as α = 0.05 for all tests.
Results
Method comparison
Consecutive fresh K3–EDTA blood samples from 216 cats, 314 dogs, and 174 horses were included. The validation process of the automated differential count with visual inspection of the scattergrams resulted in the exclusion of 1 equine sample, 11–14 feline specimens, and up to 79 canine samples. Regarding the reticulocyte count, 6 feline specimens and 38 canine samples were excluded as no smear for manual reticulocyte stain was performed. Agreement between the Sysmex and ADVIA analyzers as well as between the automated hematology analyzers and the manual leukocyte and reticulocyte counts (all after the validation process) are demonstrated in Tables 1–3.
Agreement between the ADVIA 2120 and Sysmex XT-2000iV hematology analyzers for leukocyte differential and reticulocyte count for feline, canine, and equine samples.*
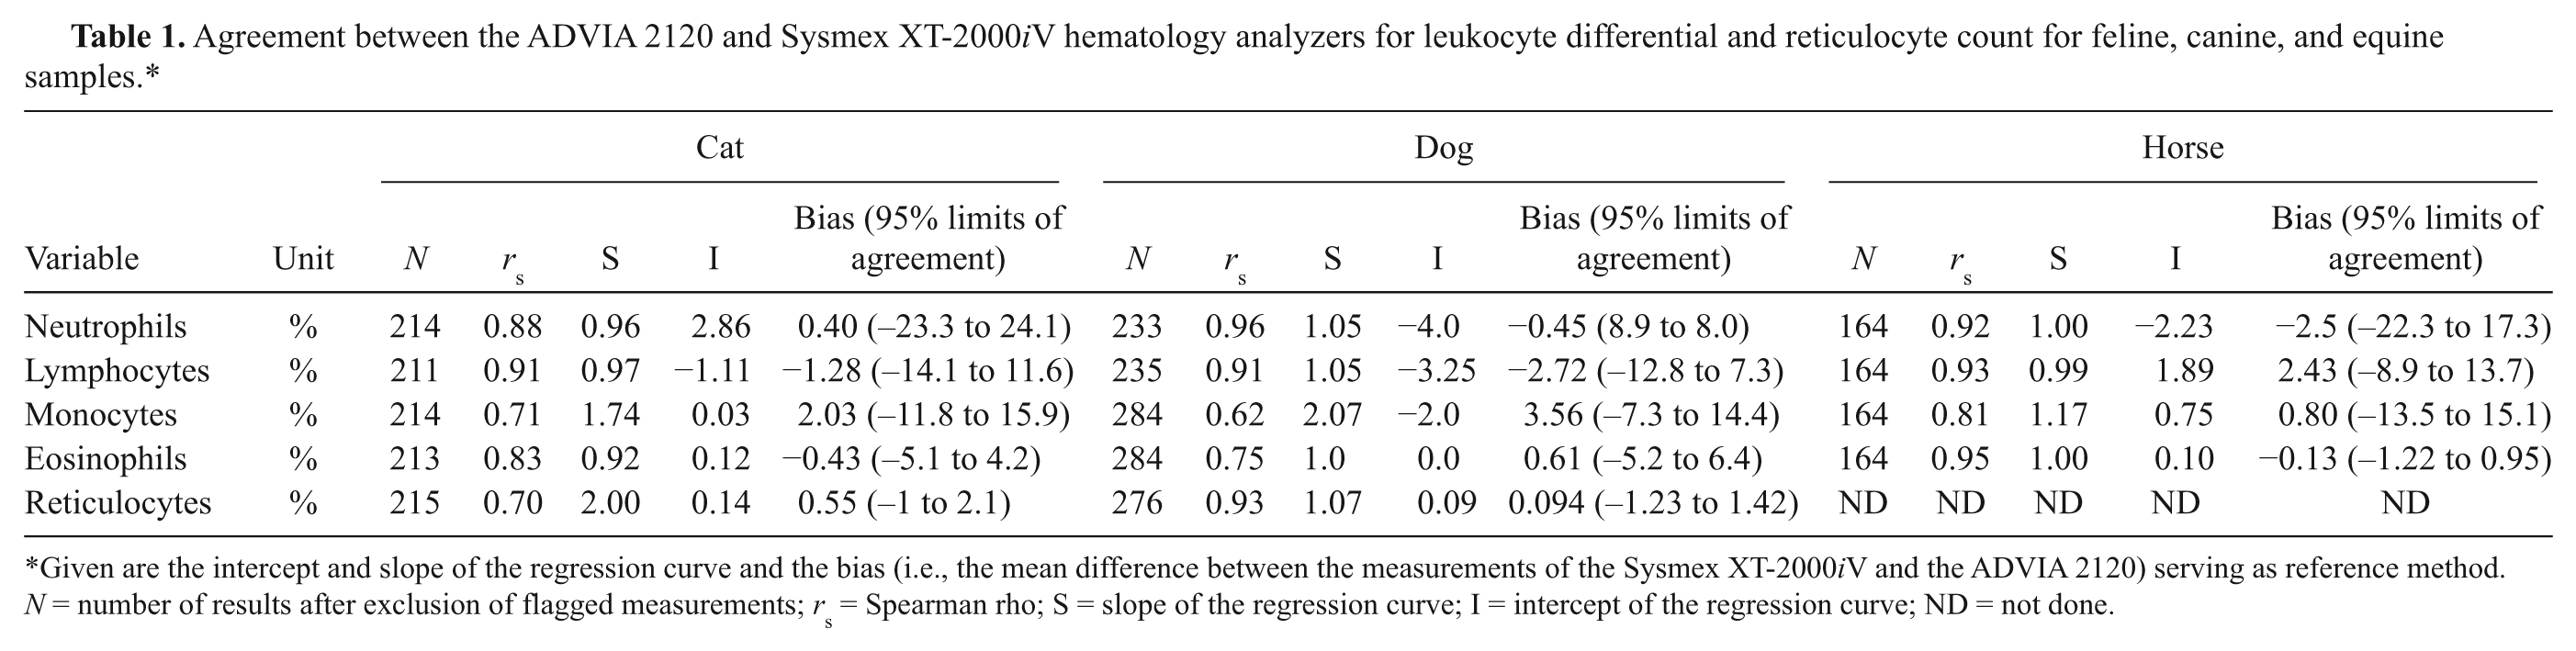
Given are the intercept and slope of the regression curve and the bias (i.e., the mean difference between the measurements of the Sysmex XT-2000iV and the ADVIA 2120) serving as reference method. N = number of results after exclusion of flagged measurements; rs = Spearman rho; S = slope of the regression curve; I = intercept of the regression curve; ND = not done.
Agreement between the manual differential and reticulocyte count and the results obtained with the ADVIA 2120 for feline, canine, and equine samples.*
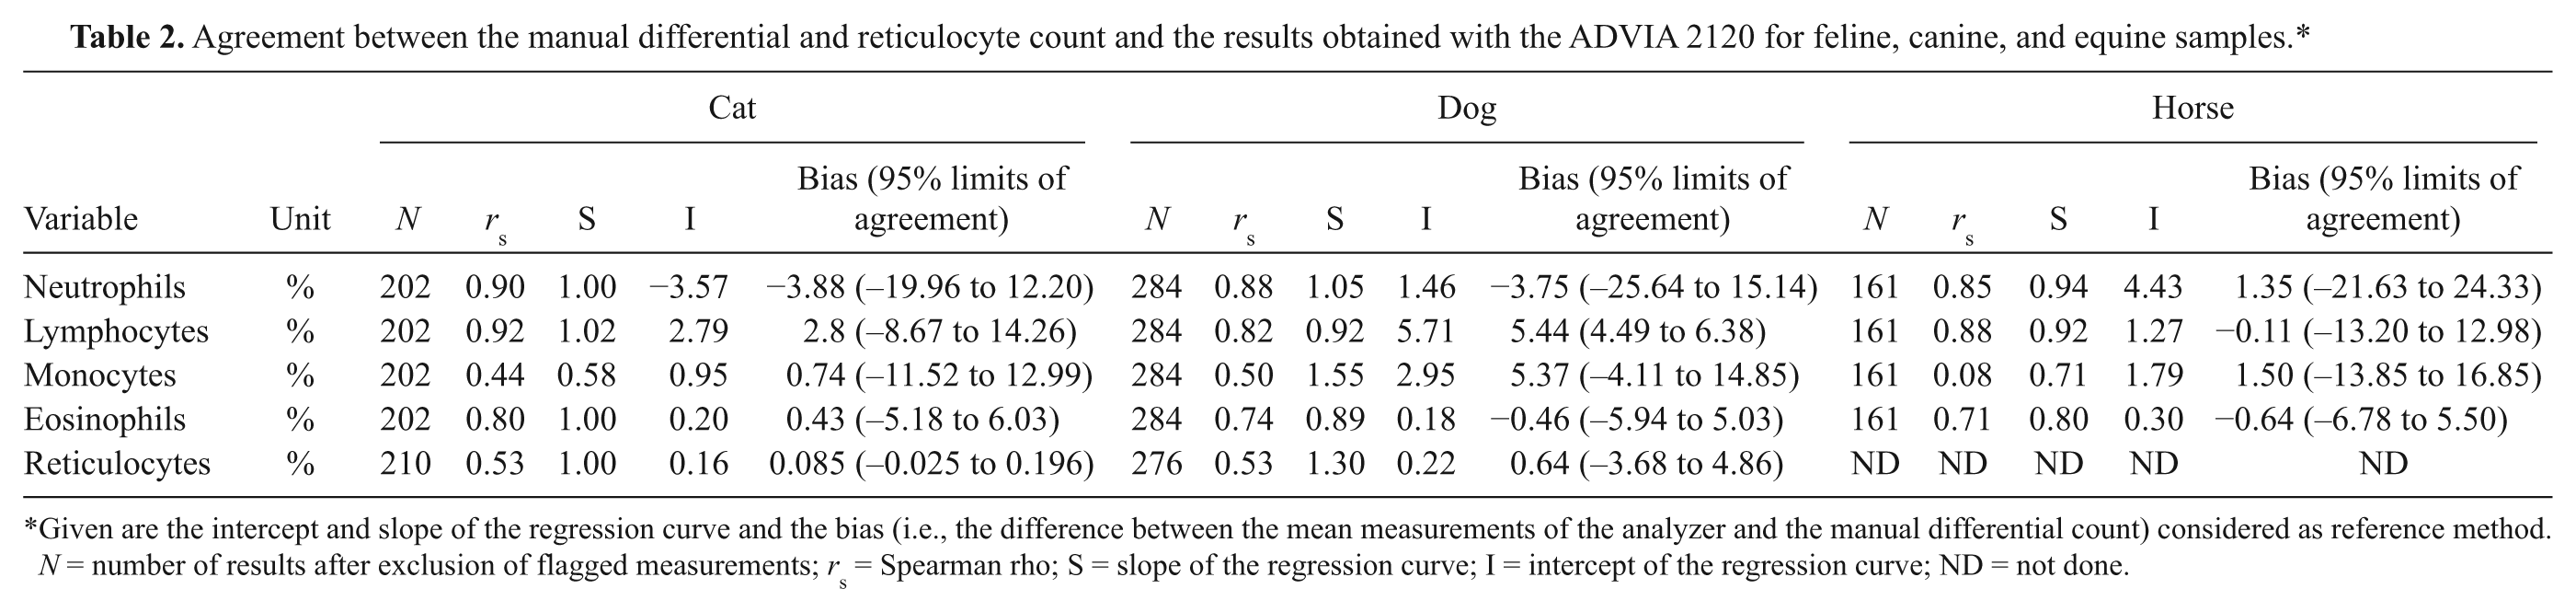
Given are the intercept and slope of the regression curve and the bias (i.e., the difference between the mean measurements of the analyzer and the manual differential count) considered as reference method. N = number of results after exclusion of flagged measurements; rs = Spearman rho; S = slope of the regression curve; I = intercept of the regression curve; ND = not done.
Agreement between the manual differential and reticulocyte count and the results obtained with the Sysmex XT-2000iV Diff for feline, canine, and equine samples.*
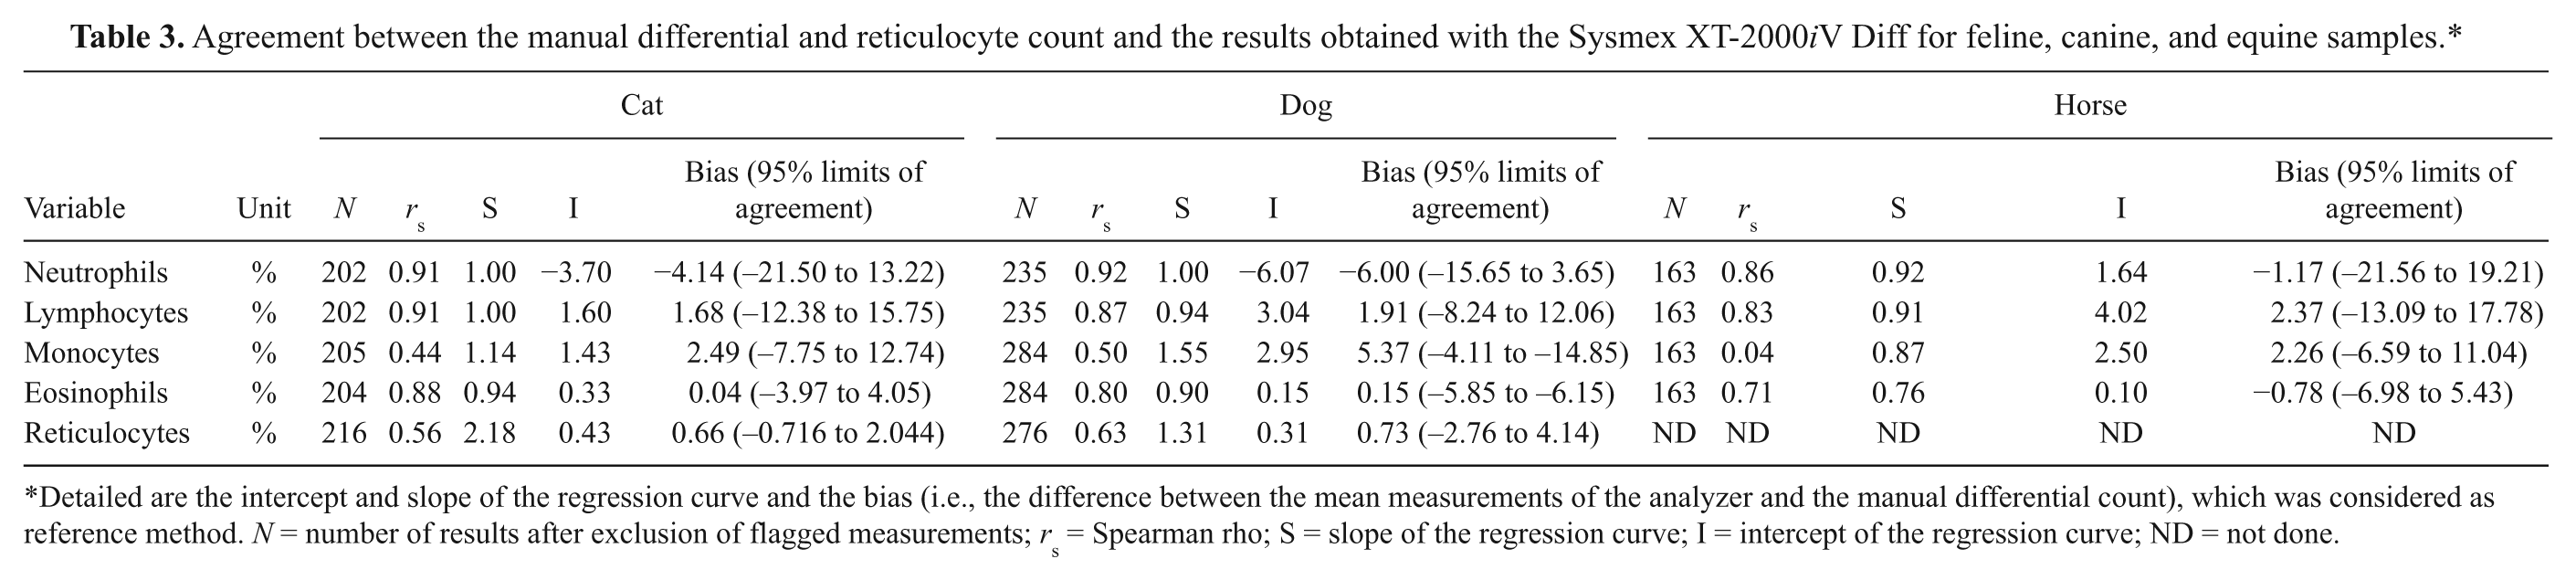
Detailed are the intercept and slope of the regression curve and the bias (i.e., the difference between the mean measurements of the analyzer and the manual differential count), which was considered as reference method. N = number of results after exclusion of flagged measurements; rs = Spearman rho; S = slope of the regression curve; I = intercept of the regression curve; ND = not done.
The comparison between leukocyte differential and reticulocyte count obtained from the ADVIA and Sysmex analyzers revealed an excellent agreement for canine neutrophil count and a good agreement for feline and equine neutrophils (Table 1). There was an excellent correlation between the analyzers for equine lymphocytes and a good agreement for feline and canine lymphocyte counts. A good agreement between the analyzers was seen for canine and equine monocytes, whereas a fair correlation was observed for feline blood samples. The best agreement between the ADVIA and Sysmex analyzers was present for equine eosinophils, while a fair correlation was present for dogs and cats. Automated reticulocyte count agreed excellently between the analyzers for dogs, whereas a fair correlation was seen in cat specimens. The intercepts of the regression curves were close to 1 except for feline and canine monocytes. Mean biases were below 4% for all species; however, the 95% limits of agreement were generally broad except for equine eosinophils.
Regarding the agreement between the ADVIA analyzer and the manual differential (Table 2) and reticulocyte count, a good correlation was present for neutrophils and lymphocytes for all evaluated species (Table 2). There was a poor agreement for monocytes in cats, dogs, and horses. Correlation was good for canine eosinophils and fair for cats and horses. A poor correlation was observed for canine and feline reticulocytes. For all evaluated variables, the intercept of the regression curves was close to 1 except for monocytes. Mean biases ranged from −0.11% to 5.44%; however, 95% limits of agreement were generally broad except for canine lymphocytes and feline reticulocytes.
As for the ADVIA analyzer, a good agreement between manual counts and the automated analysis was observed for feline, canine, and equine neutrophils and lymphocytes and a poor correlation for monocytes when assayed with the Sysmex analyzer (Table 3). Manual and automated eosinophil counts in cats and dogs correlated well, whereas in horses a fair agreement was present. Comparable to the ADVIA analyzer, manual and automated reticulocytes agreed poorly in dogs and cats.
The slope of the regression curve was generally close to 1.00 except for canine monocytes and canine and feline reticulocytes. Mean biases ranged from 0.04% to −6.00% with broad 95% limits of agreement except for feline reticulocytes. There was a proportional error for feline reticulocytes. Examples for hemograms in which a reliable automated count was not possible are shown in Figure 1.
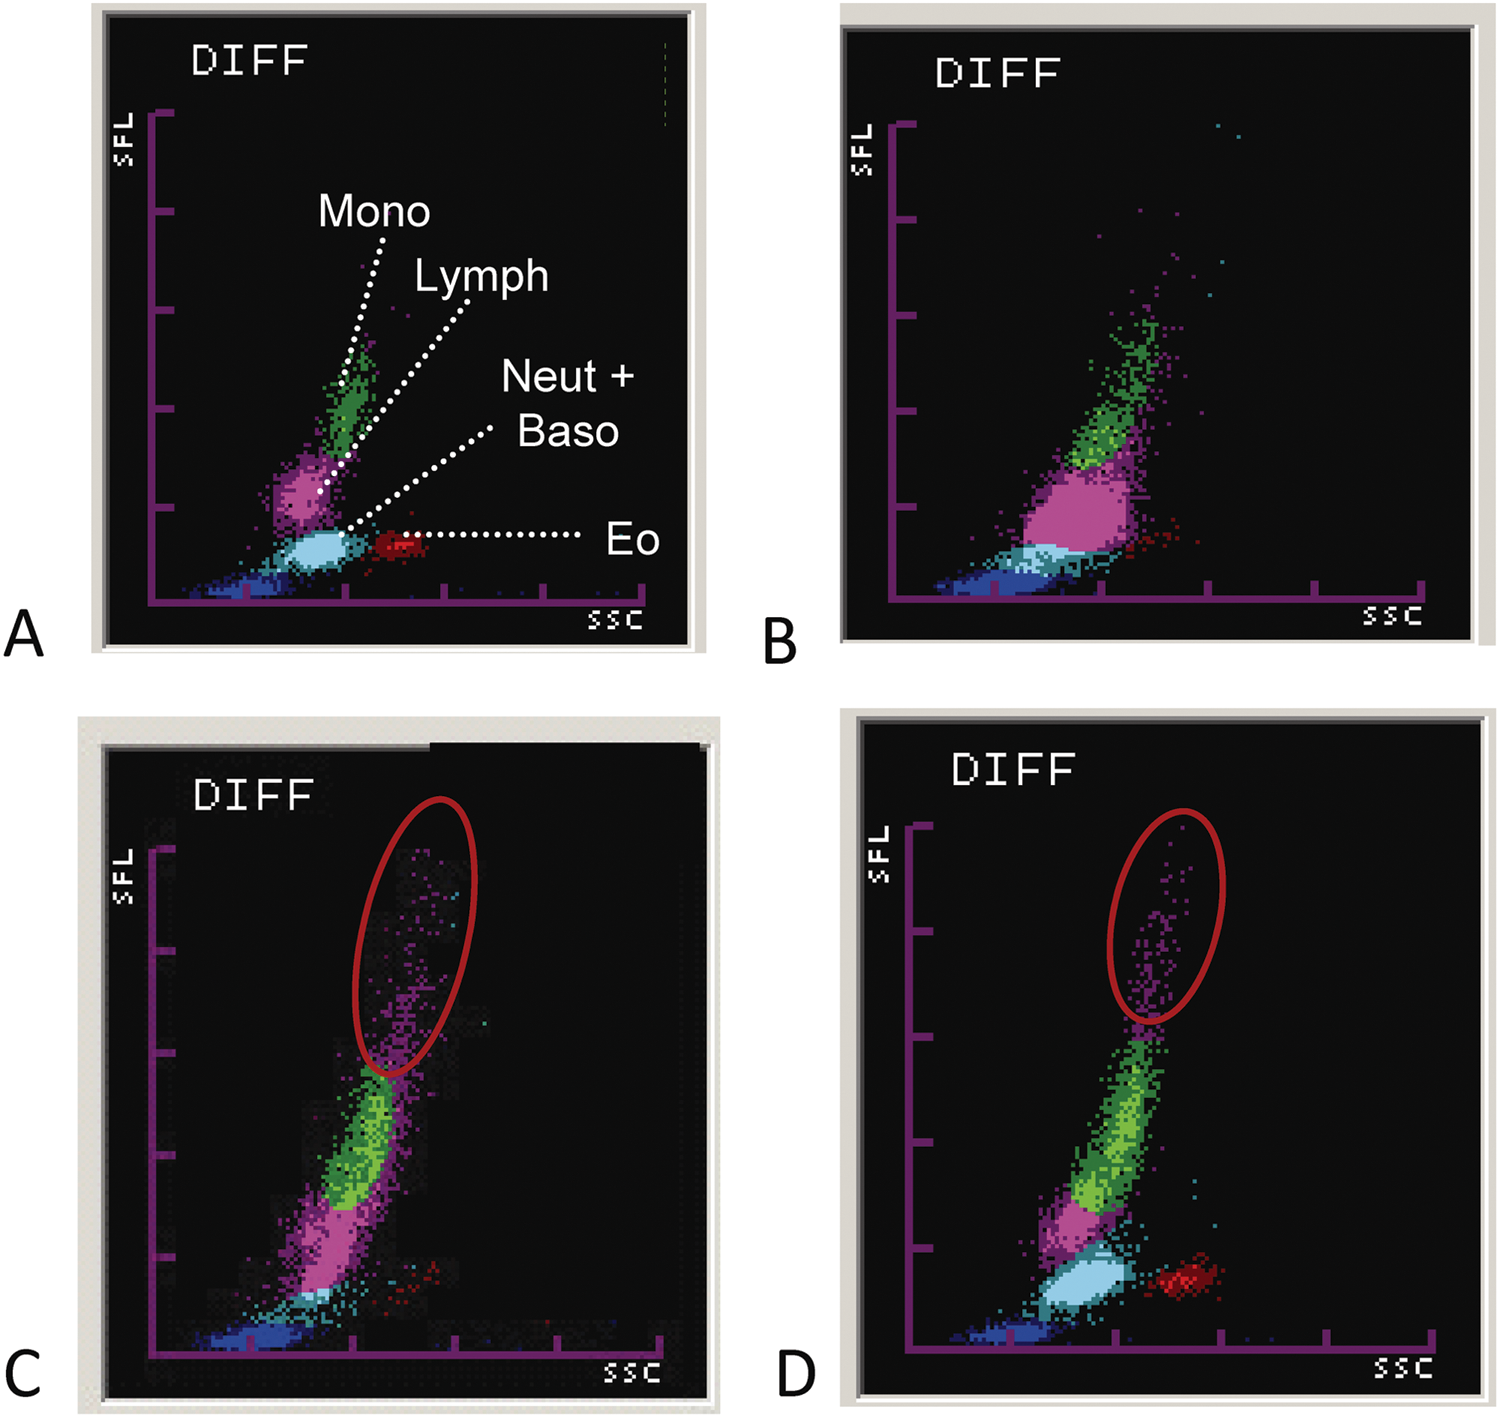
Sysmex XT-2000iV hematology analyzer; leukogram.
Effect of anticoagulant
The impact of anticoagulant on results is shown in Table 4. In cats, the anticoagulant had no significant effects on results for the majority of variables except for significantly mean higher monocyte and lymphocyte counts in EDTA anticoagulated blood compared to heparinized blood. Citrate did not have any significant impact on the results.
Impact of the anticoagulant on the results for cats, dogs, and horses.*
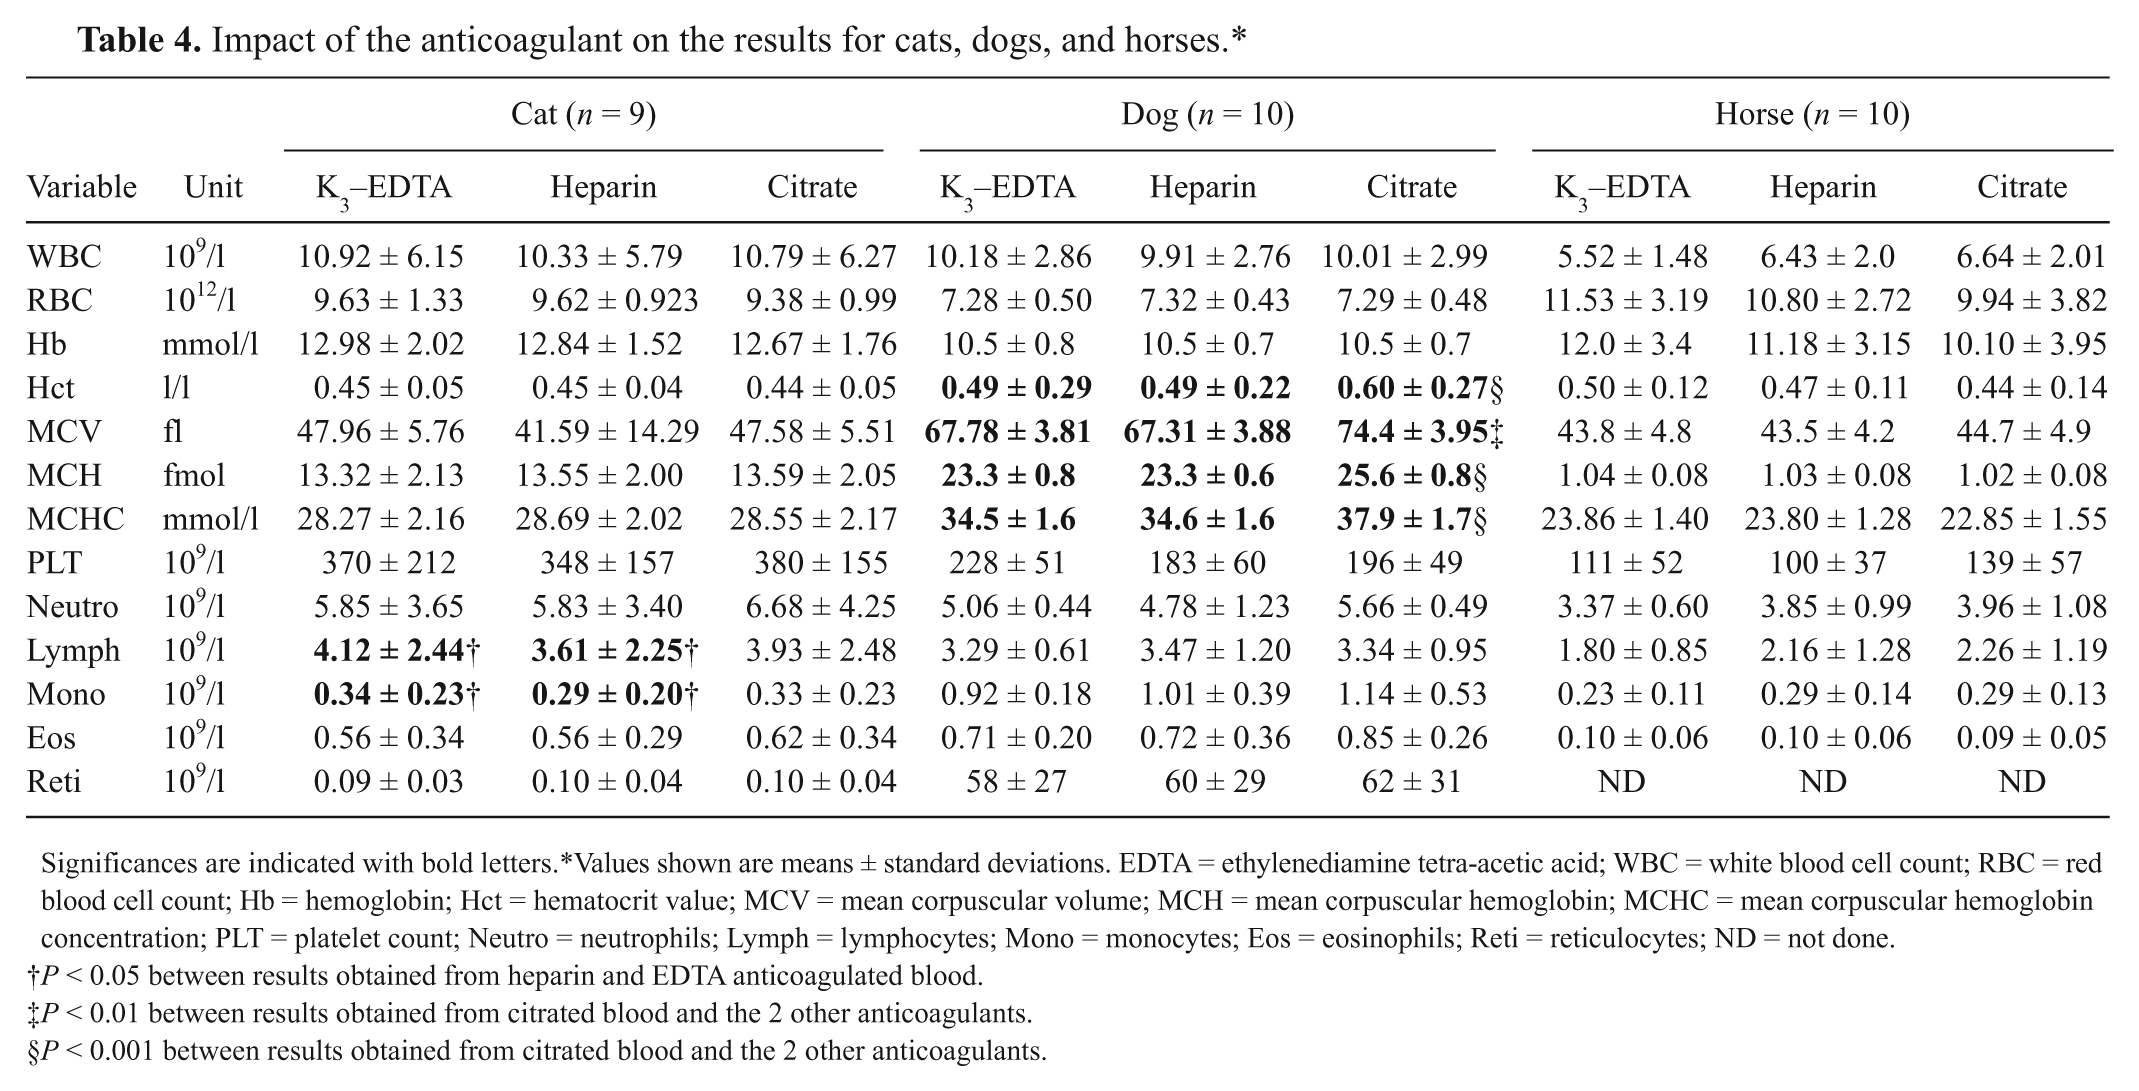
Significances are indicated with bold letters. *Values shown are means ± standard deviations. EDTA = ethylenediamine tetra-acetic acid; WBC = white blood cell count; RBC = red blood cell count; Hb = hemoglobin; Hct = hematocrit value; MCV = mean corpuscular volume; MCH = mean corpuscular hemoglobin; MCHC = mean corpuscular hemoglobin concentration; PLT = platelet count; Neutro = neutrophils; Lymph = lymphocytes; Mono = monocytes; Eos = eosinophils; Reti = reticulocytes; ND = not done.
P < 0.05 between results obtained from heparin and EDTA anticoagulated blood.
P < 0.01 between results obtained from citrated blood and the 2 other anticoagulants.
P < 0.001 between results obtained from citrated blood and the 2 other anticoagulants.
Compared to the other species, most effects of anticoagulant were observed for canine specimens. Using citrate as an anticoagulant resulted in significantly higher results for hematocrit value (Hct), mean corpuscular volume (MCV), mean corpuscular hemoglobin (MCH), and MCH concentration (MCHC) compared to specimens anticoagulated with heparin and EDTA. Although the PLT tended to be lower in heparinized samples, this effect was not significant. In contrast to cats and dogs, the anticoagulant did not have any significant effects on the results in equine samples for all variables assessed herein, although hemoglobin (Hb), RBC, and Hct tended to be higher in EDTA anticoagulated blood compared to heparinized or citrated blood.
Effect of storage and storage temperature
The impact of sample aging on feline, canine, and equine blood specimens is shown in Figures 2–4. The WBC did not change markedly in cats and dogs; however, there was a significant decrease at time point 12 hr in equine samples when specimens were stored at room temperature. Sample storage did not have a significant impact on RBC and Hb in all species, whereas Hct and MCV increased significantly in feline and canine specimens after 6 hr (dog) and 12 hr (cat). In cats and dogs, a significant effect of storage temperature was observed (i.e., the increase was more pronounced when samples was stored at room temperature). The increase of Hct and MCV was more severe in dogs compared to the other species.
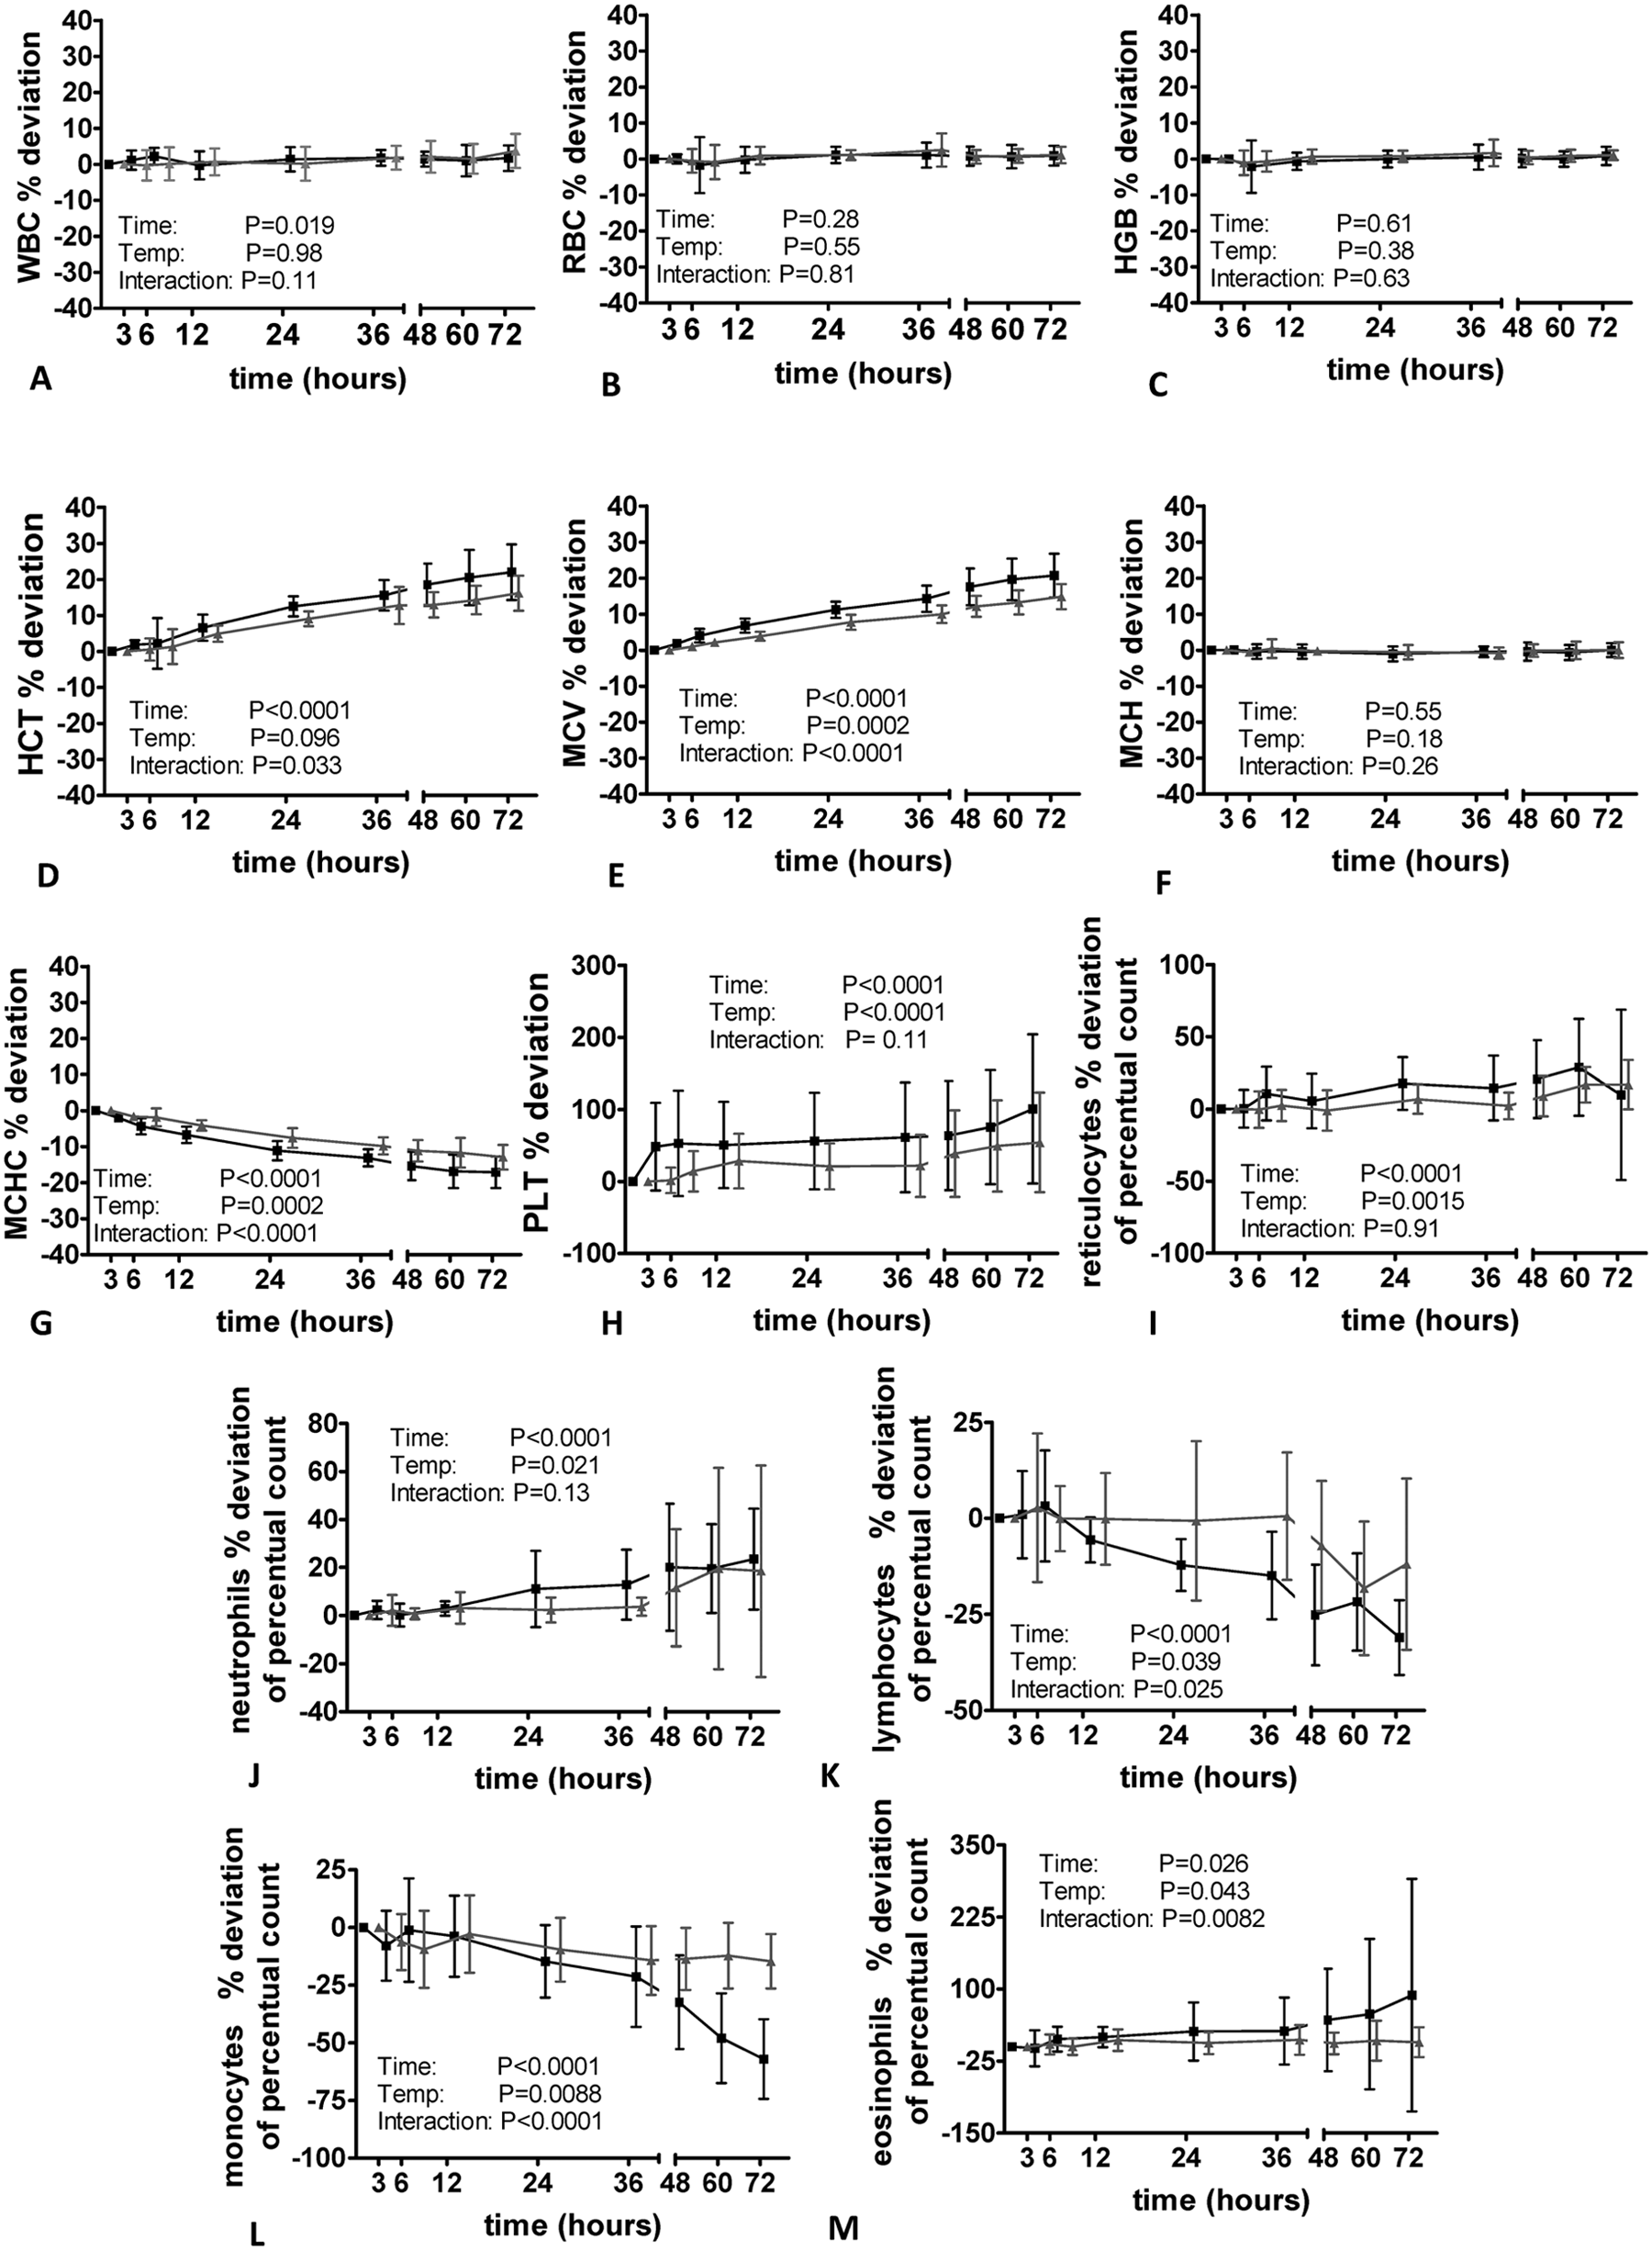
Impact of sample storage at 2 different temperatures on feline specimens measured with the Sysmex XT-2000iV hematology analyzer (n = 9 healthy cats). Values shown are mean ± standard deviations. Black line: storage at 22°C; gray line: storage at 4°C. HGB = hemoglobin; HCT = hematocrit value; MCH = mean corpuscular hemoglobin; MCV = mean corpuscular volume; MCHC = mean corpuscular hemoglobin concentration; PLT = platelet count; RBC = red blood cell count; WBC = white blood cell count.
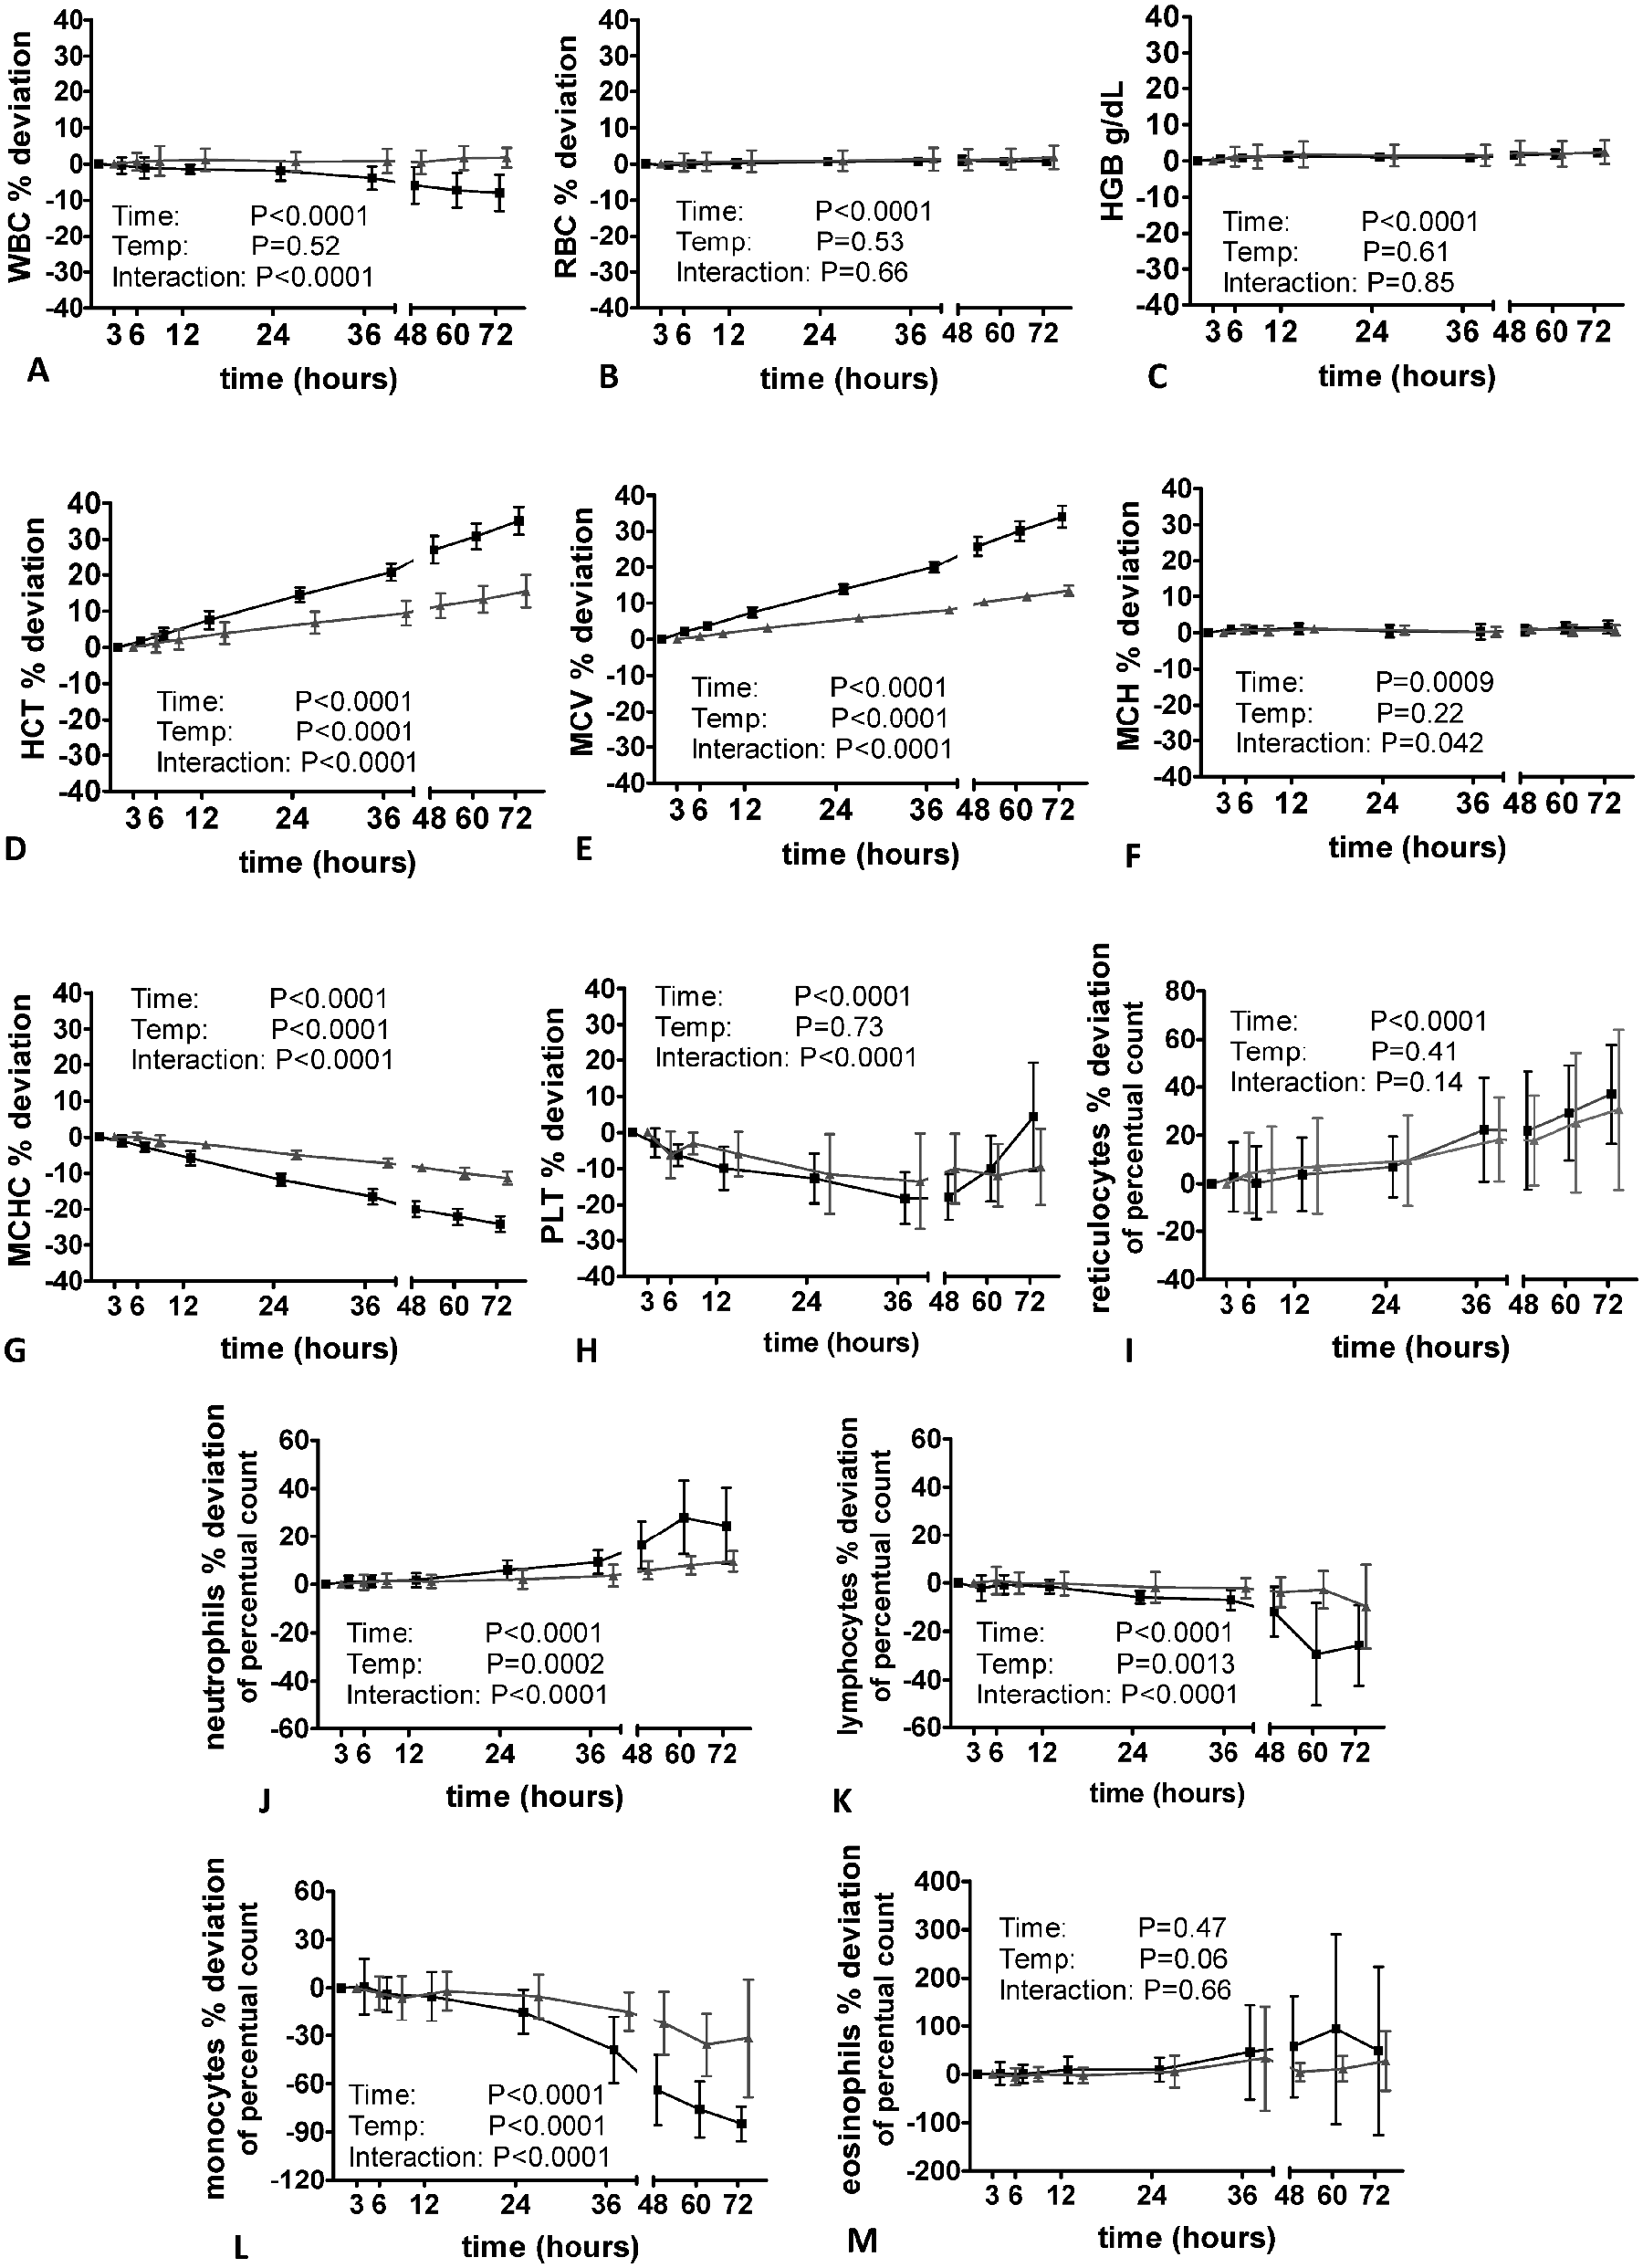
Effect of sample storage at 4°C (gray line) and 22°C (black line) on canine blood specimens assayed with the Sysmex XT-2000iV hematology analyzer (n = 10 healthy dogs). HGB = hemoglobin; HCT = hematocrit value; MCH = mean corpuscular hemoglobin; MCV = mean corpuscular volume; MCHC = mean corpuscular hemoglobin concentration; PLT = platelet count; RBC = red blood cell count; WBC = white blood cell count.
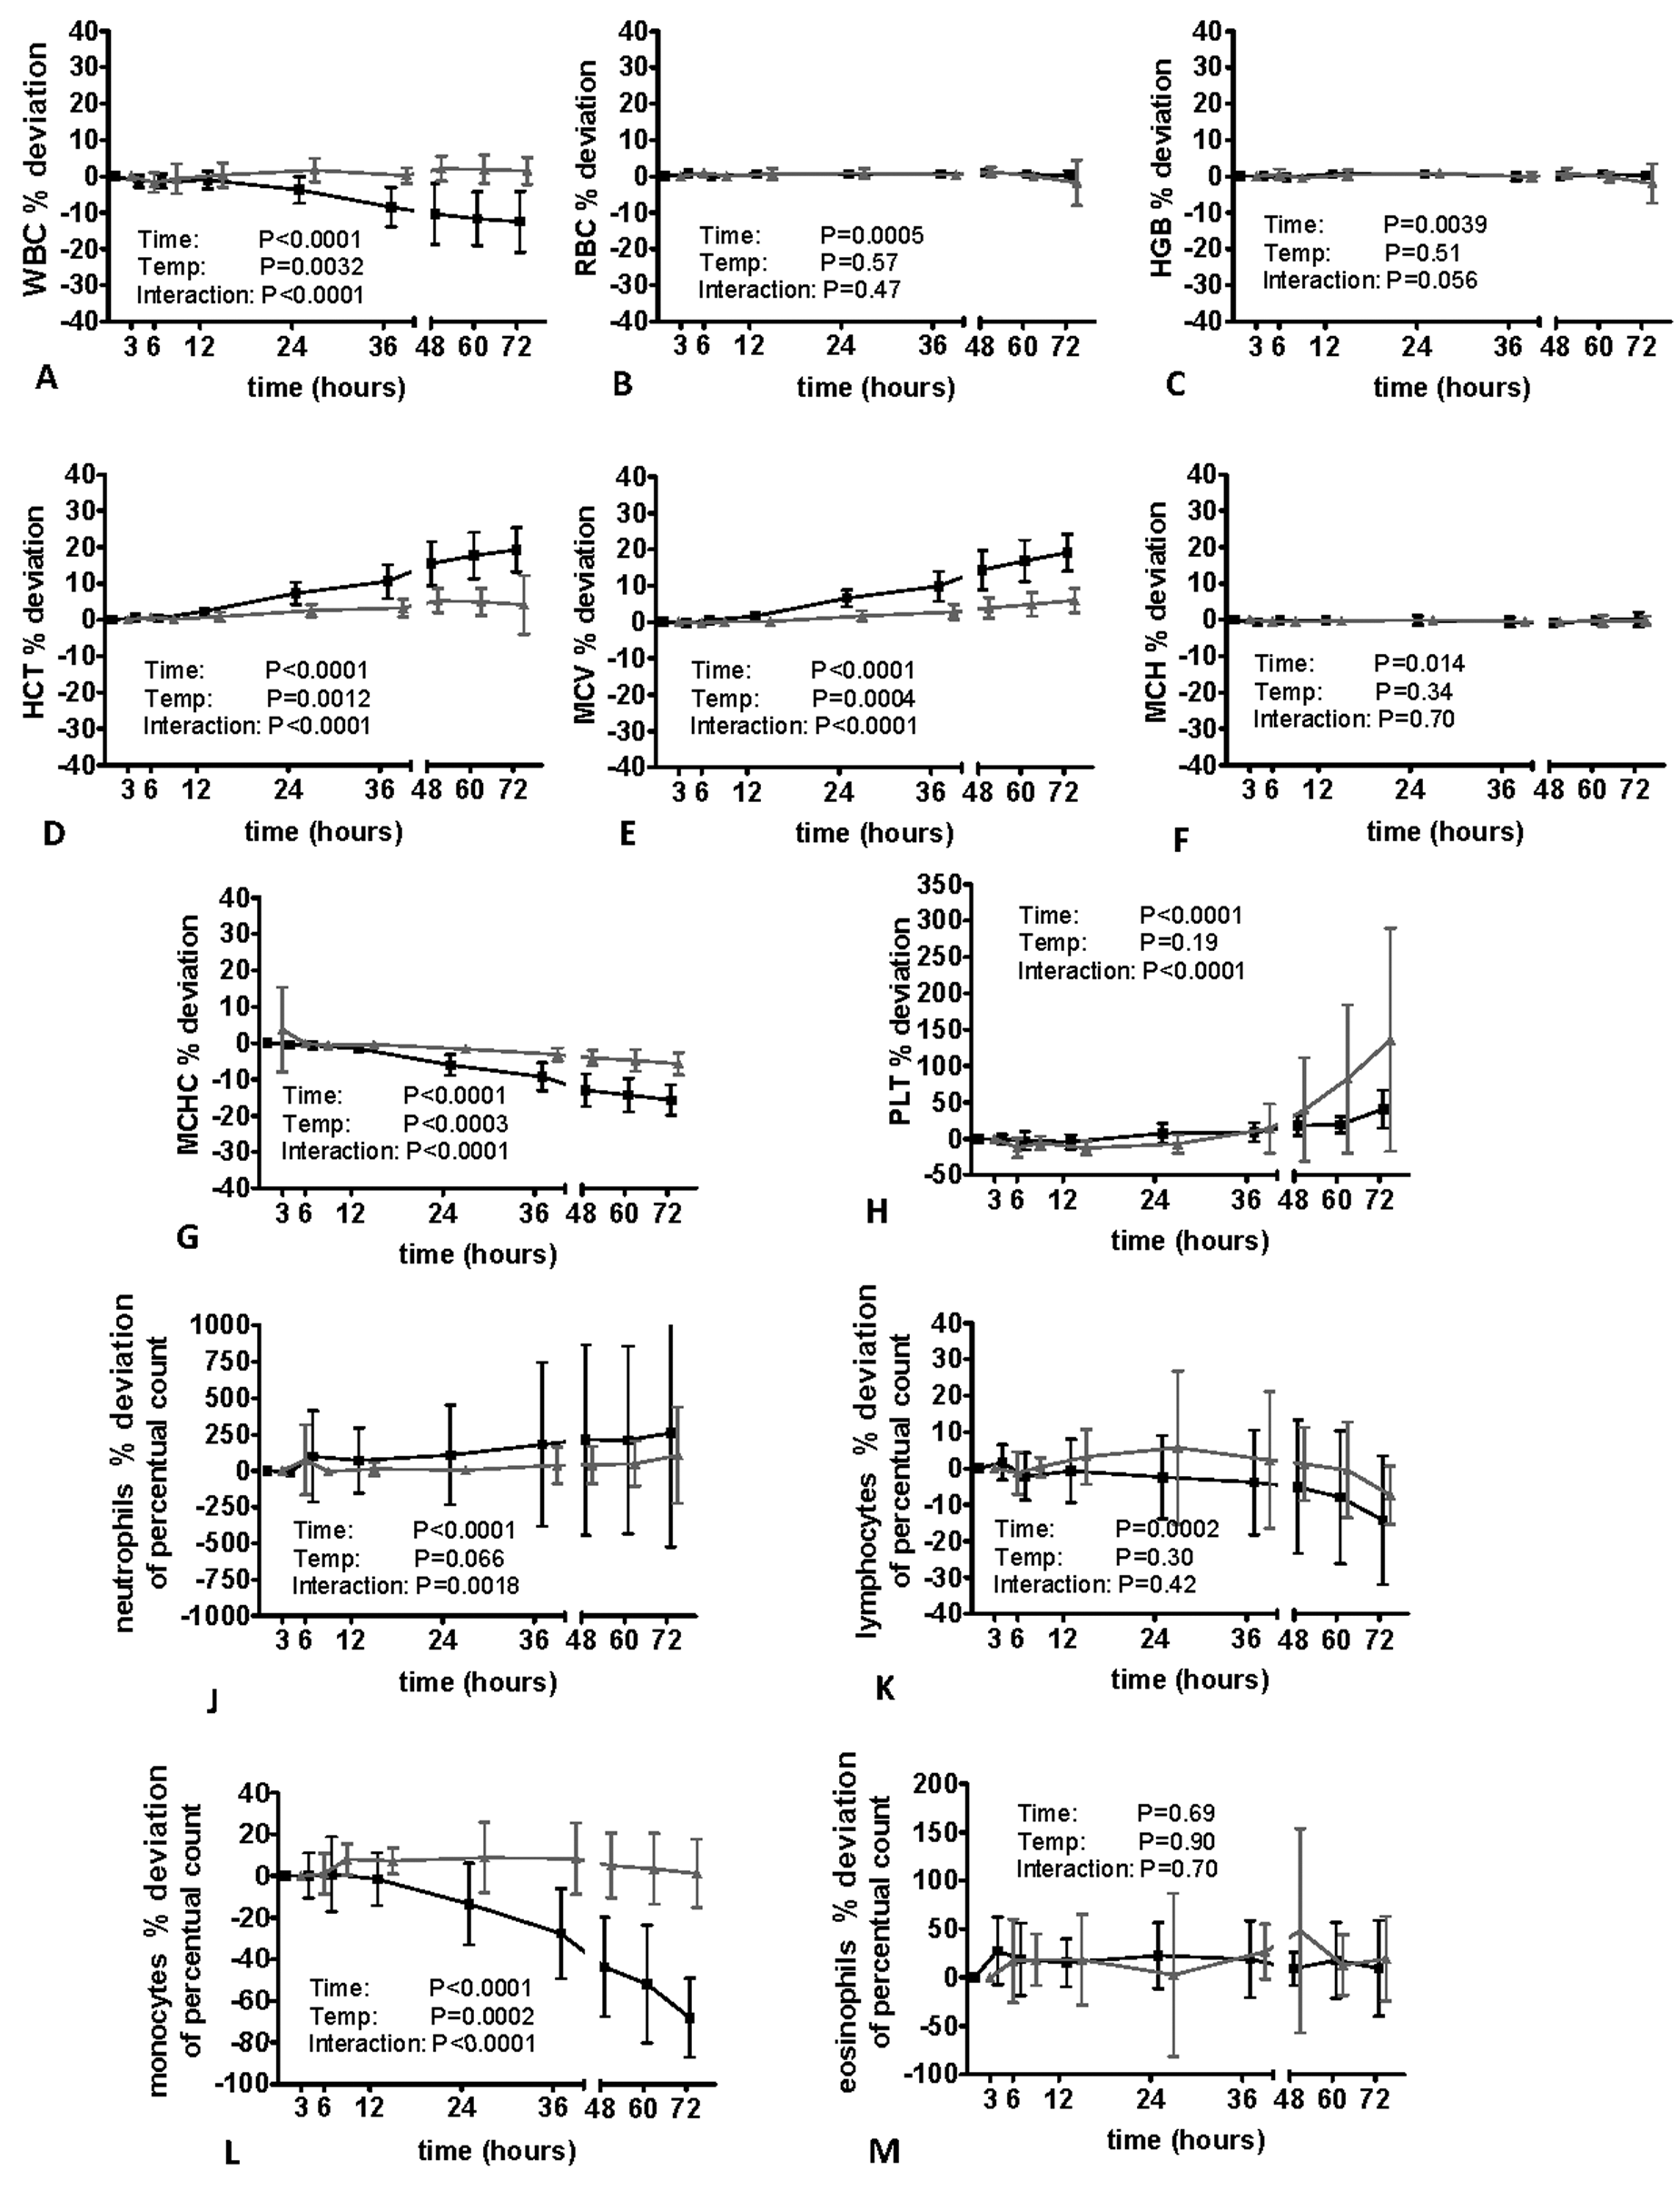
Impact of sample storage at 4°C (gray line) and 22°C (black line) on equine blood samples assessed with the Sysmex XT-2000iV hematology analyzer (n = 10 horses). HGB = hemoglobin; HCT = hematocrit value; MCH = mean corpuscular hemoglobin; MCV = mean corpuscular volume; MCHC = mean corpuscular hemoglobin concentration; PLT = platelet count; RBC = red blood cell count; WBC = white blood cell count.
In horses, Hct and MCV remained stable when specimens were stored at 4°C; however, an increase was observed at time point 12 hr in samples kept at room temperature. Despite a significant effect of time in canine and equine specimens, no major storage-induced changes of MCH were observed in all evaluated species; however, there was a significant decrease in MCHC paralleling the increase in MCV and Hct.
In cats, a mild but significant increase in PLT was noted 3 hr after sampling. Storage at 4°C resulted in a mild increase in PLT after 12 hr; however, it remained significantly lower than in the specimens stored at 22°C. In contrast to cats, sample storage resulted in a significant decrease in PLT starting 3 hr after sampling. When stored at room temperature, PLT increased again after 48 hr of storage. In horses, PLT remained relatively stable at both storage temperatures until time point 48 hr (22°C) and 72 hr (4°C). In specimens stored at room temperature, a marked increase in PLT was observed after 48 hr. Sample storage was associated with an increase in reticulocyte count 24 hr (dog) and 48 hr (cat) after sample taking. In cats, this finding was more pronounced when specimens were stored at room temperature, whereas in dogs no significant impact of storage temperature was evident. Despite the large percentage change of reticulocyte count, the actual results of canine reticulocyte measurements changed only slightly from a basal mean value of 0.76% ± 0.31% to 1.02% ± 0.44% (22°C) for storage at room temperature and from 0.76% ± 0.31% to 0.92% ± 0.33% for samples stored at 4°C.
Except for canine monocytes showing a moderate decrease after 36 hr, the differential count of all species remained relatively stable for 72 hr when specimens were kept at 4°C. In cats, dogs, and horses, storage at 22°C resulted in a significant increase in neutrophil count provided by the analyzer and a significant decrease in lymphocyte and monocyte count, respectively.
The most pronounced effect was observed for the monocyte count decreasing significantly after 6–12 hr storage at room temperature. While in cats and dogs, a storage-induced increase in eosinophil count was noted, the eosinophil count was not significantly altered by sample storage in equine specimens when stored at room temperature. For statistical analysis, samples of 2 horses were removed due to an eosinophil count of 0%, which remained unchanged during the course of storage.
As shown in Figure 5, a decrease in cellular RNA and DNA of neutrophils, lymphocytes, and monocytes was observed in all species. Moreover, events extending from the neutrophil area were seen in cats (Fig. 5A). In dogs, cellular complexity of eosinophils decreased, resulting in a movement of the eosinophil population toward the neutrophils (Fig. 5B). At time point 72 hr, a differentiation between eosinophils and neutrophils was not possible anymore based on their cellular complexity and fluorescence activity.
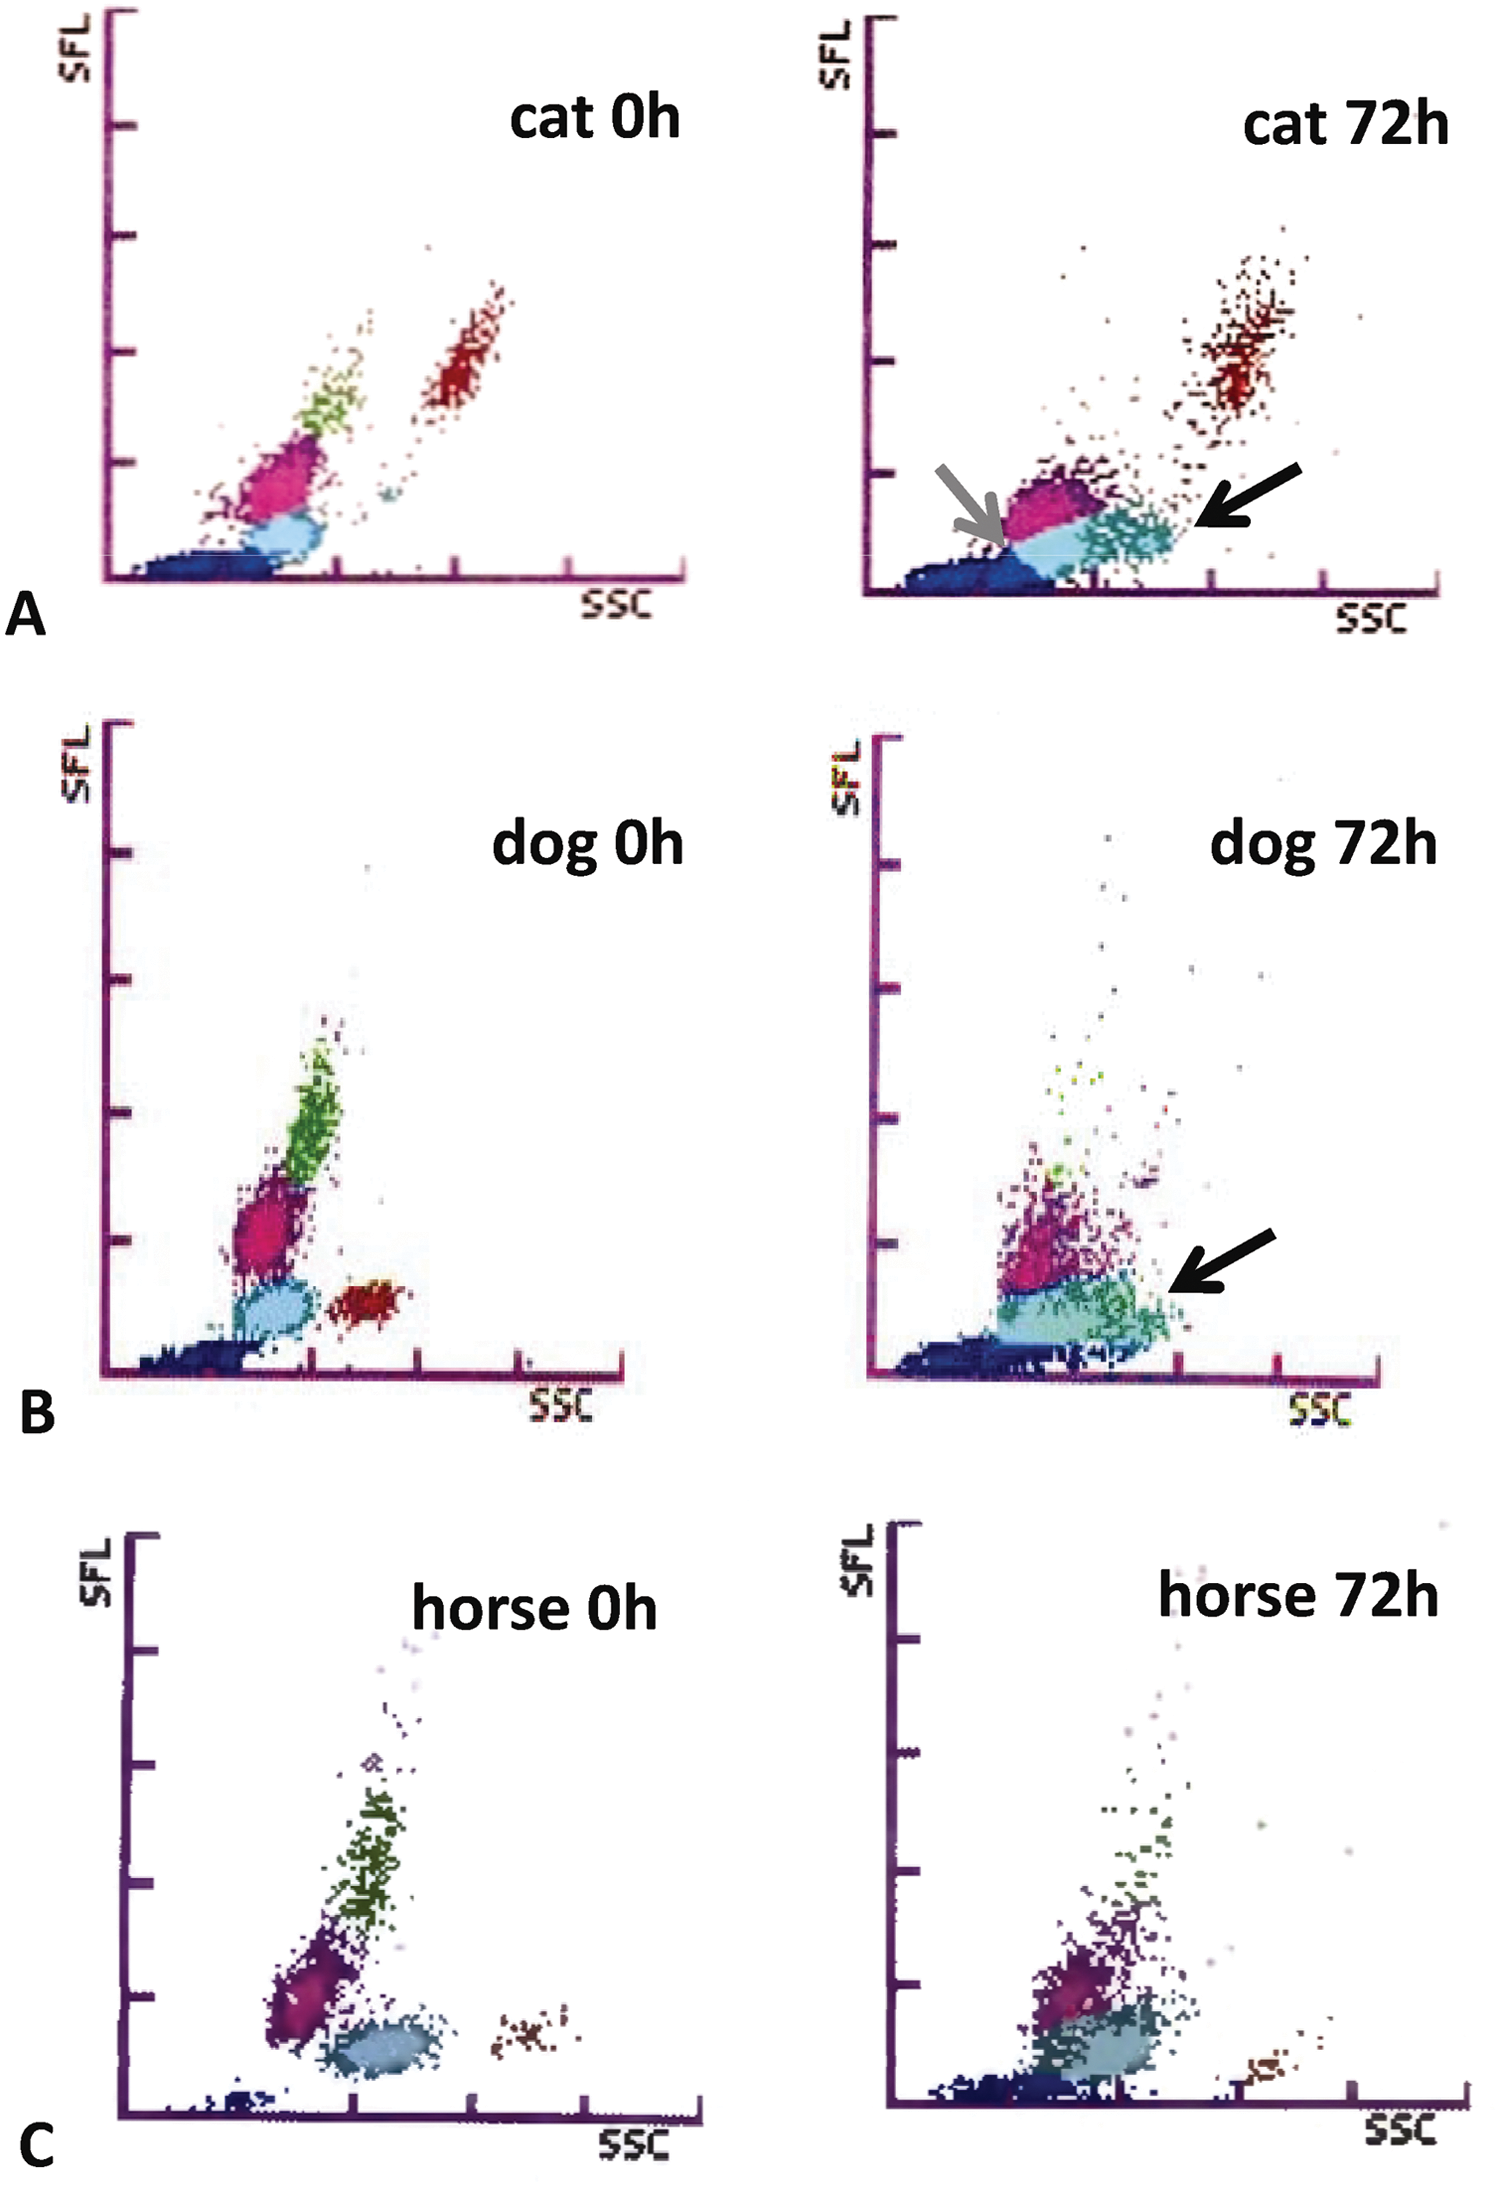
Impact of sample storage at 22°C on the white blood cell count scattergrams of the Sysmex XT-2000iV hematology analyzer. Depicted are examples of a feline, canine, and equine specimen directly after sampling and time point 72 hr.
Discussion
The current study demonstrated an excellent performance of the Sysmex analyzer, which was comparable with the ADVIA analyzer. Of note was the excellent detection of feline eosinophils, which is known to be problematic with other analyzers such as the ADVIA 120 and 2120 (Meyer K: 2005, Softwareadaptation und Evaluation des ADVIA 120 bei der Tierart Katze [Software adaptation and evaluation of the ADVIA 120 for the cat] Thesis. Justus-Liebig University, Giessen, Germany. In German. Abstract in English).
Regarding the manual differential count performed in the current study, it should be taken into account that the precision of the manual differentiation is highly dependent on the number of evaluated cells, which is especially the case for rarer cellular populations such as eosinophils. 21 Even by the evaluation of 500 cells, an acceptable precision for counting lymphocytes, monocytes, eosinophils, and basophils was not achieved. 9 In the current study, a 200-cell differential count was performed for practical reasons; however, a certain imprecision regarding the differential count of rarer cellular populations has to be considered. Nevertheless, the manual differential count is still considered to be the reference method based on the proposals of the Clinical Laboratory Standards Institute. 17
As a proportional bias has been observed herein for feline reticulocytes, the mean values given in Table 1 should be used with caution because they are not representative for an individual measurement. For interpretation of the results of the visual inspection of the scattergrams, it should be kept in mind that the number of samples excluded might be highly variable between the different laboratories and species, respectively, dependent on the amount of highly abnormal samples submitted to the laboratory. Thus, the number of samples in which the automated differential count provided by the analyzers is not reliable depends more on the amount of abnormal samples enrolled in the investigation rather than the analyzer itself.
Regarding the automated differentiation of feline, canine, and equine neutrophils, a similar agreement between automated and manual results was seen for the Sysmex analyzer and the ADVIA 2120 and 120 (cats, Meyer K: 2005, [Software adaptation and evaluation of the ADVIA 120 for the cat] and horses; Dura A: 2006, Blutzellzählung und -Differenzierung mit dem Hämato-logiesystem ADVIA 120—Gerätevalidierung und Softwareadapation [Blood cell count and differentiation using the hematology analyzer ADVIA 120—analyzer validation and software adaptation]. Thesis, Justus-Liebig University, Giessen, Germany), respectively. The best results have been achieved in a previous investigation between the Sysmex analyzer and the manual differential count 11 and the ADVIA 120, respectively, for canine specimens (Fickenscher Y: 2001, Hämatologiesystem ADVIA 120, Softwareadaptation und Evaluation bei der Tierart Hund [The hematology system ADVIA 120, software adaptation and evaluation for the species dog]. Thesis, Justus-Liebig-University, Giessen, Germany).
For canine and feline specimens, there was a good correlation between the manual and automated lymphocyte obtained from the Sysmex analyzer, which was similar to the results published previously 11 and higher than the coefficients of correlation reported for the ADVIA 2120 (dog) in the current study as well as previously for the ADVIA 120 (dog, Fickenscher Y: 2001, [The hematology system ADVIA (120] and cat, Meyer K: 2005, [Software adaptation and evaluation of the ADVIA 120 for the cat]). Regarding equine lymphocytes, a good correlation between the manual and automated differentiation was obtained for the Sysmex analyzer and the ADVIA 2120, which was comparable with the results published previously for ADVIA 120 but slightly lower than the coefficients of correlation reported in a previous evaluation of the Sysmex analyzer. 11
For feline, canine, and equine monocytes, a poor correlation between manual and automated differentiation was seen for the Sysmex analyzer and both the ADVIA 2120 and 120. A good (dog) to fair (cat and horse) correlation, however, was evident in the previous evaluation of the Sysmex analyzer. 11
A possible reason for the discrepancies between the current and the previous investigation might be the fact that the manual differentiation of cellular populations present in low numbers such as monocytes is associated with a high coefficient of variation. 21 Furthermore, monocytes are of highly variable morphology and size 20 and are therefore not always easy to differentiate from other cellular populations such as toxic band neutrophils. Additionally, the presence of cells with a higher fluorescence activity such as reactive lymphocytes, lymphatic blasts, and immature granulocytes may result in a false high monocyte count of the Sysmex analyzer and thus a poor correlation with manual results. Therefore, various numbers of patient samples containing one of those cellular populations are a further explanation for the differences between the current study and the previous evaluation of the Sysmex analyzer. 11
Given the results of the current study, the Sysmex analyzer achieved the best correlation between automated and manual count for feline eosinophils (rs = 0.90), which was slightly higher than reported previously (r = 0.87) 26 but lower than in the previous feline study 11 (r = 0.98). The correlation between the automated eosinophil count obtained from the Sysmex analyzer and the manual differential was much higher compared to other laser-based hematology systems such as the ADVIA 2120 (rs = 0.80) as evaluated herein and the ADVIA 120 (r = 0.62; Meyer K: 2005, [Software adaptation and evaluation of the ADVIA 120 for the cat]). The most probable explanation for the excellent detection of feline eosinophils with the Sysmex analyzer is the fact that the eosinophils are clearly separated from other cellular populations based on their internal structure and RNA content, which is not the case for the other analyzers.
For canine specimens, the Sysmex analyzer achieved a good correlation between automated and manual count for eosinophils, which, however, was lower than reported previously. 11 The correlation between the manual differential count and the automated eosinophil count obtained with the Sysmex analyzer in the current study was comparable to the result reported previously for the ADVIA 120 (Fickenscher Y: 2001, [The hematology system ADVIA 120]) but higher than for the ADVIA 2120. The Sysmex analyzer achieved a fair correlation between automated and manual count for equine eosinophils, which has also been reported previously for the same analyzer, 11 the ADVIA 2120, and the ADVIA 120 (Dura A: 2006, [Blood cell count and differentiation using the hematology analyzer ADVIA 120]).
As obvious in Figure 1A, lymphatic blasts appear to contain an increased amount of fluorescent DNA, which explains the overlap with the population of monocytes. The automated monocyte count given by the analyzer has to be therefore considered as false high.
As evident in Figures 1B and 1C, neutrophils and lymphocytes (Fig. 1B) as well as lymphocytes and monocytes (Fig. 1C) could not be differentiated based on their DNA/RNA content in cats with marked left shift. These findings are in accordance with a previous report. 11 A left shift and toxic changes of neutrophils might result in an overlap between neutrophils and lymphocytes due to the increased DNA and RNA content of immature neutrophils and their different internal structure, so that these cellular populations cannot be distinguished based on their DNA and RNA content. 11 Cytograms without a clear separation of cellular populations have to be verified with the microscopic examination of a blood smear.
For the automated feline and canine reticulocyte count, a small positive bias (i.e., a slightly higher reticulocyte result) was observed between the Sysmex analyzer and ADVIA analyzer, which has also been reported in comparison with the manual reticulocyte count.10,26 The positive bias might influence the cut-off value between regenerative and nonregenerative anemia, which is most likely higher in the Sysmex analyzer than for the ADVIA system. However, the number of anemic cats and dogs included in the present study was too low to define new cut-off values, so future investigations specifically evaluating cats with regenerative and nonregenerative anemia are warranted.
Regarding the use of anticoagulant, EDTA has been recommended as anticoagulant of choice for hematological evaluations. 5 Especially due to the marked increase in MCV and Hct, citrate cannot be recommended as anticoagulant for canine specimens when using the Sysmex analyzer. It might be hypothesized that citrate affects membrane stability of erythrocytes, resulting in an increased fluid uptake and therefore swelling. However, as the effect was only evident when using the Sysmex analyzer and was not reported for the ADVIA 120 (Fickenscher Y: 2001, [The hematology system ADVIA 120]), a combined impact of reagents and the anticoagulant is likely. For the ADVIA 120, however, a significantly higher mean platelet volume and mean platelet component (MPC) were reported for citrate anticoagulated samples (Fickenscher Y: 2001, [The hematology system ADVIA 120]). 2
Based on the literature, controversial reports exist regarding the influence of the anticoagulant on PLT. A previous study reported an increased formation of platelet aggregates resulting in decreased PLT in citrated blood specimens obtained from dogs with neoplasia when compared with EDTA anticoagulated samples. 23 Others reported considerably lower formation of platelet aggregates in citrated blood specimens in comparison to heparinized samples or specimens anticoagulated with EDTA. 15
While the current investigation did not show any significant effect of the anticoagulant on the results obtained with the Sysmex analyzer for equine specimens, a significantly higher MCV as well as a significantly lower MCHC was reported for the ADVIA 120 for equine specimens when EDTA was used as anticoagulant (Dura A: 2006, [Blood cell count and differentiation using the hematology analyzer ADVIA 120]). A reason for this might be that isovolumetric sphering of erythrocytes is required for a reliable determination of the MCV with the ADVIA 120 and 2120, which can only be achieved when using EDTA as anticoagulant. 8 In horses, lithium–heparin resulted in a significantly lower PLT, which was attributed to the formation of PLT aggregates (Dura A: 2006, [Blood cell count and differentiation using the hematology analyzer ADVIA 120]) and has also been observed previously for the predecessor of the ADVIA 120, the H*1 (Seegers M: 1997, Einsatzfähigkeit des Technikon H*1 in der hämatologischen Diagnostik beim Pferd [The utiliy of the Technikon H*1 in the hematological diagnostics in the horse]. Thesis, Justus-Liebig-University, Giessen, Germany). The anticoagulant study was limited by the fact that specimens from diseased horses were included whereas in cats and dogs specimens from healthy animals were used, which might have affected the results. A major impact on the results, however, appears unlikely, as no significant impact of anticoagulant on equine hemograms was detected.
Sample aging resulted in a slight decrease in equine WBC, which has also been reported previously when using the ADVIA 120 analyzer (Dura A: 2006, [Blood cell count and differentiation using the hematology analyzer ADVIA 120]: Meyer K: 2005, [Software adaptation and evaluation of the ADVIA 120 for the cat]). The storage-induced increase in Hct and MCV and the decrease of MCHC observed herein are not surprising and can be attributed to swelling of erythrocytes during prolonged contact with EDTA. Similar findings have been reported previously for dogs6,7 and cats.
In accordance to the current investigation, an increase in Hct, Hb, MCV, neutrophils, eosinophils, and reticulocytes and a decrease in MCHC, lymphocytes, and monocytes has been observed for feline specimens following 24 hr of storage at room temperature. 26 In contrast to the results reported herein, however, the authors reported a storage-induced increase in RBC, but the severity of increase or results of a statistical analysis were not given 26 so that the exact difference between the studies or a probable cause for the discrepant findings could not be evaluated.
The current study clearly showed that the PLT was highly dependent on the duration of storage, which is especially the case if the specimens are stored at room temperature. The formation and deformation of platelet aggregates might have been responsible for the storage-induced increase in PLT. Given the actual results, storage at 4°C can be recommended if the differential leukocyte count cannot be performed within 12 hr after sampling. Most striking is the storage-induced increase in eosinophils in cats, which might be caused by cellular debris detected in the eosinophil gate.
Due to progressive in vitro maturation of reticulocytes, the reticulocyte count can be considered as unstable. 3 In human medicine, reticulocyte counts in specimens kept refrigerated have been reported to be stable for 48 hr. 25 In the current evaluation, an increase in reticulocyte count has been observed after 6–12 hr of storage at room temperature and after 36 hr in specimens stored at 4°C. A storage-induced increase in reticulocyte count has been also reported previously for the ADVIA 120 (Meyer K: 2005, [Software adaptation and evaluation of the ADVIA 120 for the cat]). Microscopic evaluations of blood smears performed after 72 hr of sample storage confirmed that the increase in reticulocyte count can be attributed to storage artifacts (Meyer K: 2005, [Software adaptation and evaluation of the ADVIA 120 for the cat]). In contrast to the current study, sample storage at room temperature was associated with an initial decrease in reticulocyte count, which was followed by an increased number of reticulocytes after 72 hr.
In conclusion, the differential count obtained from the Sysmex analyzer compared favorably with that of the ADVIA analyzer. As for the ADVIA analyzer, evaluation of the analyzer-specific scattergrams might be used as a screening tool to detect abnormalities of the hemogram, which, however, have to be verified with microscopic evaluation of a blood smear. A noted strength of the Sysmex analyzer is the detection of feline eosinophils.
Footnotes
Acknowledgements
The authors wish to thank medical technologist Mrs. Ingrid Klein for helping with the manual methods including the differential cell count, the reticulocyte count, and the spun PCV. The Sysmex instrument used in this study was made available as a free loan by the Sysmex Europe branch.
a.
Siemens Medical Solution Diagnostics, Eschborn, Germany.
b.
Abbott Laboratories, Abbott Park, IL.
c.
Sysmex Corp., Kobe, Japan.
d.
Testpoint™, three levels, Siemens Dx, Fernwald, Germany.
e.
Stromatolyser-4DL, Sysmex Corp., Kobe, Japan.
f.
Stromatolyser-4DS, Sysmex Corp., Kobe, Japan.
g.
e-check, Sysmex Corp., Kobe, Japan.
h.
Article number 42.117, Sarstedt, Nümbrecht, Germany.
i.
Graph Pad Software, San Diego, CA.
k.
BMDP Statistical Software Inc., Los Angeles, CA.
The author(s) declared no potential conflicts of interest with respect to the research, authorship, and/or publication of this article.
The author(s) received the following financial support for the research, authorship, and/or publication of this article: Reagents were provided by the Sysmex company.