
Abstract
Porcine circovirus-2 (PCV-2) is considered the major etiological agent of post-weaning multisystemic wasting syndrome (PMWS) in pigs. The clinical manifestations of the disease are correlated with moderate to high amounts of PCV-2 DNA in biological samples of affected pigs. A threshold of 107 DNA copies/ml is suggested as the trigger factor for symptoms. A comparative study was conducted to determine which quantitative method would be more suitable to estimate the PCV-2 DNA load. Two polymerase chain reaction (PCR) assays were developed: a competitive PCR (cPCR) and a SYBR Green–based real-time PCR. The assays were compared for their capacity to detect PCV-2 in DNA samples extracted from liver, lung, spleen, mesenteric lymph nodes, and kidney of PMWS-affected (n = 23) or non–PMWS-affected pigs (n = 9). Both assays could successfully quantify PCV-2 DNA in all tissue samples and were able to detect significant differences between the numbers of PCV-2 DNA copies found in tissues of PMWS-affected and non–PMWS-affected pigs (≥102.5). The highest mean viral loads were detected by the SYBR Green real-time PCR, up to 107.0±1.5 copies/100 ng of total DNA sample, while the cPCR detected up to 104.8±1.5. A mean difference of 101.8 was found between the amounts of PCV-2 DNA detected, using the SYBR Green real-time PCR and the cPCR, suggesting that the viral load threshold for PMWS should be determined for each particular assay.
Keywords
Introduction
Porcine circovirus-2 (PCV-2; family Circoviridae, genus Circovirus) is distributed worldwide in swine herds and is an important cause of economic losses for the pig industry. 6 The virus is regarded as the major infectious agent involved in the development of post-weaning multisystemic wasting syndrome (PMWS).1,9,20 However, PMWS is a multifactorial disease where PCV-2 is necessary but not sufficient for its development. 13 Typical PMWS signs include progressive weight loss, signs of respiratory impairment, and jaundice (Clark EG: 1997, Post-weaning wasting syndrome. In: Proceedings of the American Association of Swine Practitioners 28:499–501). Macroscopic lesions include granulomatous interstitial pneumonia, lymphadenopathy, and granulomatous hepatitis and nephritis. 2 Microscopically, PMWS is characterized by macrophage infiltration, syncytia formation, and inclusion bodies in cells of lymphoid tissues. 26 PCV-2 is also associated with other pathological conditions, including congenital tremors, 30 respiratory disease, 14 porcine dermatitis and nephropathy syndrome (PDNS), 3 abortions, 33 and other reproductive disorders. 21 Diseases associated with PCV-2 are collectively termed porcine circovirus diseases (PCVD), 28 or porcine circovirus–associated disease (PCVAD). 22 Healthy pigs can also be infected with PCV-2, but such pigs will bear lower viral loads than diseased animals. The sole presence of anti–PCV-2 antibodies and/or PCV-2 DNA is not sufficient to establish a definitive PMWS diagnosis, which is usually performed by analyzing data from clinical signs, histopathology, and detection of PCV-2 within tissue lesions.6,28
Among the methods available to detect viral DNA, a substantial number of assays have been described based on variations of the polymerase chain reaction (PCR),16,23,35 multiply primed rolling-circle amplification, 8 loop-mediated isothermal amplification, 7 and microarray analyses. 12 However, as PCV-2 is ubiquitously present in swine regardless of disease status, methods based on qualitative PCR are not appropriate for the establishment of a definitive PMWS diagnosis. In view of that, different types of quantitative PCR assays have been developed to measure the amount of PCV-2 DNA in animals, including a competitive PCR (cPCR) 17 and several real-time PCR–based assays.5,19,29,32,34 In cPCR, the target DNA and an internal standard, the so-called competitor, are simultaneously amplified; the 2 fragments must be recognized by the same pair of primers. 36 The initial amount of target DNA is obtained by a comparison between the intensity of the bands of the target DNA and the competing DNA upon gel electrophoresis. 36 On the other hand, real-time PCR–based assays generate a fluorescent signal during the amplification cycle, which is directly correlated with the amount of target DNA molecules as well as inversely with the number of PCR cycles needed to reach a fluorescent signal threshold. 10
In the present study, a cPCR and a SYBR Green–based real-time PCR were developed and evaluated to establish the most suitable method to determine the amount of PCV-2 DNA in swine tissue samples from PMWS-affected or healthy pigs, in an attempt to contribute to the diagnosis of PMWS.
Material and methods
Tissue samples
Tissue samples were collected from 23 PMWS-affected (PMWS group) and 9 healthy, non–PMWS-affected (non-PMWS group) pigs. The 5–8-week-old pigs of the PMWS group were obtained from pig farms in the state of Rio Grande do Sul, Brazil. At arrival, the pigs were showing clinical signs of PMWS, such as wasting, dyspnea, enlargement of superficial inguinal lymph nodes, pallor, jaundice, and diarrhea. These animals were subjected to necropsy following the general recommendations of COBEA (Brazilian Committee on Experimental Animal Care). Histopathological and immunohistochemical tests of tissues from animals in this group confirmed the PMWS diagnosis. The healthy, non–PMWS-affected group consisted of samples collected from finishing-age pigs (16–18 weeks old) randomly chosen in a slaughterhouse. Samples were collected from kidneys, livers, lungs, mesenteric lymph nodes, and spleens from all animals. The samples were stored at −70°C until used.
DNA extraction
The DNA extraction method was performed as described elsewhere, 31 with minor modifications, as follows. Ten milligrams of tissue were minced and digested for 4 hr at 37°C in 1 ml of lysis buffer (10 mM Tris, a 1 mM ethylenediamine tetra-acetic acid [EDTA], b 100 mM NaCl c ) containing 0.5% sodium dodecyl sulfate d and 0.1 mg proteinase K. e The DNA was extracted twice with 1 ml phenol e :chloroform f :isoamyl alcohol f (25:24:1). After centrifugation, 2 volumes of 100% ethanol f were added to the water phase, and the mixture was kept at −20°C for 2 hr. After this, the mixture was centrifuged, and the obtained DNA pellet was washed with 70% ethanol, f air-dried, and re-suspended in 100 µl of TE (10 mM Tris, a 1 mM EDTA, b pH 7.4).
Oligonucleotides used in the PCR assays
The nucleotide sequences of the primers used for the cPCR were based on a previously published sequence used in a qualitative PCV-2 PCR. 15 The primers used were 1094F (5’-CGGATATTGTAGTCCTGG TCG-3’) and 1569R (5’-ACTGTCAAGGCTACCACAG TCA-3’). These oligonucleotides anneal within the open reading frame-2 region of the PCV-2 genome at nucleotides 1094–1114 (numbers based on PCV-2 genome 15/5P 8 of GenBank accession no. DQ923523) and at nucleotides 1548–1569, respectively. Amplification with such primers should give rise to an amplicon with an expected size of 476 base pairs (bp).
The primers used for the SYBR Green real-time PCR were designed using PrimerSelect software g and were chosen from within the region amplified by the cPCR (Fig. 1A). The designed primers were 1127F (5’-TCGAACGCAGT GCCGAG-3’) and 1190R (5’-AGCTGTGGCTGAGACTAC AAACT-3’), and were complementary to nucleotides 1027–1043 and 1190–1168 of the PCV-2 15/5P genome (GenBank accession no. DQ923523). The primers were expected to amplify a fragment of 64 bp and were different from the ones used for the cPCR because the maximum recommended size of an amplicon for a real-time PCR is 200 bp. 24
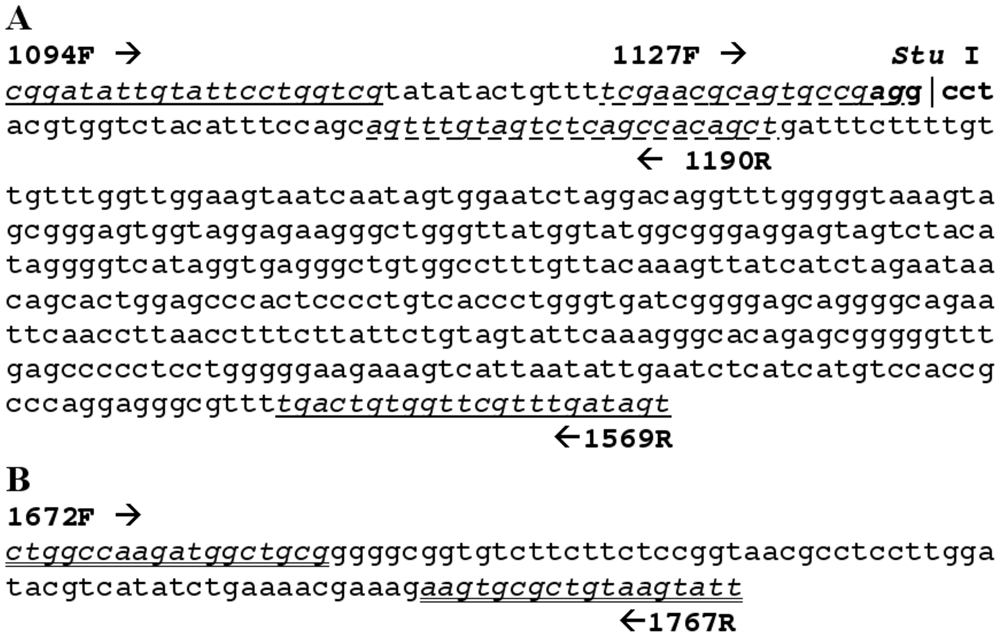
Positions of the primers used in the current study in relation to nucleotide sequence of Porcine circovirus-2 (PCV-2) isolate 15/5P.
Competitive PCR
The cPCR reactions were performed using a fixed amount of DNA (100 ng) extracted from the tissue samples to be examined, plus a variable amount of competitor plasmid p572 (see below). The 25-µl reaction volume contained 0.2 mM of each deoxyribonucleotide triphosphate, h 3 mM MgCl2, e 10 pmol of each primer (1094F and 1569R), 1 U of Taq polymerase, e 100 ng of DNA sample, and 2 µl of competitor plasmid DNA p572. For each tested sample, 11 reactions were assembled using one of the p572 diluted DNA, which ranged from 1010 to 100 DNA copies added per tube. A negative control sample was added between each 4 tissue samples under testing, where test DNA was substituted by 100 ng DNA extracted from PK-15 (porcine kidney epithelial) cells. i The reaction was performed as follows: initial incubation at 94°C for 4 min, 35 cycles at 94°C for 30 sec, 65°C for 1 min, and 72°C for 1 min, followed by a final extension at 72°C for 10 min. Five microliters of the amplification products were analyzed on 1.5% agarose gel. The equivalence point, at which the bands of the target DNA (476 bp) and competitor (572 bp) had equal intensities, were determined on agarose gel by visual inspection and densitometric scanning using the KDS software. j
Construction of a competing template
Using the cPCR protocol described above, an amplicon with the expected size (476 bp) was produced by amplification of DNA from the PCV-2 isolate 15/5P. The obtained amplicon was ligated into the cloning vector pCR 2.1-TOPO e and used to transform competent Escherichia coli cells. The resulting plasmid was named p476. Plasmid DNA was isolated from an overnight culture of transformed E. coli cells using standard methods. 27 To construct the competitor template that would generate a slightly larger amplicon, p476 was cleaved with Stu I, k and a 96-bp fragment was inserted into the site, resulting in plasmid p572. The 96-bp fragment was obtained through PCR using primers 1672F (5’-CTGGCCAAGATGGCTGCG-3’) and 1767R (5’-AATACTTACAGCGCACTT-3’), and the 15/5P PCV-2 isolate DNA as a template (Fig. 1B).
Quantitation of plasmid DNA copy numbers and co-amplification of PCV-2 DNA with competitor DNA
DNA from plasmids p476 and p572 was quantified in an ethidium bromide–stained agarose gel. The amount of plasmid DNA was determined by comparing the intensity of the obtained bands with those of the mass DNA ladder k (0.75 µg/lane) performed with the aid of the KDS software. j The number of plasmid DNA copies were calculated assuming an average molecular mass of 660 Da for each base pair of double-stranded DNA. The calculation was performed using the following equation: number of DNA copies per nanogram = (NA × 10-9)/(n × mw), where NA is the Avogadro constant (6.02 × 10²³ molecules/mol), n is the size of the plasmid in base pairs (4407 bp for p476 or 4503 bp for p572), and mw is the molecular weight per bp (660 Da). Plasmid DNA was then diluted in DNAse-free water e to a final concentration of 1010 molecules/2 µl, and 10-fold serially diluted. The dilutions were used with both the cPCR (p572) and the SYBR Green real-time PCR (p476).
To test whether the insertion of 96 bp within the PCV-2 target sequence changed the amplification performance of p572, 10-fold dilutions of equal amounts of the target DNA (p476) and competing DNA (p572) were co-amplified using the cPCR protocol mentioned above.
SYBR Green real-time PCR
The SYBR Green real-time PCR reactions were set up with 10 µl of SYBR Green PCR master mix, l 5 pmol of each primer (1127F and 1190R), and 100 ng DNA sample in a total volume of 20 µl. As a negative control, 100 ng of DNA extracted from uninfected PK-15 cells were used. All real-time reactions (standards, test samples, and controls) were performed in duplicate. The reported results are an average of these duplicates. The SYBR Green real-time PCR were performed in a commercial system l employing the following cycling conditions: 2 min at 50°C, 10 min at 95°C, followed by 40 cycles of 15 sec at 94°C and 45 sec at 60°C. A dissociation curve was performed after amplification by a gradual rise in temperature from 60 to 95°C. Data analysis was performed with the aid of the SDS software 1.3.1. l The number of copies of viral DNA was determined by comparison with a standard curve (see below).
Standard curve for the SYBR Green real-time PCR
To create a standard curve for the SYBR Green real-time PCR, 10-fold dilutions (1010–100) of plasmid p476 were used as target DNA templates. The standard curve was constructed by plotting the plasmid copy number on a log10 scale against the measured threshold cycle (Ct) values. One hundred nanograms of total DNA extracted from PK-15 cells i were used as negative control. The reactions were carried out as described above.
Specificity and sensitivity of cPCR and SYBR Green real-time PCR
The specificity of cPCR and SYBR Green real-time PCR were studied with respect to Porcine circovirus-1 (PCV-1). Duplicates of 100 ng total DNA of PK-15 cells persistently infected with PCV-1 were analyzed under the optimal conditions of the assays as determined above. SYBR Green real-time PCR and cPCR sensitivity was tested in triplicates using 10-fold dilutions (1010–100 copies/reaction) of p476 plasmid DNA as standard and 100 ng of DNA extracted from PCV-2–free tissue samples.
Statistical analysis
In order to normalize the acquired data for statistical analysis, the number of copies of PCV-2 DNA obtained by the 2 PCR assays under comparison was transformed in log10. Descriptive statistics, Pearson correlation coefficient, and analysis of variance were performed using the SPSS 16.0 software m ; differences were considered significant when P ≤ 0.05. In order to determine the agreement between the 2 assays, the Bland–Altman plot was constructed based on differences of PCV-2 copy numbers (SYBR Green real-time minus cPCR) against their means. 4 The MedCalc software n (version 11.5.0.0) was used for this analysis, and the significance was accepted at P ≤ 0.05.
Results
Co-amplification of PCV-2 DNA with competitor DNA
The amplification of the competitor template produced a band of predicted size (572 bp), which was clearly distinguishable from the 476-bp viral amplicon (Fig. 2). The efficiency of amplification was equivalent for both target and competitor DNA, because over the range of 1010–101 DNA copies, the intensities of the amplified bands were the same for the p476 and p572 templates (data not shown).
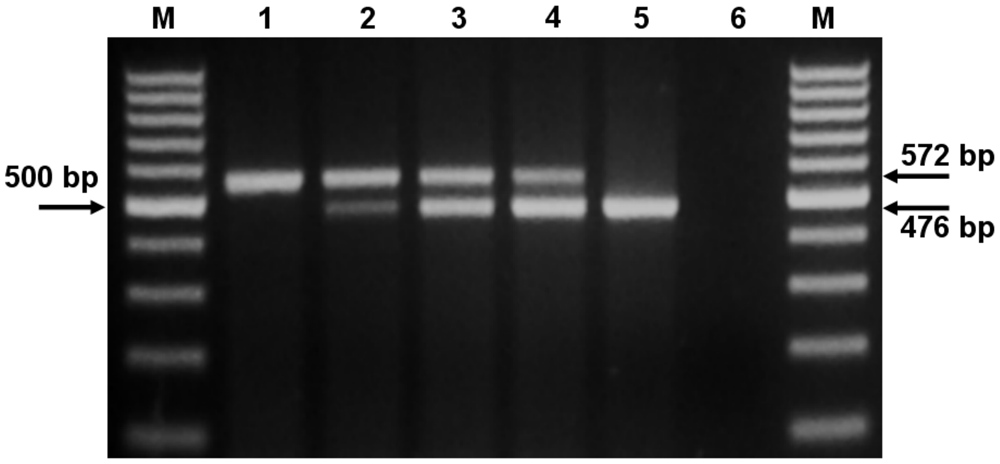
Electrophoretic analysis of the products of the competitive polymerase chain reaction (cPCR) on 1.5% agarose gel stained with ethidium bromide. Lane M: a 100-bp ladder, o the left arrow points to the 500-bp fragment; lanes 1–5: cPCR products from reactions performed on 100 ng of tissue DNA plus variable amounts (106–102 molecules) of competitor plasmid (p572) DNA; lane 3: equivalence point—104 molecules of PCV-2 DNA in the tissue sample and 104 molecules of competitor plasmid p572; lane 6: negative control (100 ng of PK-15 DNA).
Specificity and sensitivity of the cPCR and SYBR Green real-time PCR
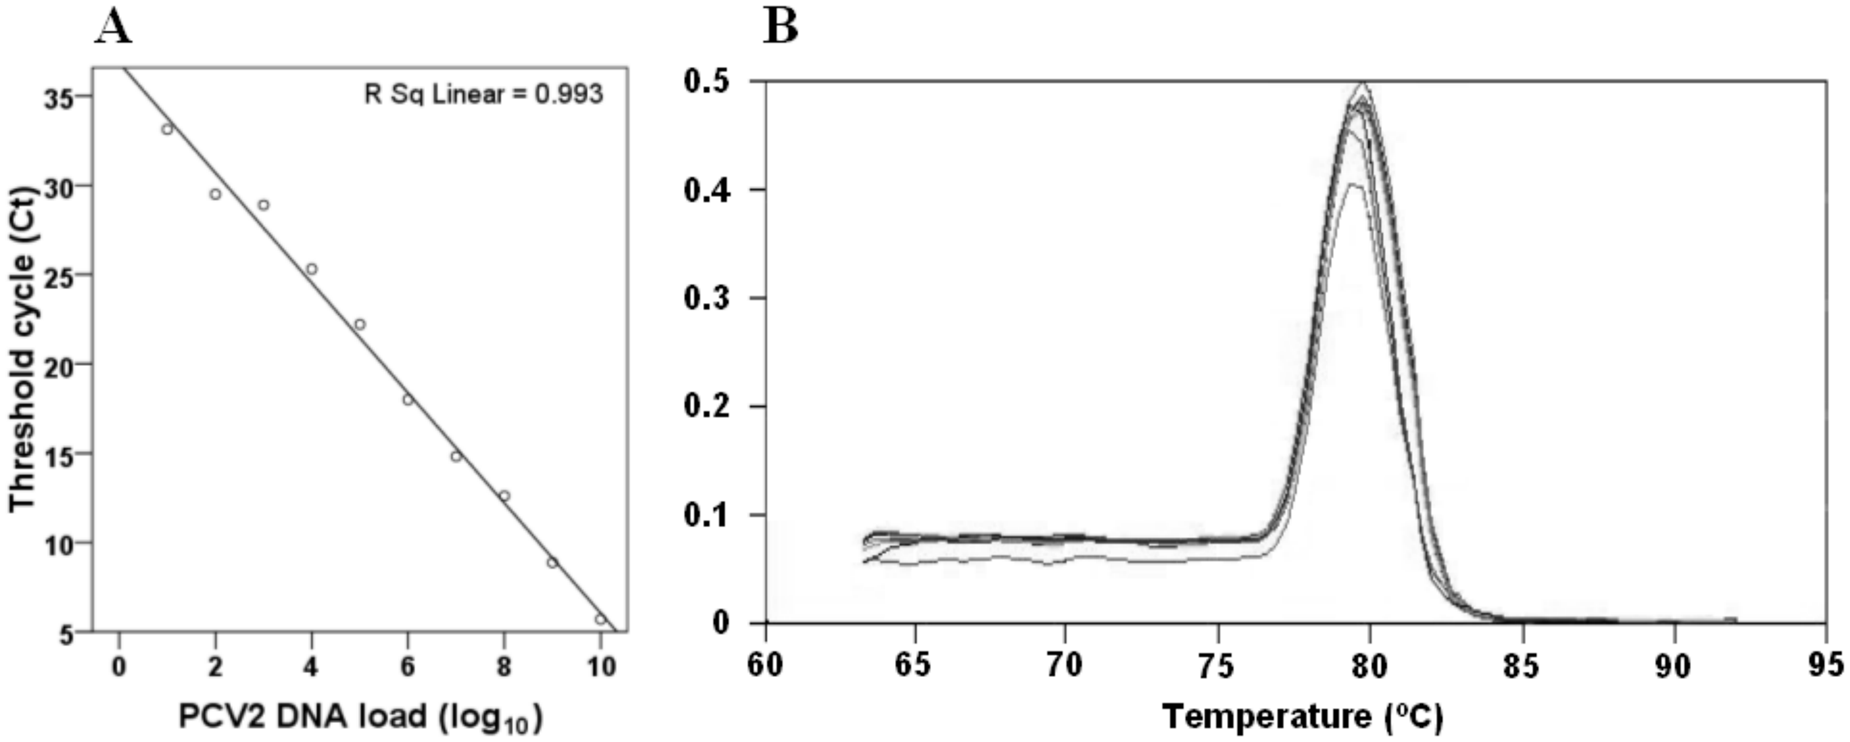
Neither a specific band with the cPCR (Fig. 2, lane 6) nor any significant fluorescence signal could be detected by SYBR Green real-time PCR when PCV-1 DNA sample was used. Negative controls did not give rise to any amplification product; therefore, no peaks were observed on the dissociation curve. The observed temperature of dissociation of the 64-bp amplicon occurred between 79.3°C and 80.3°C (Fig. 3B). Nevertheless, the PK-15 cells used as PCV-2–negative control were indeed positive for PCV-1, as demonstrated with a primer pair specifically designed for PCV-1 15 amplification in a qualitative PCR (data not shown). On the sensitivity assays, SYBR Green real-time PCR and cPCR showed similar sensitivity, detecting from 1010 to 101 copies of plasmid DNA per reaction.
Standard curve for the SYBR Green real-time PCR
The generated standard curve covered a linear range of 101–1010 p472 DNA copies (Fig. 3A), and the value of the linear regression (R2) calculated between DNA copy number and Ct value was 0.993. The detection limit found on this assay was 10 copies of PCV-2 DNA per sample.
Determination of viral load
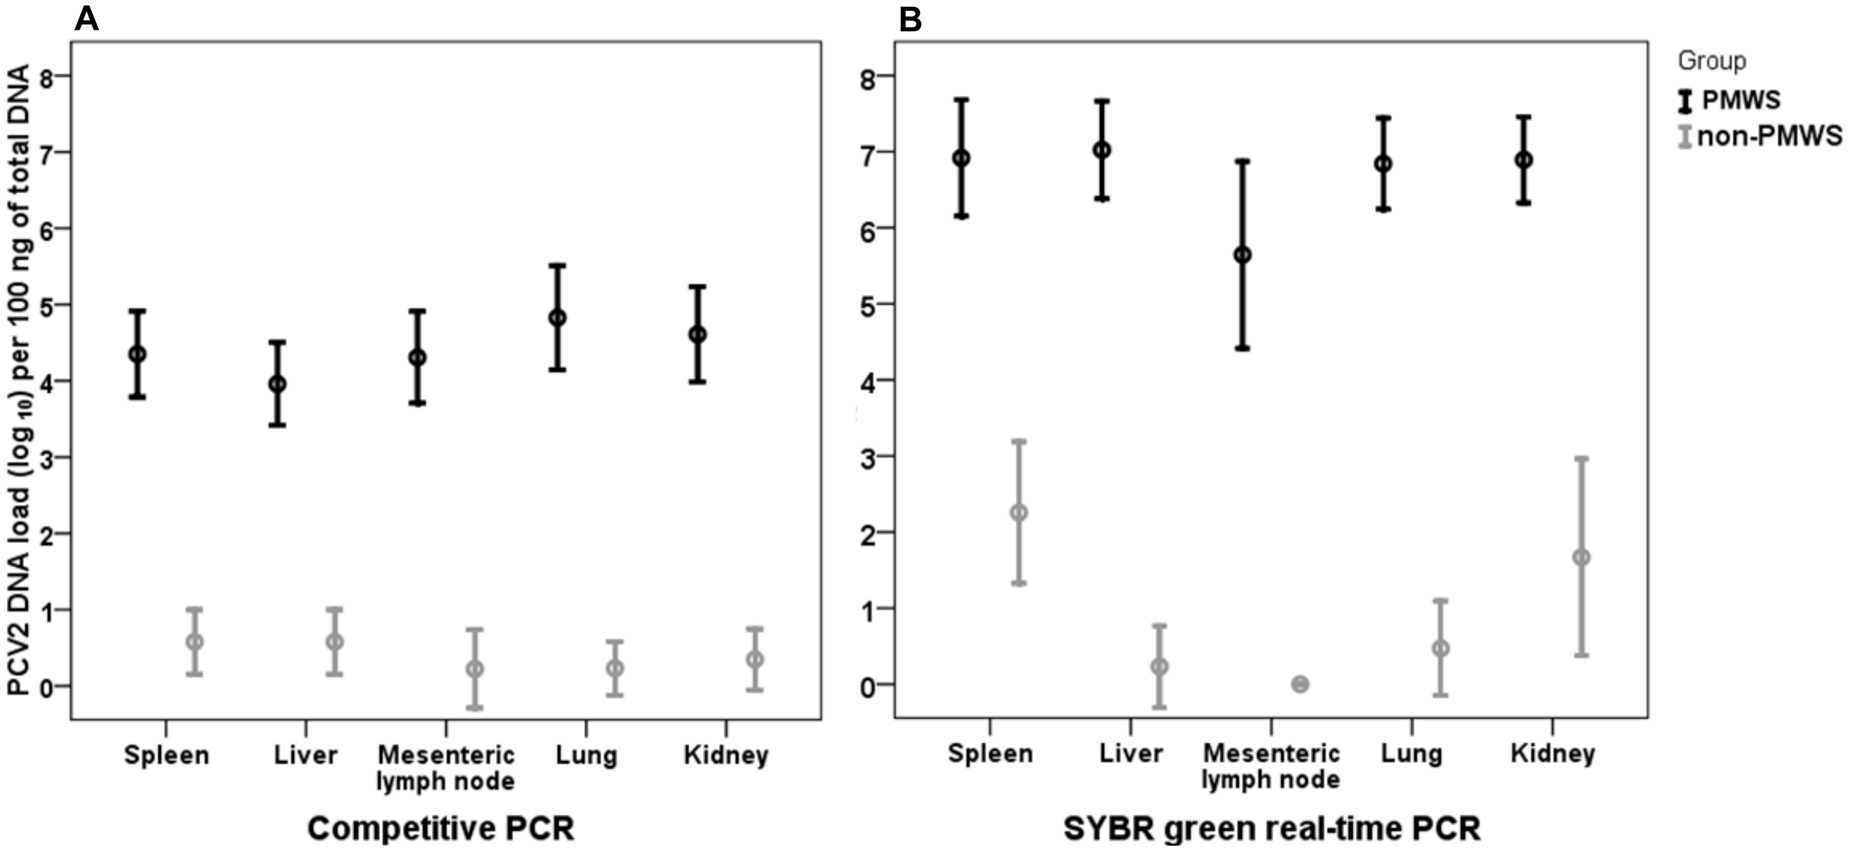
The average PCV-2 DNA load detected by cPCR in the PMWS-affected group ranged from 103.9 to 104.8 per 100 ng of total DNA (Fig. 4A). This was significantly higher than the viral load measured on tissues samples of the non–PMWS-affected group (100.22–100.57 copies/100 ng of sample DNA; P ≤ 0.05). No statistically significant differences were found on amounts of PCV-2 DNA detected in different types of tissues. None of the tissue samples from the non–PMWS-affected pigs had PCV-2 DNA loads greater than 102 copies per 100 ng DNA sample, as determined by cPCR.
Mean values and standard deviations of the number of Porcine circovirus-2 (PCV-2) DNA molecules detected by competitive polymerase chain reaction (cPCR;
Results obtained with the SYBR Green real-time PCR showed that, in the PMWS-affected group, the average PCV-2 DNA loads were significantly higher (106.96 PCV-2 DNA copies/100 ng DNA sample) than in the non-PMWS group (100.92 PCV-2 DNA copies/100 ng DNA sample; Fig. 4B). Within the groups, no statistical differences were detected among the values of PCV-2 DNA copies found in the different types of tissues. An exception was the mean PCV-2 DNA load detected in the spleens of the non-PMWS group, where PCV-2 DNA concentration was significantly higher than in the mesenteric lymph nodes (P ≤ 0.05). None of the sample from the non–PMWS-affected group had a PCV-2 DNA load higher than 104.4 copies per 100 ng of DNA sample.
Comparison of the PCR-based assays
A strongly positive correlation (0.77) was found between the assays, as determined by Pearson correlation coefficient. On the Bland–Altman plot, the results showed that the viral loads detected from SYBR Green real-time PCR were significantly higher than those from cPCR. The mean difference between the assays was 101.8 PCV-2 DNA copies per 100 ng of DNA sample, with limits of agreement being 10-2.0–105.6 (Fig. 5). The prevalence of PCV-2 DNA on the sample was analyzed, and approximately 90% of the samples were positive or negative in both assays (Table 1). Eleven out of the 160 samples analyzed were positive for PCV-2 in SYBR Green real-time PCR but negative in cPCR, whereas the opposite was observed on 4 samples.
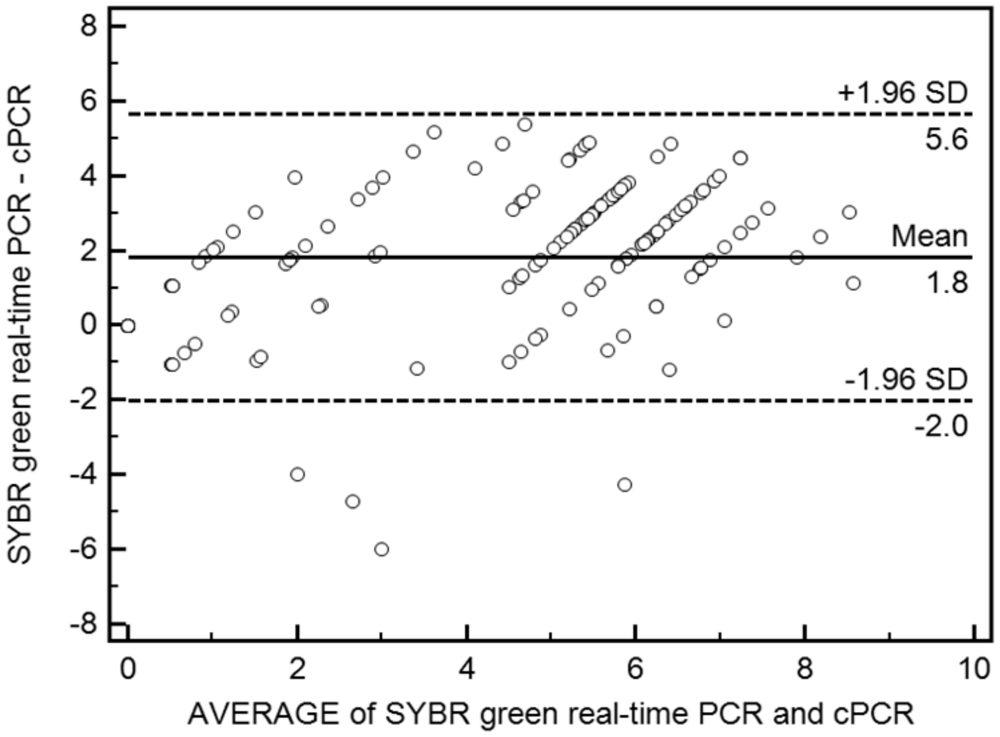
Bland–Altman plot of the differences between Porcine circovirus-2 DNA loads detected by and competitive polymerase chain reaction (cPCR) and SYBR Green real-time PCR. The solid line indicates the mean difference among the paired measurements, and the dashed lines indicate a 95% limit of agreement.
Prevalence and viral loads of Porcine circovirus-2 DNA detected on swine tissue samples using SYBR Green real-time PCR or competitive polymerase chain reaction (cPCR).*
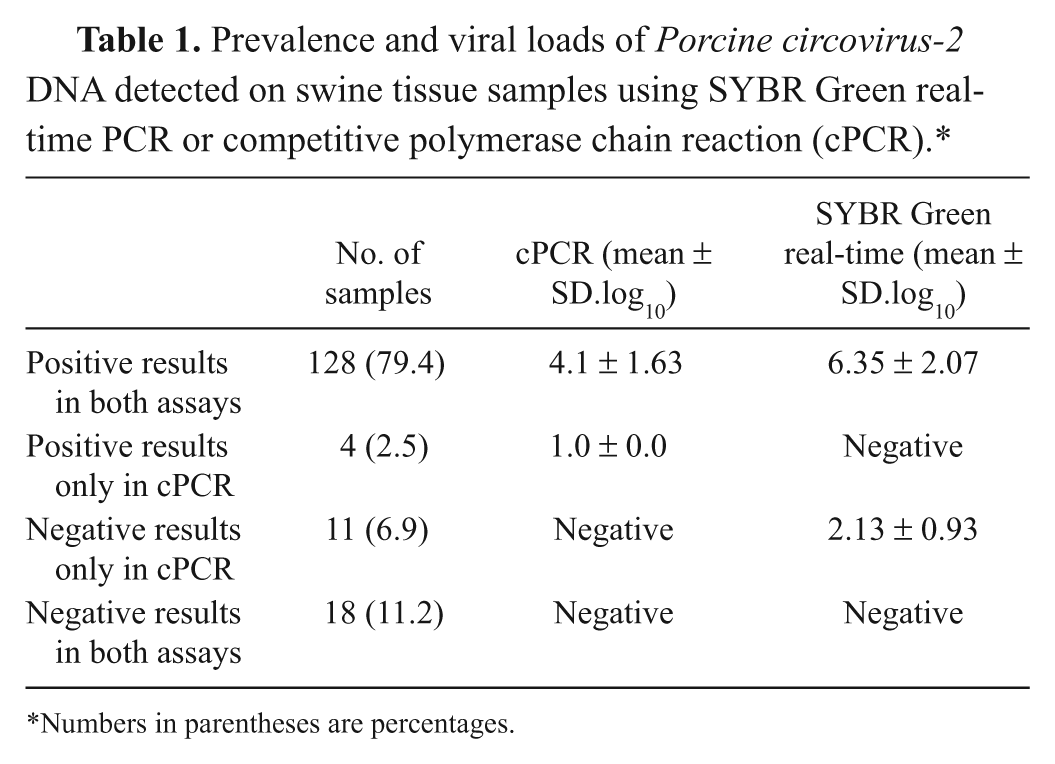
Numbers in parentheses are percentages.
Discussion
In the current study, a cPCR and SYBR Green real-time PCR were developed and compared to establish which of the 2 tests would be more appropriate to quantify PCV-2 DNA in PMWS-suspected pigs. Both methods examined were able to detect significant differences between the viral loads in tissues of PMWS-affected and non-affected pigs. However, the amounts of PCV-2 DNA detected by the cPCR were 101.8 lower than those detected by the SYBR Green real-time PCR. A possible explanation for the difference might be the degree of similarity of the putative binding sites of the primers and the actual nucleotide sequences of the isolates. In comparing 587 PCV-2 genome sequences deposited in GenBank with the primers used with the cPCR (1569R and 1094F) 15 assay, most of the PCV-2 genome sequences display up to 3 mismatches in the binding site for primer 1569R and up to 1 mismatch for primer 1094F. In contrast, the binding sites for the primers developed for the SYBR Green real-time PCR, 1190R and 1127F, were much more conserved; most of the PCV-2 genome sequences displayed up to 1 mismatch for 1190R and no mismatch for 1127F.
Mismatches might alter the amplification performance, resulting in the detection of lower amounts of DNA. 25 It has been shown that 5 mismatches in primers and probe resulted in an underestimation of copy numbers by 1 log10 unit, while a total of 6 mismatches resulted in 2 log10 units underestimation of the copy numbers. 5 A 3–5 log10 difference between perfectly matched primers and 3 mismatches in one primer has been reported in quantitative PCR. 18 Another possible explanation for the different sensitivity detected between the assays is that clinical samples contain contaminants that affect cPCR more than SYBR Green real-time PCR. However, this explanation is unlikely, as the amplification of the competitor DNA was not affected.
In the cPCR developed in the current study, according to the tissue sample analyzed, the detected average varied from 10>3.9 to 104.8 PCV-2 DNA copies per 100 ng DNA sample in the PMWS group. A similar cPCR-based test detected an average of 106.6 copies of PCV-2 DNA in 1 ml of serum from PMWS-affected pigs, 17 which is equivalent to 105.3 copies per100 ng DNA sample. Therefore, the detected viral load of the cPCR employed in the present study was approximately 3–25-fold lower than that achieved in a prior study. 17 This difference between the 2 cPCR assays may be due, inter alia, to different sensitivities of the methods, the stage of the disease, or the type of sample used in the assays.
SYBR Green real-time PCR detected higher mean amounts of PCV-2 DNA in PMWS-affected (≤107) than in non–PMWS-affected pigs (≤102.3). The differences between groups varied from 2.5 to 4 log10 units, depending on the tissue samples examined (see Fig. 4B). Using a SYBR Green–based real-time PCR19,34 or a TaqMan-based real-time PCR, 5 other authors detected similar viral loads to those reported in the current study with the real-time PCR. A statistically significant difference was found among spleen and mesenteric lymph node from the non-PMWS group, with higher viral loads being detected in the spleen samples. This result suggests that mesenteric lymph node may not be the appropriate sample when monitoring PCV-2 levels in swine herds.
It has been proposed that a threshold of 107 PCV-2 DNA copies per ml serum or 2 × 10⁶ copies per 100 ng DNA sample would be suggestive of PMWS. 5 However, a study comparing 2 routinely used real-time PCR assays found a bias of 101.4 on the PCV-2 DNA copies detected between the assays. 11 These findings revealed that the results of viral load among assays could vary, suggesting that the establishment of the viral load threshold to characterize PMWS should be determined by each particular assay. Variation in the detected PCV load was also observed in the quantitative PCR assays used in the current study. Based on the highest viral load detected in the non-PMWS group in the current study, the suggested viral load thresholds for clinically detectable PMWS are 102 and 104.4 copies of PCV-2 DNA per 100 ng DNA (or 103.3 and 105.7 copies of PCV-2 DNA/500 ng DNA), for cPCR and SYBR Green real-time PCR, respectively.
Other authors have observed that the mean PCV-2 concentration (per gram or ml) was 103 higher in naturally PWMS- affected versus non–PWMS-affected pigs. 19 Therefore, another approach in support of a PMWS diagnosis is to compare DNA viral loads found on samples of PMWS-affected and non–PMWS-affected pigs. Using such criterion, both described assays would allow proper diagnosis, since both methods detected differences of at least 102.5 per 100 ng DNA.
With respect to the decision about which of the 2 assays would be more suitable to support a PMWS diagnosis, SYBR Green real-time PCR has a number of practical advantages. 36 This type of assay is less prone to false-positive results in comparison to cPCR because the risk of contamination is less, as post-PCR manipulation is unnecessary. As well, real-time PCR is less time consuming than cPCR, since no competitive DNA template is necessary, and multiple reaction dilutions as well as electrophoresis analyses are not needed. In addition, SYBR Green real-time PCR was more sensitive than cPCR, indicating that this method amplified the target DNA more efficiently, probably because more conserved primers were used.
In summary, both cPCR and SYBR Green real-time PCR can be applied to discriminate between PMWS-affected and non–PMWS-affected pigs. Either a threshold value for the PCV-2 DNA load or the difference in PCV-2 DNA load between PMWS-affected and non–PMWS-affected pigs could be used for diagnostic purposes. The difference between the assays may not be inherent to the cPCR method and could probably be solved by the use of more conserved primers. Although both methods may thus be used to support a PMWS diagnosis, SYBR Green real-time PCR is preferable because of a number of practical advantages and because it was able to detect higher amounts of PCV-2 DNA copies.
Footnotes
Acknowledgements
The authors thank Dr. David Driemeier, from the Veterinary Faculty, Federal University of Rio Grande do Sul (UFRGS), for providing tissue samples of swine with PMWS. To FAMR, in memoriam.
a.
Gibco BRL, Grand Island, NY.
b.
Sigma-Aldrich, St. Louis, MO.
c.
Vetec, Duque de Caxias, Rio de Janeiro, Brazil.
d.
Promega Corp., Madison, WI.
e.
Invitrogen Corp., Carlsbad, CA.
f.
Synth, Diadema, São Paulo, Brazil.
g.
DNASTAR Inc., Madison, WI.
h.
GE Life Sciences, Piscataway, NJ.
i.
CCL-33 American Type Culture Collection, Manassas, VA.
j.
Eastman Kodak Company, Rochester, NY.
k.
New England Biolabs, Ipswich, MA.
l.
7500 Real-Time PCR System, Applied Biosystems, Foster City, CA.
m.
SPSS Inc., Chicago, IL.
n.
MedCalc, Mariakerke, Belgium.
o.
Fermentas Life Science, Glen Burnie, MD.
The author(s) declared no potential conflicts of interest with respect to the research, authorship, and/or publication of this article.
Financial support was provided by the Conselho Nacional de Desenvolvimento Científico e Tecnológico (CNPq) and by the Financiadora de Estudos e Projetos (FINEP). D. Dezen was in receipt of a scholarship from Coordenação de Aperfeiçoamento de Pessoal de Nível Superior (CAPES). P.M. Roehe is a CNPq 1B research fellow.