
Abstract
An optimized culture method for detection of infection of fish with the Red spotted grouper nervous necrosis virus (RGNNV) genotype of betanodavirus in striped snakehead (SSN-1, Channa striatus) cells is described. Inoculation of fish tissue homogenates at the same time or within 4 hr of seeding the SSN-1 cells was as sensitive as the method recommended by the World Organization for Animal Health, where homogenates were adsorbed onto an established cell monolayer. Such modification halved the time required and the costs of consumables, and reduced the potential for error when processing large numbers of samples. Positive culture results were obtained from 88.3% of 392 fish tissue homogenates in which RGNNV was detected using a quantitative reverse transcription polymerase chain reaction (qRT-PCR) assay; 99.7% of 943 tissue homogenates, which were qRT-PCR negative, were cell culture negative. Cytopathic effect (CPE) was characterized by large intracytoplasmic vacuoles in 0.1–60% of cells. Detachment of affected cells from the culture surface resulting in progressive disruption of the monolayer occurred in 46.4% of primary cultures and 96.0% of subcultures of positive samples. Identification of CPE that did not disrupt the cell monolayer increased estimates of the 50% tissue culture infective dose (TCID50) by 1.07–2.79 logs (95% confidence interval). The predicted mean TCID50/ml was 3.3 logs higher when cells were inoculated less than 36 hr after subculture at less than 80% confluence compared to cells inoculated at greater than 80% confluence and more than 36 hr after subculture (P < 0.05).
Introduction
Viral nervous necrosis (VNN) disease of fish is caused by infection with viruses of the genus Betanodavirus, family Nodaviridae. 27 Outbreaks of VNN are characterized by neurological dysfunction with up to 100% mortality, and have been recognized in the culture of more than 30 species of fish throughout the world. 26 Betanodavirus was first cultured in the striped snakehead (SSN-1, Channa striatus) cell line, which contains a mixed cell population derived from Ophicephalus striatus larvae, a freshwater fish native to Southeast Asia. 11,12 The SSN-1 cells were successfully cultured at incubation temperatures between 15°C and 30°C, 3 and were shown to be permissive for growth of isolates representing 4 different genotypes of betanodavirus. 17 The World Organization for Animal Health (OIE) recommended virus isolation in SSN-1 cells, or the clonally derived E-11 cell line, to identify subclinical infection or to declare freedom from infection with betanodaviruses. 35
The OIE-recommended virus isolation procedure requires adsorption of a filtered tissue homogenate onto an established cell monolayer. 35 If cytopathic effect (CPE) is not observed during a 10-day incubation period at 20–25°C, the samples are subcultured by adsorption of the cell culture supernatant (CCSN) onto a freshly prepared cell monolayer. Identification of betanodavirus using an antibody-based antigen detection method or a reverse transcription polymerase chain reaction (RT-PCR) assay is undertaken if CPE is observed in the cell cultures. Several variations of the recommended method have been reported to improve the reliability of virus isolation, including inoculation without adsorption, 13 incubation of cells at temperatures other than 20°C or 25°C, 14 and shearing SSN-1 cells using a 25-gauge needle, 4 or freezing and thawing cultures before subculture. 20
The difficulties of isolation of betanodavirus have stimulated research on molecular detection by RT-PCR, but validation of these methods relies on virus isolation. Poor interlaboratory repeatability of virus isolation assays may explain why comparisons of the analytical sensitivity of virus detection by culture with virus detection by RT-PCR assays have widely different reported outcomes. 18 The aim of the current study was to optimize and standardize an assay for isolation of betanodavirus by culture in SSN-1 cells so that it could be applied efficiently to large numbers of fish tissue samples. A further aim was to optimize a quantal assay to determine the 50% tissue culture infective dose (TCID50) in SSN-1 cells.
Materials and methods
Culture of SSN-1 cells
The SSN-1 cells were maintained in 25-cm2 cell culture flasks a with Leibovitz-15 cell culture medium with L-glutamine b (L-15) supplemented with 2% fetal bovine serum c (FBS) and 1% v/v of a solution containing 10,000 IU/ml penicillin sodium, 10,000 µg/ml streptomycin, and 25 µg/ml amphotericin B in 0.85% saline d (antibiotic/antimycotic). The cells were subcultured every 7 days by harvesting using a cell scraper e and preparing a cell suspension in L-15 medium supplemented with 10% v/v FBS (L-15 growth medium). The culture vessels were reseeded with 10 ml of a suspension containing 1 × 10⁵ SSN-1 cells/ml, and the medium was exchanged with L-15 supplemented with 2% FBS after 2 days. Cells used in virus isolation and titration assays were propagated in 175-cm2 flasks, without a medium exchange until they were 90% confluent.
Isolates of betanodavirus
The viral isolates indicated in Table 1 were obtained using SSN-1 cells in 25-cm2 cell culture flasks according to the method described by the OIE. 35 When CPE affected approximately 60% of cells in first passage cultures, the flasks were subjected to a freeze–thaw cycle at –20°C and then room temperature, and the CCSN were collected. The CCSN was clarified by centrifugation at 1,000 × g for 5 min, titrated (see below), and the virus stocks were stored at –80°C. The isolates were identified as betanodavirus 48 hr after inoculation onto SSN-1 cells in 12-well plates using a previously described immunostaining test. 24 Isolates LcNNV_09/07 and MnNNV_12/06, which were used for optimization of the virus isolation assay, belonged to the RGNNV genotype (GenBank reference nos. GQ402010, GQ402011, GQ402012, and GQ402013).
Description of the fish tissue samples and isolates of betanodavirus that were used to assess the optimized virus isolation assay in the current study.*
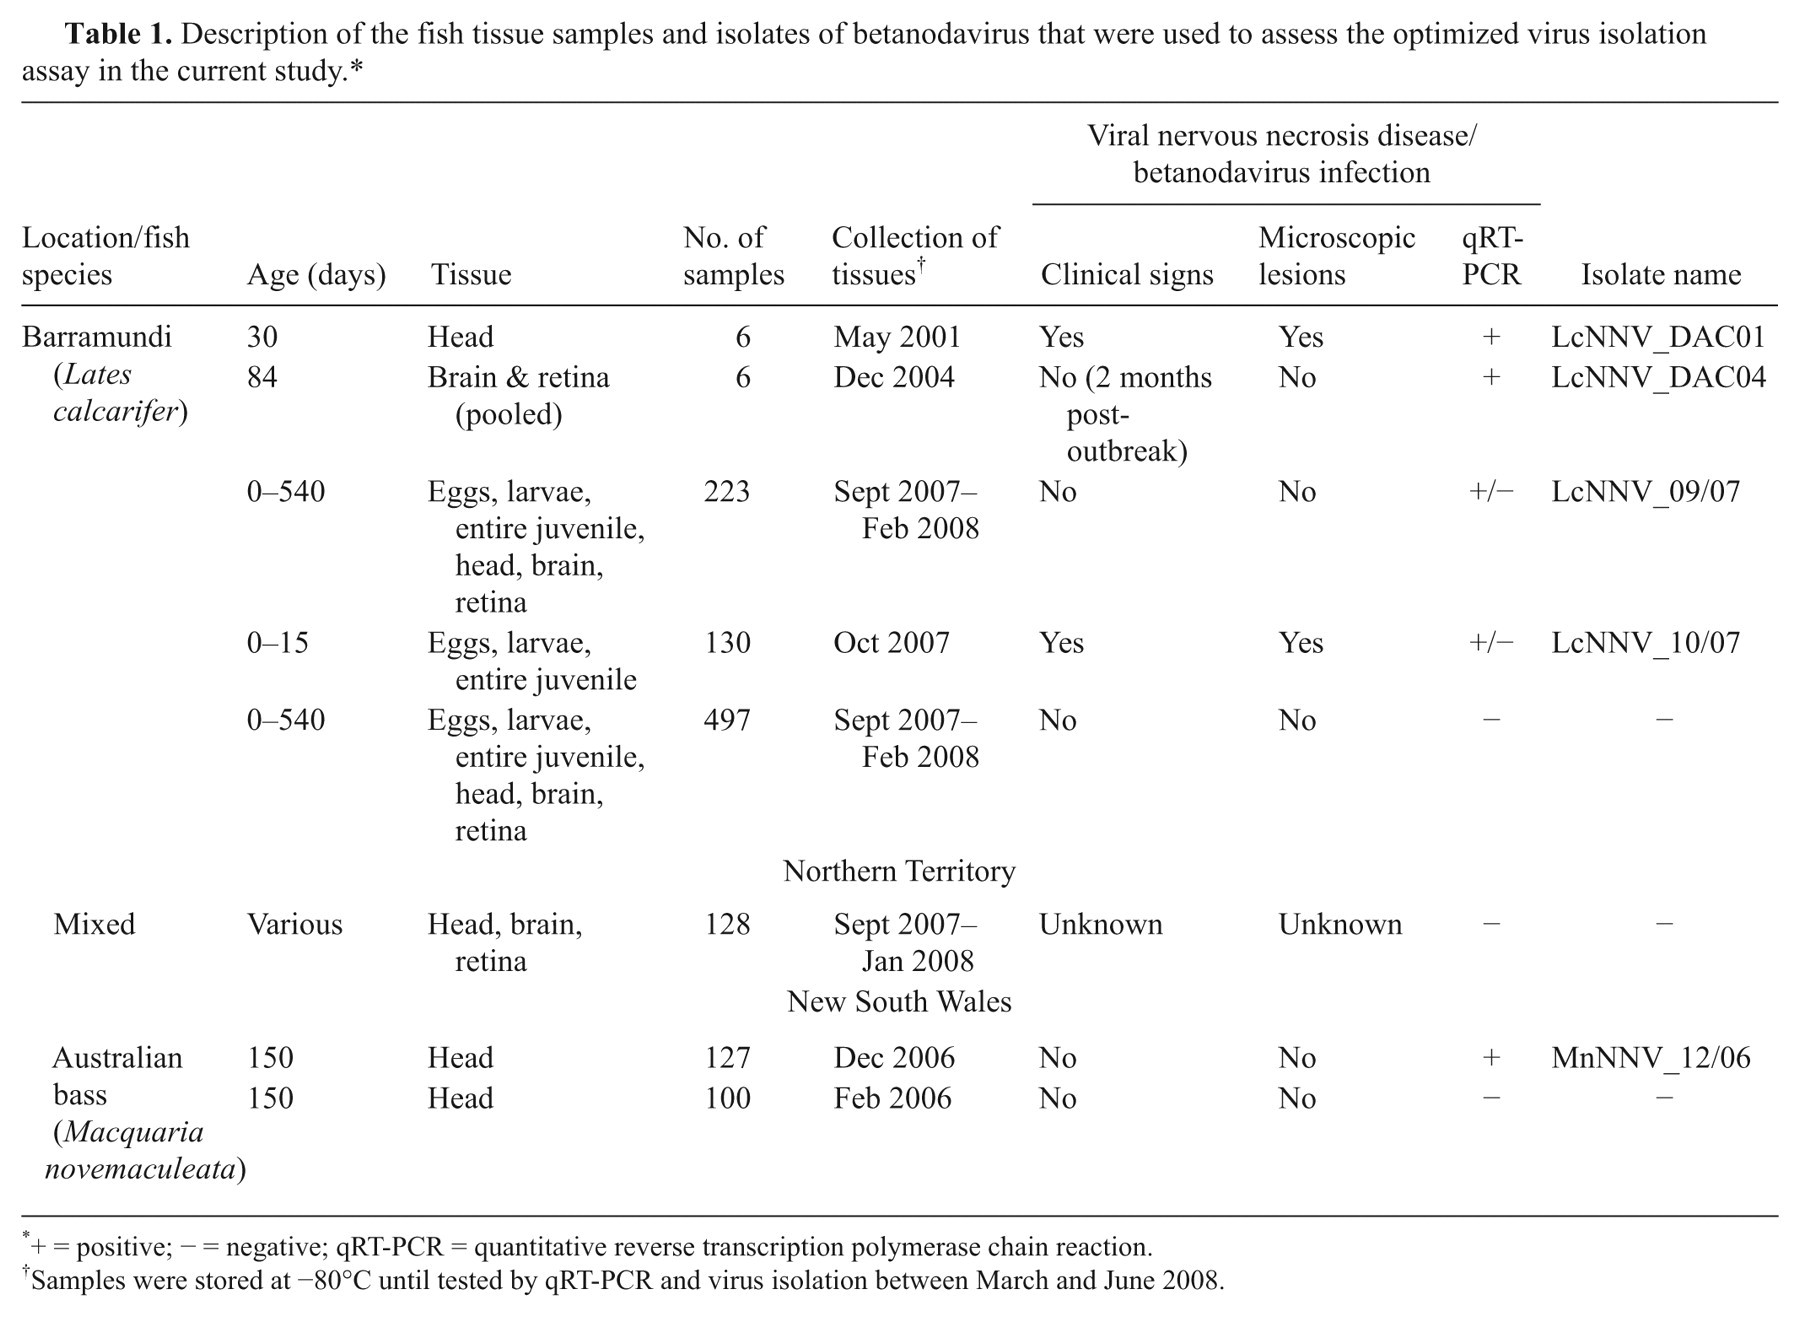
+ = positive; − = negative; qRT-PCR = quantitative reverse transcription polymerase chain reaction.
Samples were stored at −80°C until tested by qRT-PCR and virus isolation between March and June 2008.
Fish tissue
An additional 1,217 fish tissue samples were used to assess the optimized virus isolation assay, including many samples from fish with subclinical betanodavirus infection (Table 1). Of these samples, 392 were positive and 825 were negative when assessed using a quantitative (q)RT-PCR assay. 16 The tissues included 0.1 g pools of eggs or larvae, individual, or entire juvenile fish as well as the brain and retinae of larger fish, all of which were stored at –80°C immediately after collection. Tissues were disrupted by manual pestle grinding or by microbead beating to prepare a 1:10 w/v tissue homogenate in L-15 medium supplemented with 2% v/v antibiotic–antimycotic. Both these methods were compatible with culture of betanodavirus. 15 Tissue homogenates were centrifuged at 10,000 × g for 5 min at 4°C. The supernatants were passed through a 0.2-µm syringe-driven filter f to produce a clarified tissue homogenates (CTH), and multiple aliquots were stored at −80°C. A separate aliquot of each sample was tested by virus isolation within 3 months of tissue disruption and within 1 month of testing by the qRT-PCR assay.
Optimization of virus isolation
Incubation temperature
Twelve-well cell culture plates a were seeded with 1.8 ml per well of a suspension containing 1 × 10⁵ SSN-1 cells/ml in L-15 growth medium and incubated at 25°C. When the monolayer reached about 80% confluence, cells were inoculated by addition of 200 µl of L-15 medium containing 103 TCID50 units of the isolate LcNNV_09/07 or MnNNV_12/06 to each well. Plates were then sealed with a sterile adhesive plate sealer g and incubated at 15°C, 20°C, 25°C, or 30°C. The CCSN from duplicate wells was collected each day for 8 days after cells were scraped into the culture medium and dissociated by repeated pipetting.
Inoculation method
Twenty-four-well cell culture plates were seeded with 1.5 ml per well of a suspension containing 2 × 10⁵ SSN-1 cells/ml in L-15 growth medium. A 10-fold dilution series of the isolate LcNNV_09/07 or MnNNV_12/06 was prepared in the range 104–10−1 TCID50 units in 150 µl of L-15 medium, and each dilution was inoculated using one of the following 3 methods. 1) Inoculation onto a monolayer: One hundred and fifty µl of inoculum was added to the culture medium when SSN-1 cells were 80% confluent. 2) Inoculation with adsorption: When the cell monolayer was 80% confluent, the culture medium was removed. The 150 µl of inoculum was added and incubated for 1 hr. The cell monolayer was washed by addition of 1.5 ml of phosphate buffered saline, before addition of 1.5 ml of fresh L-15 growth medium. 3) Inoculation at the time of seeding: One hundred and fifty µl of inoculum was added to the SSN-1 cell suspension at the time of its addition to the culture vessel, or within 4 hr. The plates were incubated at 25°C for 7 days after inoculation. The plates were frozen and thawed before the CCSN was collected after mixing by pipetting.
Degree of cell association of virus
The SSN-1 cells in 12-well cell culture plates were inoculated by addition of 103 TCID50 units of the isolate LcNNV_09/07 or MnNNV_12/06 to the L-15 medium. Each day the cells and culture medium were collected separately from duplicate wells according to the following methods. 1) The culture medium was aspirated and centrifuged at 10,000 × g for 5 min at 4°C, and the supernatant was stored at −80°C. Any cells in the culture medium were collected by re-suspending the pellet in 100 µl of L-15 medium. 2) The SSN-1 cells were washed with 0.5 ml of L-15 medium, which was removed by gentle pipetting, and centrifuged at 10,000 × g for 5 min at 4°C. The supernatant was pooled with the medium collected in method 1 above, and any cells were collected by re-suspending the pellet in 100 µl of L-15 medium. 3) The SSN-1 cells were detached from the plastic surface with a cell scraper and collected in 0.5 ml of L-15 medium. These cells were pooled with cells recovered from methods 1 and 2 above. The cell suspension and the cell-free culture medium were stored at –80°C.
Optimization of end-point titration
Ninety-six-well cell culture plates were seeded with 150 µl per well of a suspension containing 1 × 10⁵ or 4 × 10⁵ SSN-1 cells/ml in L-15 growth medium. Such technique allowed inoculation of cells with different degrees of monolayer confluence between 12 and 72 hr postseeding. The cells were inoculated by addition of 50 µl per well of a 10-step, 10-fold dilution series of the isolate LcNNV_09/07 or MnNNV_12/06 in L-15 medium. Each dilution was replicated in 8 wells, and 8 negative control wells were inoculated with L-15 medium. Each well was observed for CPE at 7 days and 10 days postinoculation and the titer (TCID50) was calculated according to the method of Reed and Muench. 32 The optimized assay required plates seeded with a cell suspension containing 4 × 10⁵ SSN-1 cells/ml. Dilutions of the sample to be titrated were inoculated after overnight incubation (14–16 hr), and the titer was determined 10 days postinoculation.
Detection and quantification of betanodavirus using a quantitative RT-PCR assay
Nucleic acids were purified from 50 µl of CTH or CCSN using a viral RNA purification product h with a magnetic particle processor. i Betanodavirus was detected and quantified using the qR2T assay. 15 Samples were tested in duplicate using 5 µl of purified nucleic acids in 25-µl reactions prepared using a commercial single step qRT-PCR kit. j Thermocycling and fluorescence data acquisition was performed for plates of 96 reactions. k A serial 10-fold dilution series containing 107–101 copies of linear plasmid DNA (pLcNNV_RNA2) was amplified in duplicate on each plate. The number of complementary DNA copies of the betanodavirus capsid protein gene (RNA2) detected in the experimental samples was interpolated from the standard curve as previously described. 16
Optimized virus isolation assay
Primary culture
Twenty-four-well cell culture plates were seeded with 1.5 ml per well of a suspension containing 2 × 10⁵ SSN-1 cells/ml in L-15 growth medium. Samples were inoculated in duplicate by addition of 150 µl of clarified tissue homogenate to the culture medium within 4 hr of seeding the cells. Control assays included in each plate were 2 wells inoculated with homogenizing medium, 2 wells that were not inoculated, and 2 wells inoculated with 103 TCID50 units of the isolate LcNNV_09/07. Plates were sealed, incubated at 25°C, and examined microscopically every day for 7 days.
Passage
The plates were frozen at −20°C and allowed to thaw at room temperature 7 days postinoculation. Cell debris and culture medium was mixed by repeated pipetting and was retained as CCSN. Freshly subcultured SSN-1 cells were seeded into 24-well plates as described for the primary culture and were inoculated by addition of 150 µl of CCSN within 4 hr of seeding. Samples that exhibited CPE in the primary culture were inoculated by addition of 1:10 and 1:100 dilutions of CCSN in L-15 medium into duplicate wells; samples that did not exhibit CPE in the primary culture were inoculated by addition of undiluted CCSN into duplicate wells. Passage was repeated after 7 days for samples in which CPE was not evident in the first passage culture. Second passage cultures were observed each day until 10 days postinoculation.
Interpretation of results
Samples that did not exhibit CPE at any time in primary, first or second passage cultures were defined to be negative. Samples that caused CPE in the primary or subsequent cultures were defined to be positive if CPE was observed after passage of both dilutions of the CPE affected CCSN. Betanodavirus was confirmed as the cause of CPE by testing CCSN by qRT-PCR. Changes in cell morphology were attributed to tissue toxins if there was no evidence from qRT-PCR that betanodavirus had replicated. Samples that caused toxic changes were retested after diluting CTH 1:10 and 1:100 v/v in L-15 medium.
Statistical analysis
Titration and qRT-PCR quantification data for optimization experiments were log transformed and assessed for normality using a Shapiro–Wilk test (P < 0.05). General linear modeling with incubation temperature, viral isolate, method of inoculation, and inoculation dose included as factors was conducted using a statistical software package. l Where a factor or interaction was determined to be significant, it was retained in the model (P < 0.01). A least squares method was used to compare means based on a Bonferroni correction (p < 0.05).
Results
Growth and morphology of SSN-1 cells at different temperatures
The SSN-1 cells had a spindle shape immediately post-seeding but matured into an epithelial cell shape. Cells were pleomorphic and 2–5% had small intracytoplasmic vacuoles and dark inclusions, which were no larger than the cell nucleus (Fig 1A). When incubated at 25°C, a monolayer of cells covered approximately 80% of the culture surface in 24-well plates at 48 hr after seeding with 2 × 10⁵ cells/ml. Cells incubated at 30°C began to detach from the substrate and lift in sheets from day 6, leaving an intact monolayer in only 53.1% of cultures 8 days postseeding (n = 48). When incubated at 15°C, the cells did not grow into a confluent monolayer, and many had a granular appearance.
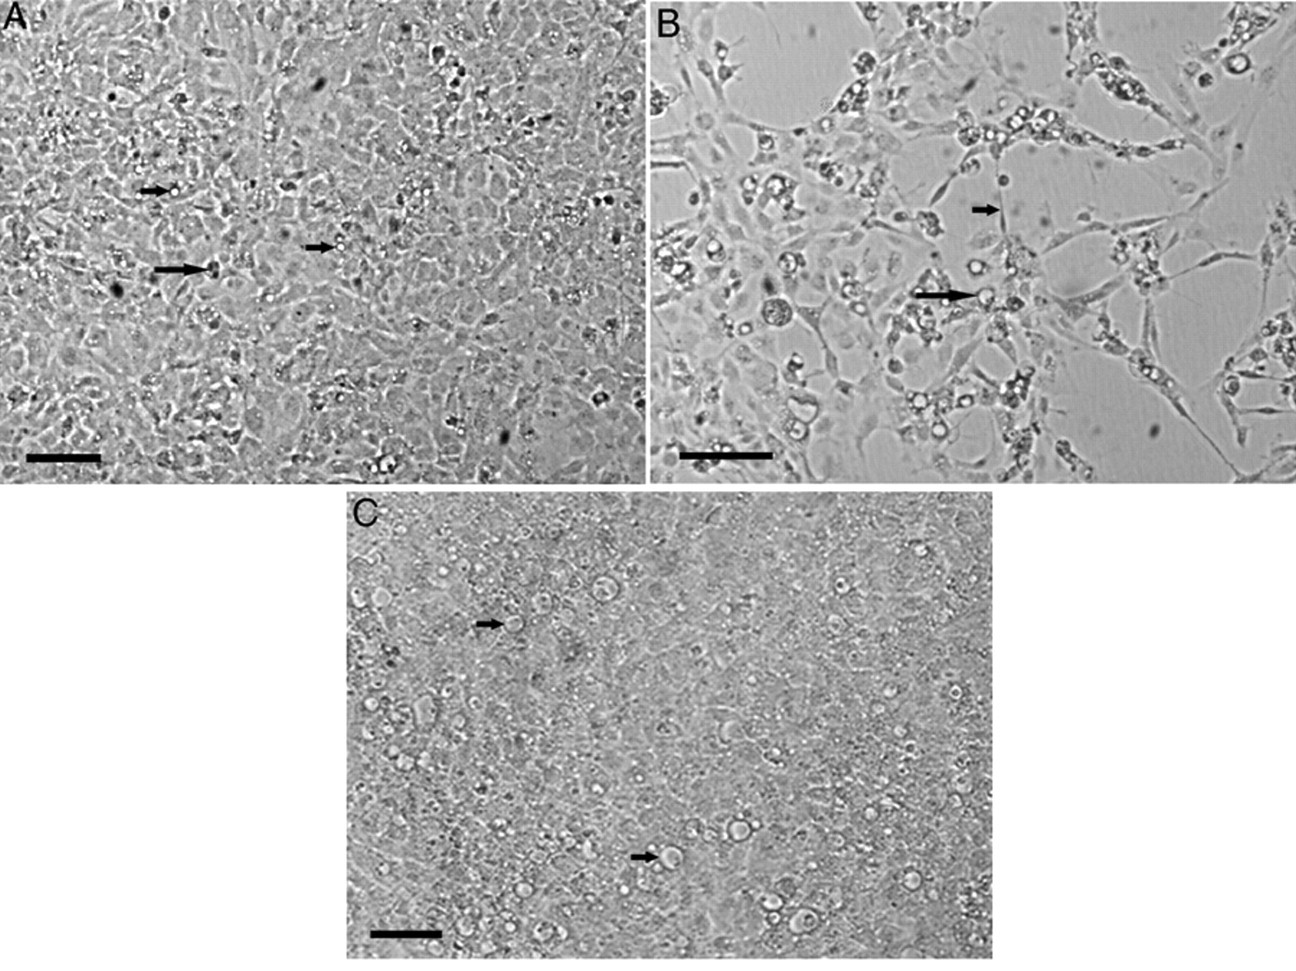
The appearance of striped snakehead fish (SSN-1) cells incubated at 25°C, 7 days postinoculation with fish tissue.
Morphology of striped snakehead cells infected with betanodavirus
Each of the 5 isolates listed in Table 1 were positive for betanodavirus when tested by immunostaining and caused CPE characterized by large clear vacuoles in the cytoplasm of some cells. These vacuoles were distinguished from those in control cells by their size, being at least as large as the nucleus of the cell. Two distinct patterns of morphological changes to the SSN-1 cells were observed with the optimized virus isolation assay and were defined as CPE based on evidence from qRT-PCR that betanodavirus had replicated: 1) large vacuoles with disruption of the cell monolayer, and 2) large vacuoles in an intact cell monolayer.
When CPE disrupted the cell monolayer, the appearance of large vacuoles was preceded by the appearance of granular cells with dark spindle-shaped projections of the cytoplasm (Fig. 1B). The affected cells aggregated and detached from the plastic surface causing progressive disintegration of the monolayer in a lacework pattern. This pattern of CPE was observed after passage of 334 out of 392 (85.2%) qRT-PCR positive CTH samples that were tested using the optimized virus isolation assay. However, disruption of the cell monolayer occurred in the primary culture for only 182 (46.4%) of these samples (Table 2).
Observation of cytopathic effect and results of quantitative reverse transcription polymerase chain reaction assays for fish tissue sample tested using the optimized virus isolation assay.*
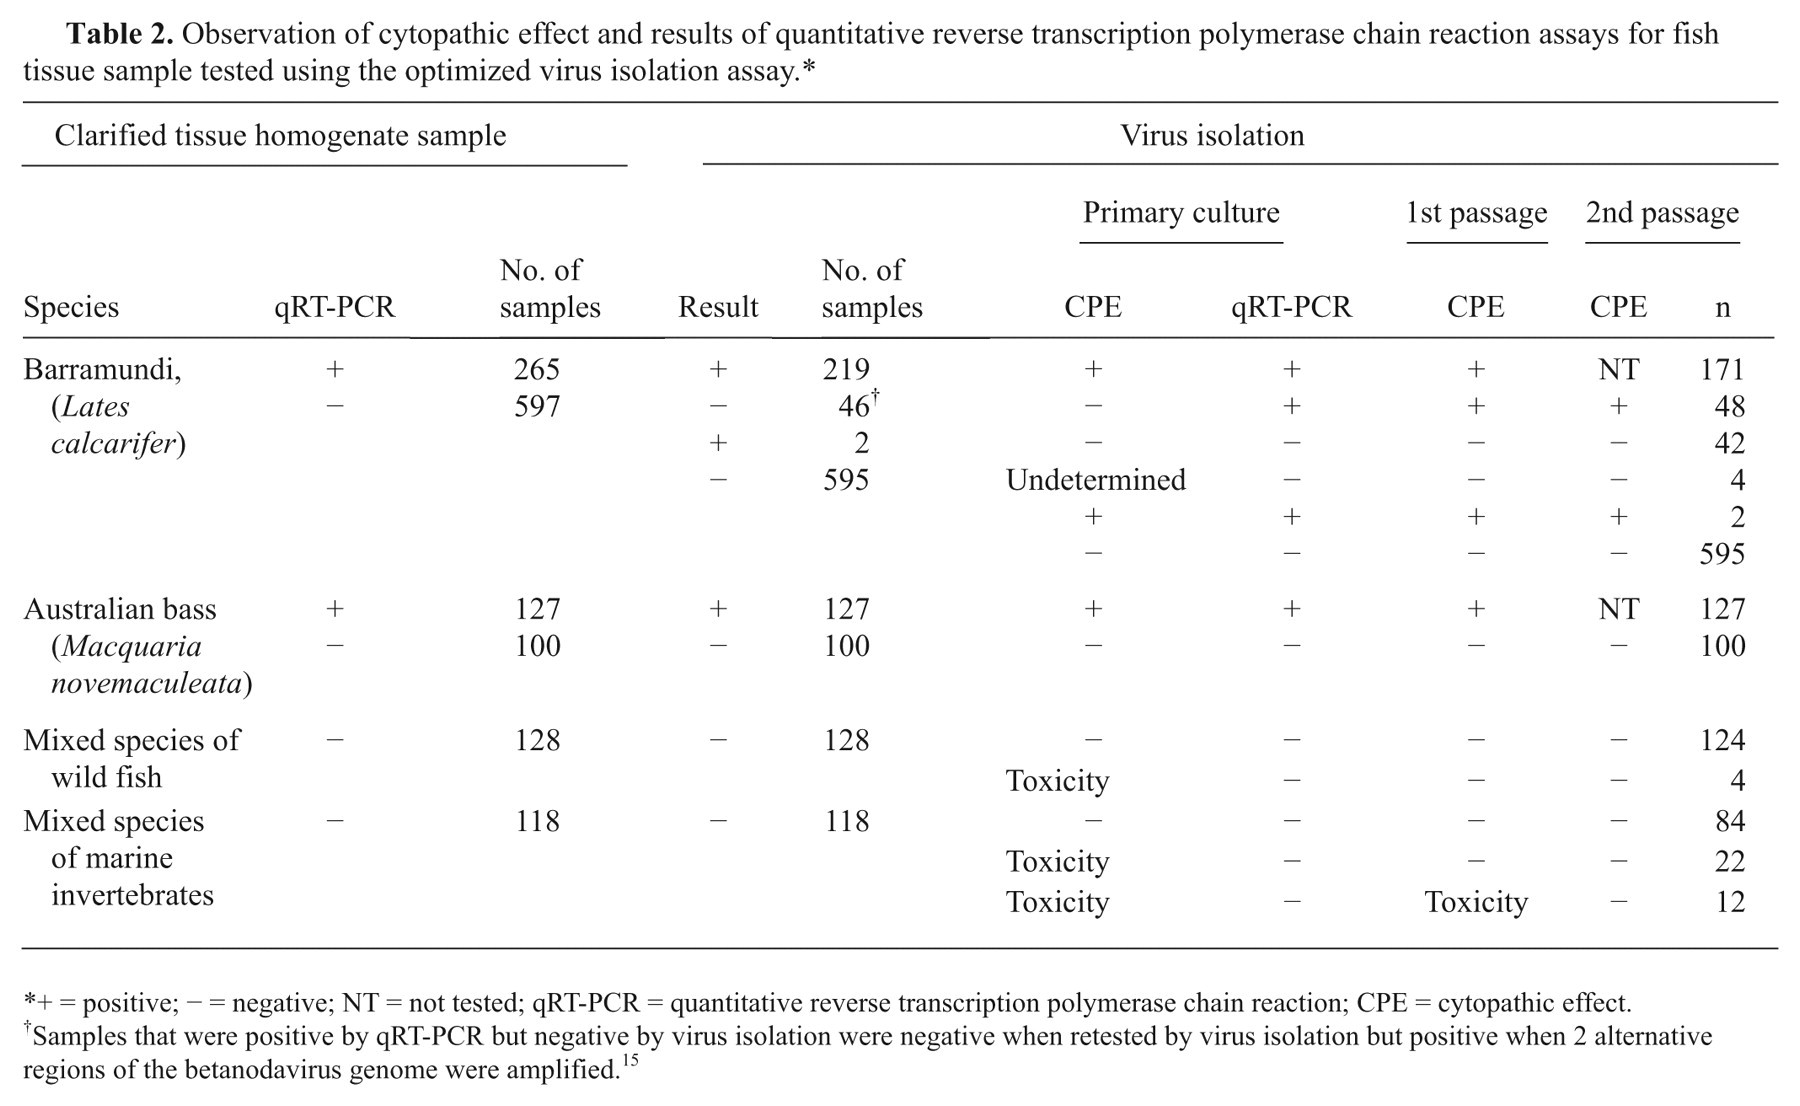
+ = positive; − = negative; NT = not tested; qRT-PCR = quantitative reverse transcription polymerase chain reaction; CPE = cytopathic effect.
Samples that were positive by qRT-PCR but negative by virus isolation were negative when retested by virus isolation but positive when 2 alternative regions of the betanodavirus genome were amplified. 15
During optimization experiments with inoculation of ≤10 TCID50 units of betanodavirus, a pattern of CPE was observed whereby vacuoles developed in some cells, but the cell monolayer grew to 100% confluence and did not disintegrate after the appearance of cells with large vacuoles (Fig. 1C). The abundance of cells with large vacuoles at 7 days postinoculation varied between a single cell per well and 60% of cells. The CPE did not progress, and the monolayer remained intact when incubation of these samples was continued for 14 days (n = 24). Using the optimized virus isolation assay, large vacuoles in an intact cell monolayer was observed in the primary culture of 36.9% of qRT-PCR–positive samples.
The cell culture supernatant from all primary and first passage cultures, in which either form of CPE was observed, was positive for betanodavirus when tested using the qRT-PCR assay (n = 784). Positive results in qRT-PCR assays were also obtained from all CPE negative primary cultures, which produced CPE after passage (n = 48).
Cytotoxic changes characterized by granular inclusions in the cytoplasm of cells and aggregation of cell debris which was detached from the plastic surface were observed in 4 out of 825 primary cultures inoculated with qRT-PCR–negative samples from fish, and 22 out of 118 primary cultures inoculated with CTH from marine invertebrates (Table 2). Cytotoxicity resolved after passage of these samples and was distinguished from CPE by qRT-PCR.
Factors affecting viral growth in 96-well plates
Markedly different titers were obtained when plates were prepared with suspensions of 1 × 10⁵ or 4 × 10⁵ cells/ml to enable inoculation of cells at different times postseeding and at different degrees of confluence (Table 3). The predicted mean TCID50/ml using cells inoculated less than 36 hr after subculture and at less than 80% confluence was 3.3 logs higher than when cells were inoculated at greater than 80% confluence and more than 36 hr after subculture (P < 0.05). The titer of betanodavirus estimated 10 days postinoculation was 0.12–0.72 logs (95% confidence interval [CI]) higher than when the same samples were observed at 7 days post-inoculation (n = 46). Viral titers calculated based on observation of any cells with large vacuoles were 1.07–2.79 logs (95% CI) higher than when calculated based on observation of vacuolated cells and a disrupted cell monolayer (P < 0.01, n = 18).
Comparison of the 50% tissue culture infective dose (TCID50) of betanodavirus determined by end-point titration when the striped snakehead fish (SSN-1) cells were inoculated at different times postseeding and with different confluence.*
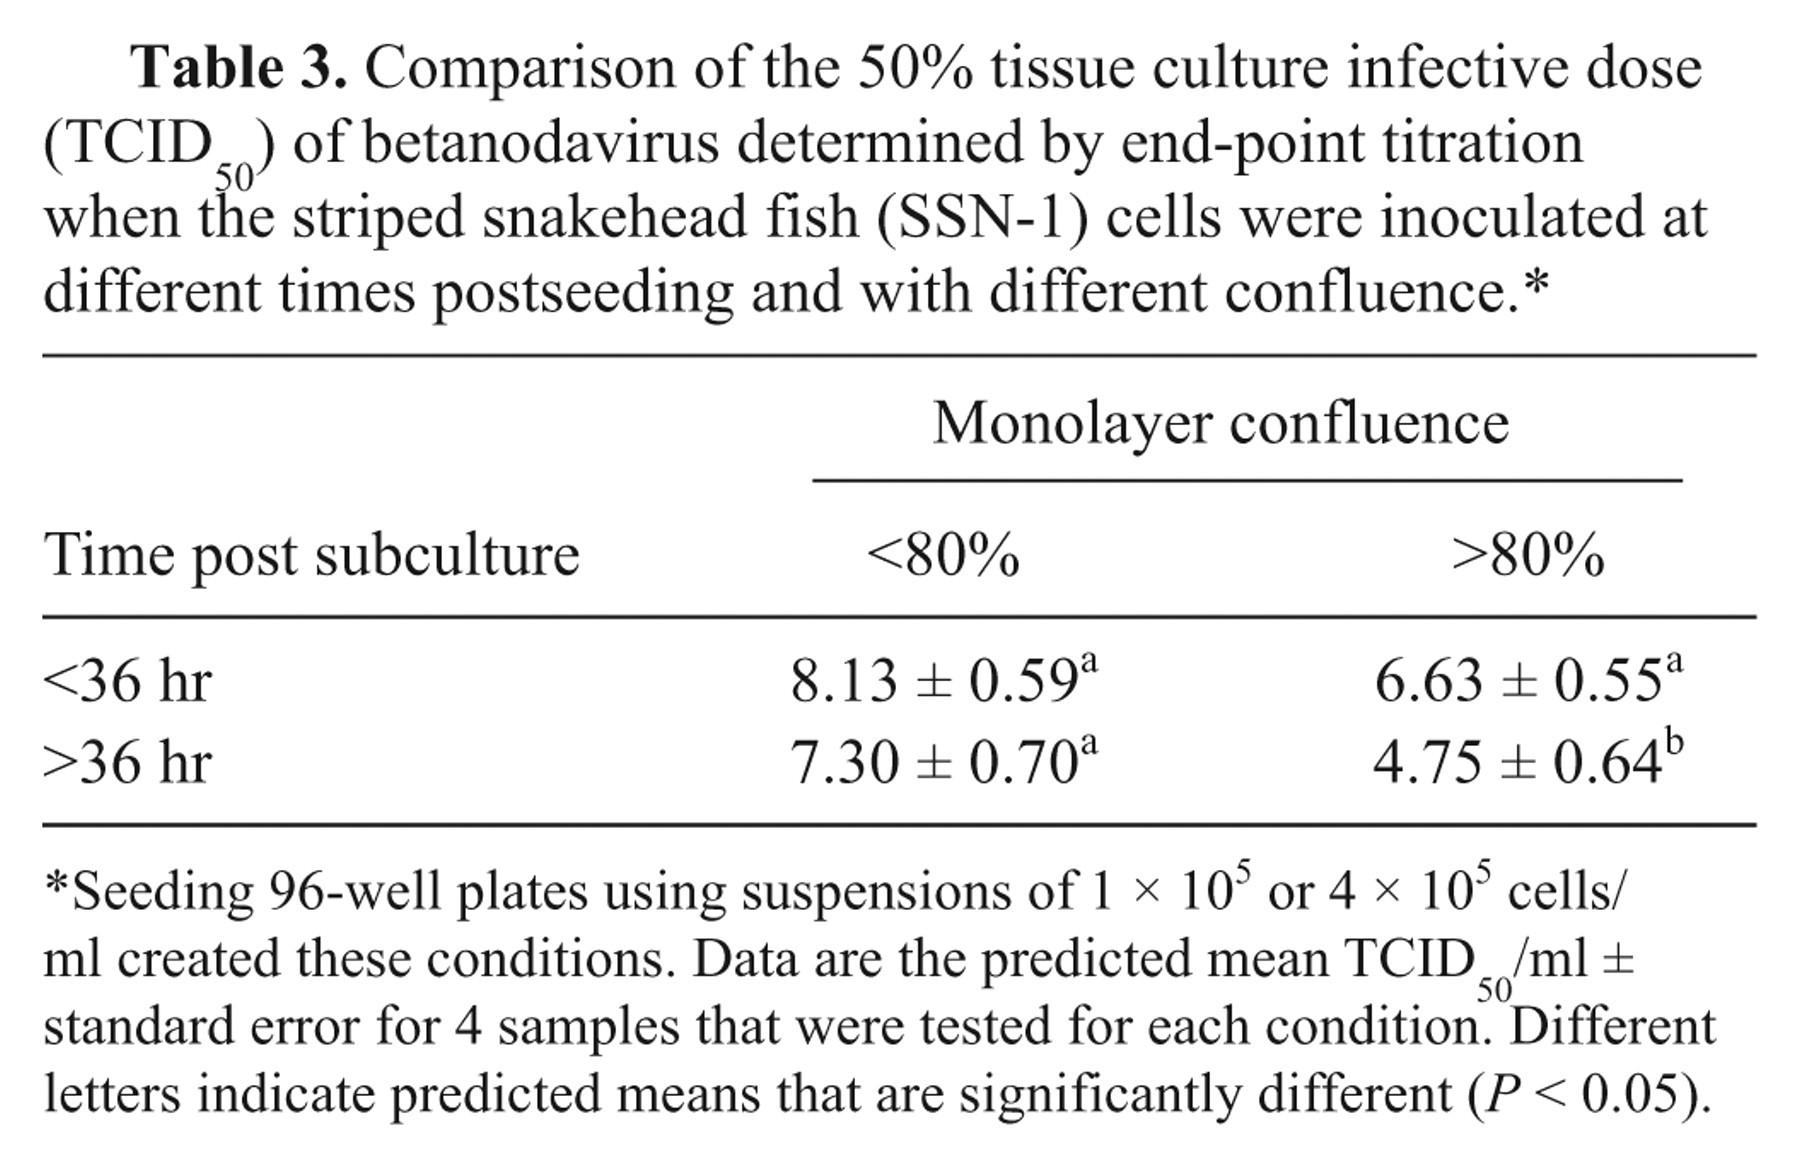
Seeding 96-well plates using suspensions of 1 × 10⁵ or 4 × 10⁵ cells/ml created these conditions. Data are the predicted mean TCID50/ml ± standard error for 4 samples that were tested for each condition. Different letters indicate predicted means that are significantly different (P < 0.05).
Optimization of virus isolation in 24-well plates
Incubation temperature
After accounting for the effect of clustering due to the viral isolate (i.e., sample effect), CPE became evident 0.9 days sooner at 25°C compared to 20°C, and 0.8 days sooner at 30°C compared to 25°C (P < 0.01). The rate at which the titer increased over 8 days of incubation was similar at 20°C and 25°C (Fig. 2A). The apparent lower predicted rate of growth over 8 days at 30°C (slope = 0.27) reflected a declining titer between days 6 and 8, which corresponded to advanced disruption of the cell monolayers. The peak titer at 30°C was reached 6 days post-inoculation, and was 1.0 log higher than the maximum reached at 25°C (P < 0.01). However, there was no difference in the maximum number of RNA2 copies, or the number present 7 days post-inoculation at 25°C or 30°C (Fig. 2B). The titer did not increase throughout 8 days of incubation at 15°C (Fig. 2A).
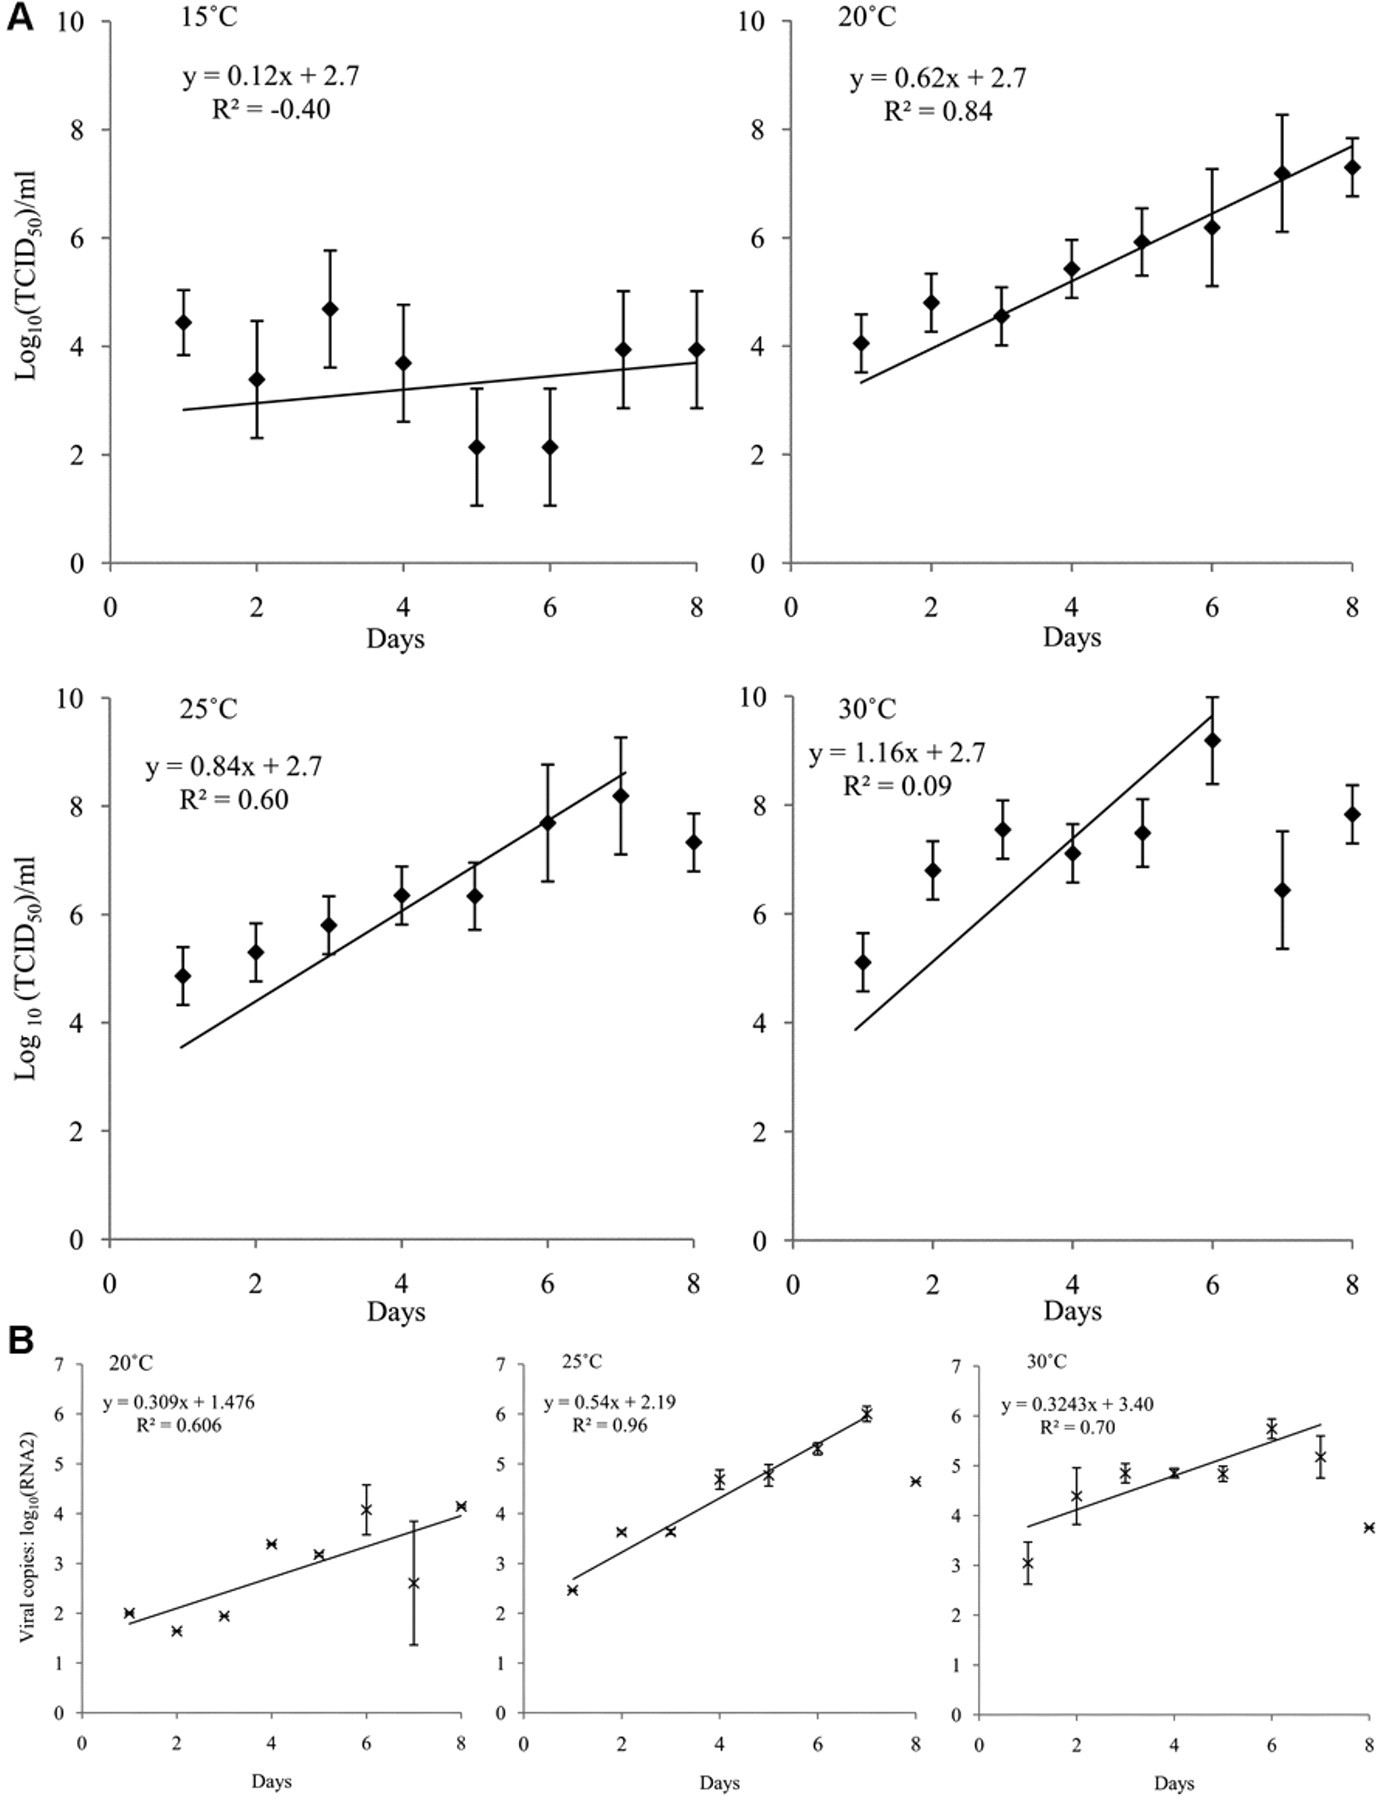
Growth curves for betanodavirus in striped snakehead (SSN-1) cells at 4 different incubation temperatures. Betanodavirus was quantified in the combined culture medium and cell fraction each day after inoculation of SSN-1 cells in 12-well cell culture plates with 103 50% tissue culture infective dose (TCID50) units of the isolates LcNNV_09/07 or MnNNV_12/06.*
Inoculation method
The CPE was evident after 7 days of incubation in all wells inoculated with ≥10 TCID50 units, but differences were seen with lower inoculation doses. The CPE occurred more frequently for samples containing the isolate MnNNV_12/06 compared to samples of the isolate LcNNV_09/07 (P < 0.01), but the method of inoculation did not affect the proportion of cultures, which developed some form of CPE (Fig. 3A). However, after accounting for the effect of sample and dose, inoculation by adsorption resulted in CPE appearing as large vacuoles with disruption of the monolayer 5.16 times more frequently compared to inoculation with seeding (Fig. 3B). Similarly, CPE became evident sooner when cultures were inoculated by adsorption compared to inoculation at seeding, but only when the inoculation dose was ≤10 TCID50 units (Fig. 3C). The number of RNA2 copies present after 7 days was not affected by the initial dose of virus (P = 0.11), but the quantity of viral RNA was 3.9 times higher in cultures inoculated at seeding compared to inoculation with adsorption (Fig. 3D).
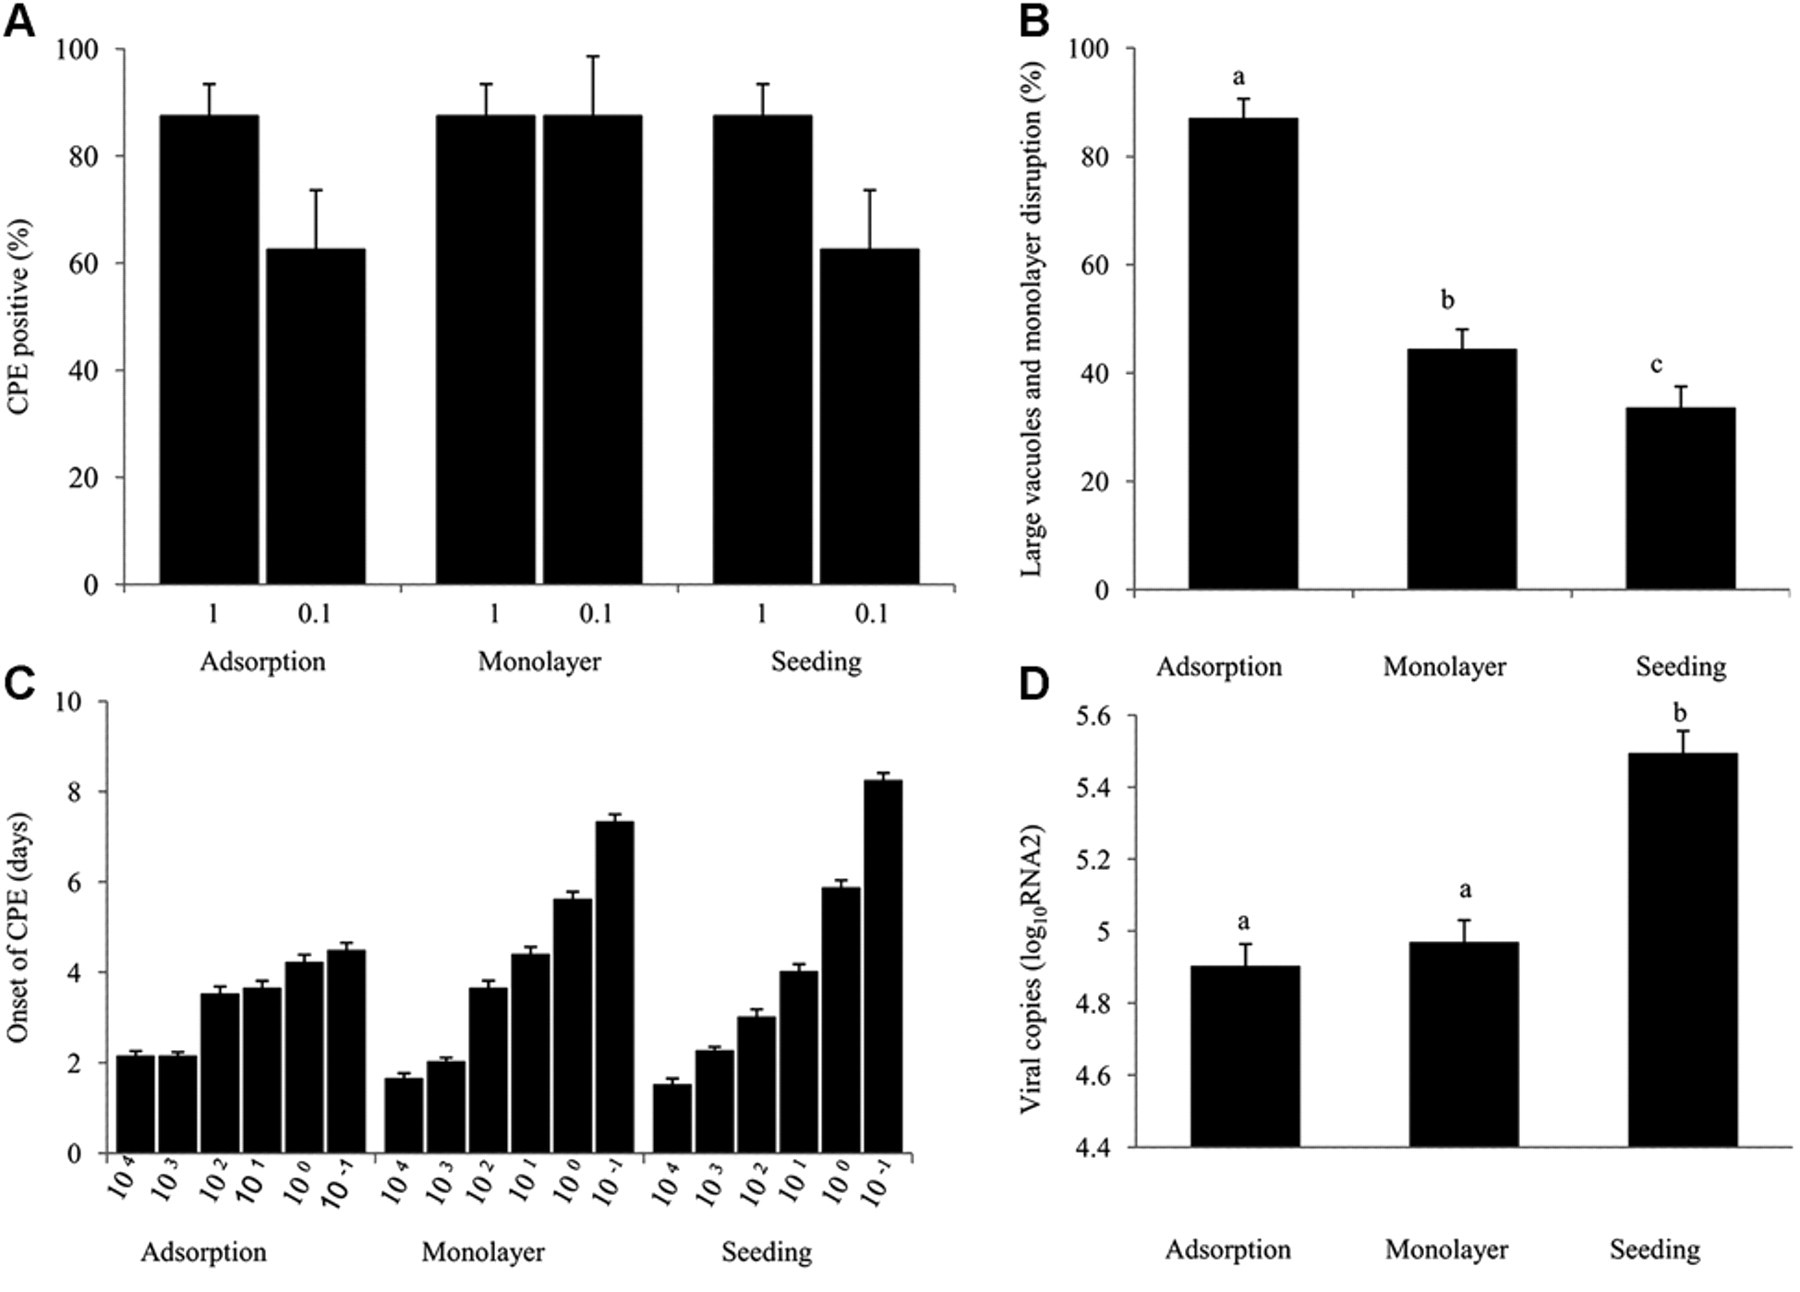
The effect of the inoculation method on development of cytopathic effect (CPE) in striped snakehead (SSN-1) cell cultures infected with betanodavirus was determined using the isolates LcNNV_09/07 or MnNNV_12/06.*
Association of betanodavirus with cells
The yield of virus was higher in the cell fraction compared to the supernatant of the culture medium until >70% of the cells were affected by CPE (Fig. 4). The end-point titer was 1.33 logs higher in the cell fraction compared to the culture medium, when CPE affected 30% of cells, indicating that greater than 90% of the viral load was cell-associated. This highlights the importance of cell lysis and mixing of the CCSN before passage.
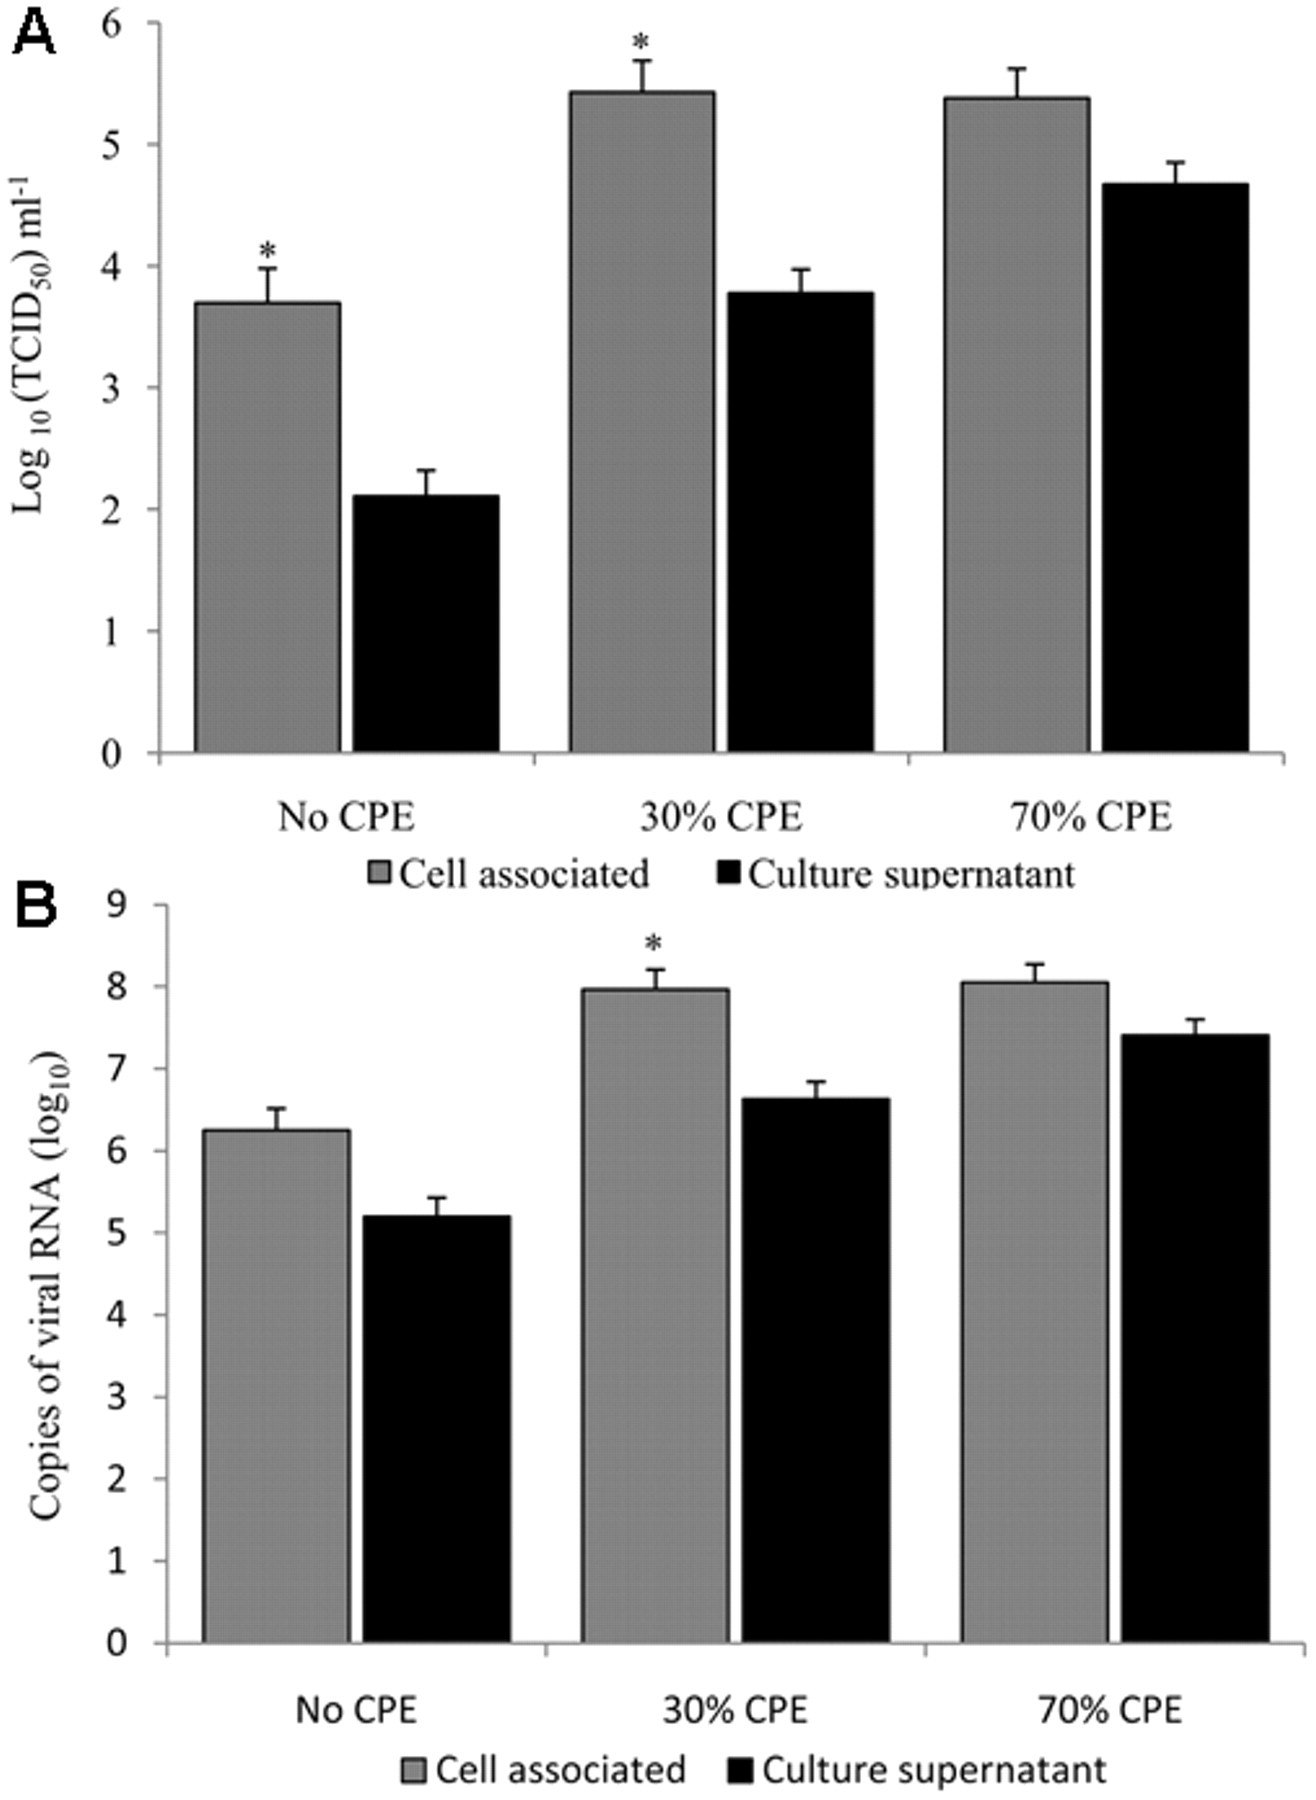
The proportion of cell-associated betanodavirus was determined by separating the striped snakehead (SSN-1) cell fraction from the culture medium and quantifying the virus when cytopathic effect (CPE) was absent, affecting 30% of the cells and affecting 70% of cells.
Optimized virus isolation assay
Virus isolation was positive for 88.3% of the 392 tissue homogenates which were positive in the qRT-PCR assay. The CPE did not become apparent until after passage of 13.9% of these samples, but the CCSN from the primary cultures of all these samples were positive when tested using the qRT-PCR assay. All 46 tissue homogenates, which were positive using the qRT-PCR assay but virus isolation negative, were brain or retinal tissues, which had been stored for less than 12 months prior to testing. The samples were from populations in which infection was subclinical, and small amounts of viral RNA were detected (2.5 ± 1.2 log10 RNA2 copies/g). Samples from the same populations, which were treated in the same way, but from which virus isolation was successful, contained 0.6 logs more RNA2 per gram of tissue (n = 125, P < 0.01). Virus isolation was negative for 99.8% of the 943 tissue homogenates, which were negative for betanodavirus when tested directly using the qRT-PCR assay.
Discussion
The optimized protocol for isolation of betanodavirus in SSN-1 cell culture was likely to be more sensitive than the method described by the OIE, which permits variation at many stages of the process that were found to be important determinants of assay sensitivity. The relatively simple, standardized procedure described in the current study minimized the variation, which is inherent in the use of cell culture techniques, and is desirable to improve repeatability over time and between laboratories. Standardization of virus isolation is essential for interlaboratory repeatability and for evaluation of new diagnostic tests. In some studies, the sensitivity of culture in SSN-1 and E-11 cells was higher than single step or nested RT-PCR for detection of dilutions of cell culture grown virus. 5,18 However, in other studies, virus isolation in SSN-1 cells was 104 times less sensitive than a nested RT-PCR assay, 7 and failed to detect betanodavirus in fish tissues, which were positive with nested RT-PCR. 28 Virus isolation was also less sensitive compared to several real-time molecular detection methods. 6,13,33 It is unclear whether optimized protocols for virus isolation were used in any of these studies.
The optimized method was procedurally convenient which was advantageous for processing large numbers of samples. Inoculation of cultures at the time of seeding the SSN-1 cells into the tissue culture plates provided the same analytical sensitivity, but required less time and laboratory consumables compared to inoculation with adsorption. In addition, the potential for erroneous results arising from cross contamination, physical damage, or infectious agents was reduced. Disruption of cells using a freeze–thaw cycle and mixing of cell debris and culture medium prior to subculture was used to maximize viral detection in the subcultures because at least 90% of the infective virus was cell-associated.
The current study used isolates of RGNNV, which is the only genotype known from Australia, and a dominant genotype in temperate and tropical waters, globally. 25 Both isolates proliferated most rapidly in SSN-1 cells incubated at 30°C, despite being obtained from Australian bass (Macquaria novemaculeata) and barramundi (Lates calcarifer) hosts, that were maintained in aquaculture at 20°C and 30°C, respectively. Incubation of the SSN-1 cells at 25°C was preferred to 30°C because there was less variation in cell morphology and the monolayers were more likely to remain intact for 7 days. Other isolates of RGNNV have proliferated at 20°C, 25°C, and 30°C, although one particular isolate was reported to cause CPE in SSN-1 cells only at 25°C. 3,17 Isolates from betanodavirus genotypes other than RGNNV have demonstrated different temperature preferences and propensity for cultivation in SSN-1 cells. 8,17,20
The current study and others have shown that infection of SSN-1 cells with isolates from the RGNNV genotype induced a CPE characterized by large vacuoles in the cytoplasm and partial or complete disintegration of the monolayer in a meshwork pattern. 3,12,17 However, progression of CPE resulting in disruption of the cell monolayer did not always occur, most likely due to low multiplicity of infection associated with the tissues of subclinically infected fish. Identification of CPE in the pleomorphic SSN-1 cells was previously recognized to be subjective, 8 and potentially contributed to the imprecise measures of viral titer obtained by observation of CPE in microtiter plates. 13,19 Failure to develop clearly expressed CPE was largely resolved by passage onto fresh SSN-1 cells. A standardized measure of viral infectivity is required for standardization of inocula for experimental infection trials. For example, an infectious dose of 105 TCID50/ml by bath exposure caused mortality in barramundi larvae 4 days post exposure, but in another experiment the same dose and exposure method resulted in mortality after 15 days. 10,29 Interpretation of such results is complicated because a different cell line and titration method was used to measure viral infectivity. The method described herein allows sensitive enumeration and is relatively easy to perform as a standardized protocol.
Several fish in the current study were identified as subclinically infected by testing their tissues with qRT-PCR, but were negative when tested by virus isolation. It could not be confirmed if this was due to the presence of viral nucleic acid in the absence of infectious virions, or if the sensitivity of virus isolation was lower than that of qRT-PCR. It was unlikely that these were false-positive qRT-PCR results because 3 different targets within the betanodavirus genome were amplified, 16 which is a recommended method for verification of PCR results. 9 The sensitivity of virus isolation is affected by dynamic interactions between SSN-1 cells, betanodavirus and probably also by other components of the tissue samples. For example, the titer was altered by 3-logs when the average age of cells and the multiplicity of infection was altered by inoculating cells at different times post-seeding and degrees of monolayer confluence (Table 3). It is possible that betanodavirus replication may be inhibited in cultures when small quantities of virus are present due to induction of the innate immune responses of SSN-1 cells. For example, increased expression of myxovirus resistance protein inhibited proliferation of betanodavirus in grouper cell lines. 23,34 Further, during derivation of the E-11 clone, cells with differential susceptibility to betanodavirus infection were identified within the SSN-1 cell population. 19 Selection pressure favoring the growth of resistant cells within a culture is another potential mechanism for inhibiting betanodavirus proliferation.
Several cell lines derived from grouper (GF-1, GS), barramundi (SISE), and SAF-1 cells from the gilthead sea bream (Sparus auratus) provide alternatives to SSN-1 cells for isolation of betanodavirus. 1,2,21,22,30,31 High titers of RGNNV have been produced with these cells, but their suitability for use in a diagnostic assay has not been assessed in multiple laboratories. Widely and unconditionally available cell lines which can be sourced from a common, authenticated seed stock are more desirable for assays used for diagnostic and regulatory purposes. This ensures the identity of the cells, that they are unaffected by phenotypic drift resulting from excessive subculture, and that they are free from infection with Mycoplasma.
Isolation of RGNNV in SSN-1 cells enabled sensitive detection of infectious betanodavirus in subclinically infected fish, and qRT-PCR provided a rapid and convenient method of confirming betanodavirus as the cause of CPE. Quantification of betanodavirus in fish tissues by qRT-PCR was favored because the procedure was more rapid, less technically demanding, and provided a wider response range compared to titration in cell culture. 16 Nevertheless, detection and enumeration of infectious betanodavirus by isolation in cell culture remains an essential tool for development of improved disease control measures. Further studies are recommended to optimize cell culture for the other betanodavirus genotypes.
Footnotes
Acknowledgements
Barramundi and Australian bass were obtained with the assistance of staff at the Darwin Aquaculture Centre and Port Stephens Fisheries Centre. R. Maurer provided technical assistance.
a.
Cell culture flasks and multi-well plates, BD Falcon, Bedford, MA.
b.
Leibozitz-15 cell culture medium with L-glutamine, Gibco, Grand Island, NY.
c.
Fetal bovine serum, JRH Biosciences, Lenexa, KS.
d.
Antibiotic-antimycotic 100X, Gibco, Grand Island, NY.
e.
Cell scraper, Greiner Bio-one, Frickenhausen, Germany.
f.
0.2 µm syringe-driven filter unit, MiniSart, Sartorius, Göettingen, Germany.
g.
Sterile adhesive plate sealer, Axygen Scientific, Union City, CA.
h.
MagMax-96 Viral RNA Isolation Kit, Ambion, Austin TX.
i.
MagMAX Express-96 magnetic particle processor, Applied Biosystems, Foster City, CA.
j.
QuantiTect virus one-step qRT-PCR kit, Qiagen, Valencia, CA.
k.
MX3000p Multiplex Quantitative PCR system, Stratagene, La Jolla, CA.
l.
Minitab statistical software, Minitab Inc., State College, PA.
The authors declared that they had no conflicts of interest with respect to their authorship or the publication of this article.
The present study was funded by the Commonwealth Government of Australia through the Australian Research Council, and by the University of Sydney and the Northern Territory Government.