
Abstract
The aim of the current study was to evaluate total serum protein concentration measured by the biuret reaction as well as albumin and globulin protein fractions determined by agarose gel electrophoresis. These data were used to establish reference intervals in dairy cows of different ages. Blood was collected from 111 clinically healthy Modicana dairy cows by means of jugular venipuncture. Reference intervals (mean ± standard deviation) were determined for total protein (67.54 ± 11.53 g/l), albumin (31.86 ± 4.60 g/l), α1-globulin (5.77 ± 2.20 g/l), α2-globulin (5.84 ± 1.90 g/l), β-globulin (7.46 ± 1.94 g/l), and γ-globulin (16.73 ± 4.54 g/l) concentrations as well as for albumin/globulin (A/G) ratio (0.88 ± 0.43). Values from 2-, 3-, 4-, 5-, and 6-year-old cows were compared statistically. One-way analysis of variance showed age-related differences for α-globulin and β-globulin fractions only. The results of the current study provide reference intervals for total protein concentration as well as albumin and globulin protein fractions in 2- to 6-year-old dairy cows.
Keywords
Electrophoresis is a standard method for evaluating fractions of serum proteins in clinical biochemistry. As the electrophoretic mobility of serum proteins differs with species, 7 it is essential that the “normal” electrophoretic pattern of each species is determined and that species-specific reference intervals are developed. Reference values include fluctuations observed in healthy populations or individuals and are used to identify abnormalities in patient laboratory data. 4 Serum protein electrophoresis (SPE) basically differs only in the support media used. In veterinary medicine, acetate cellulose (AC) has been replaced by agarose gel support medium, which provides higher reproducibility of results and greater clarity of the electrophoretic pattern.
The number of fractions separated by SPE varies both with the species and with the type of support medium used. The actual number of protein fractions in cow serum is variable. Bovine SPE has been studied using cellulose acetate 8 and agarose gel support media. 9 A previous study 8 has reported 4 fractions obtained by SPE of cow serum, including albumin and α-, β-, and γ-globulins. In contrast, another study 9 reported the separation of cow serum into 7 protein fractions, including albumin and α1-, α2-, inter–α-, inter–β-, inter–β1-, inter–β2-, and inter–γ-globulin fractions. Previous densitometric methods were unable to resolve all of the visible protein bands because of limitations in instrument sensitivity and variation in protein staining.
The agarose gel electrophoresis system, with densitometer and computer software, is the best method to use to clinically resolve protein fractions. Reference values for serum agarose electrophoresis from a large number of cows under standardized conditions have not been reported. Furthermore, a recent study 5 on bovine hematology reference intervals showed that these values have changed over time as a result of genetic and environmental factors. To maximize the diagnostic value of serum protein electrophoresis, it is essential for clinical laboratories to have access to well-established species-, age-, and gender-specific reference intervals. Because serum protein values may change depending on the electrophoretic support method used, 6 the aim of the current study was to quantify serum protein fractions using agarose gel electrophoresis to establish reference intervals in dairy cattle of different ages.
The present study was conducted on Modicana cows, an indigenous breed from Ragusa in the south of Sicily (latitude 36°55′45″N, longitude 14°42′41'W). All housing and care conformed to the standards recommended by the Guide for the Care and Use of Laboratory Animals and Directive 86/609 CEE. Blood samples were obtained from 111 cows in mild lactation (100-150 days postpartum). All cows were clinically healthy, free from internal and external parasites, aged between 2 and 6 years, and weighed 440 ± 17 kg. Their health status was evaluated based on rectal temperature, heart rate, respiratory profile, appetite, fecal consistency, and hematologic profile. Routine care included treatment for endoparasites twice a year. For statistical analysis, the animals were divided into the following 5 groups based on age: 2-year-old (n = 24), 3-year-old (n = 26), 4-year-old (n = 22), 5-year-old (n = 20), and 6-year-old (n = 19) groups.
Blood samples (10 ml) were collected from the external jugular vein using Vacutainer tubes without anticoagulant. Blood samples were allowed to clot at room temperature (20°C) and were centrifuged at 2,081 × g for 15 min to separate serum. Hemolyzed or lipemic specimens were rejected because of possible interference with the biuret method 12 as well as the possibility that they would produce changes in the electrophoretogram. 11 Serum samples were dispensed into plastic tubes and stored at −20°C until analysis. At the time of analysis, serum samples were thawed at 20°C for 30 min prior to determining protein concentrations.
Total protein concentrations were determined by the biuret method using an automated analyzer. a , b Electrophoresis was performed using a semiautomated agarose gel electrophoresis system, c according to the procedure described by the manufacturer and reported in detail elsewhere. 1 Briefly, 10 μl of each serum sample was applied to numbered sample wells' agarose gel. Each gel could accommodate up to 24 samples. Films were electrophoresed for 28 min at 450 V. After electrophoresis, films were fixed using an automated system, c stained in blue stain acid solution for 10 min, and then dried at 37°C. After destaining in acetic acid and drying completely for 15 min, films were scanned on a densitometer. Using the computer software Phoresis, electrophoretic curves relating quantitative specific protein concentrations for each sample were displayed. All samples were prepared by the same individual, who determined the lines separating fractions in the densitometer tracing. Relative protein concentrations within each fraction were determined as the optical absorbance percentage, and absolute concentrations (g/dl) were calculated using the total serum protein concentration, thus:

The values obtained were multiplied by 10 in order to express protein fraction concentration in grams per liter.
All results were expressed as mean ± standard deviation (SD). Statistical analysis was performed on total serum protein concentrations obtained with the biuret method and protein fractions obtained by SPE. For total and protein fractions, descriptive statistics are provided; references intervals were developed using 2.5 and 97.5 percentiles. The Shapiro–Wilk test was used to assess normality. One-way analysis of variance (ANOVA) was applied to compare age groups (Kruskal–Wallis test), and P values of <0.05 were considered statistically significant. The Bonferroni multiple-comparison test was applied for post hoc comparison. Data were analyzed using the software STATISTICA 7.5. d
Mean values and observed ranges for total protein concentration and relative percentage of protein fractions are reported in Table 1. The total protein concentration ranged from 56.92 to 78.68 g/l (median: 67.80 g/l). In all sera analyzed, albumin and α1-, α2-, β-, and γ-globulin fractions were clearly resolved (Fig. 1). Values of different protein fractions calculated from percentages of area-under-the-curve times the total protein concentration were within reference intervals for the species obtained by cellulose acetate electrophoresis (Table 1). Significant P values (Shapiro–Wilk test) were found for α1-, β-, and γ-globulin fractions and globulin fractions for the albumin/globulin (A/G) ratio, indicating that these results were not normally distributed in the reference population. Therefore, the 2.5 and 97.5 percentiles were calculated instead of using mean and SD to characterize the 95% reference intervals (Table 2). 5
Reference intervals for serum protein concentrations, as determined by agarose gel electrophoresis, in clinically healthy dairy cows and comparison with values reported in the veterinary literature. *
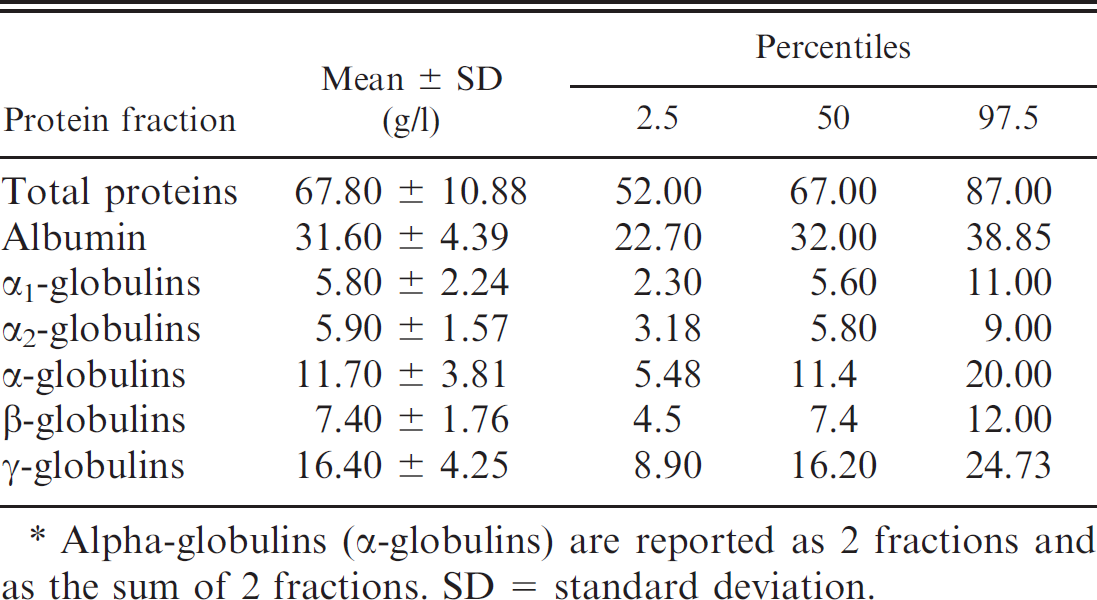
Alpha-globulins (α-globulins) are reported as 2 fractions and as the sum of 2 fractions. SD = standard deviation.
Albumin was easily identified as a thick band, reflecting its high serum concentration, homogeneous electric charge, and high staining affinity. It constituted 47.12% ± 4.09% (mean ± SD) of the total serum protein concentration. Concentrations of albumin were not influenced by age, and similar values were present in all groups. The α1-globulin fraction constituted 8.53% ± 1.31% of the total serum protein concentration and was significantly higher in the 6-year group than in the 4- and 5-year groups (P < 0.05). α2-globulins constituted 8.74% ± 1.91% of the total serum protein concentration, whereas β-globulins constituted 11.05% ± 2.54% of the total serum protein concentration. Effect of age by ANOVA was significant in these fractions (P < 0.05), with higher values in the 6-year group than in the 4- and 5-year groups. The γ-globulin fraction constituted 24.2% ± 5.42% of the serum total protein concentration. Values were slightly lower in the 6-year group compared with the other groups, but the difference was not statistically significant. For the A/G ratio, no effect of age was detected; values were lower in the 6-year group compared with the other groups.
Serum total protein concentration, protein fractions (g/l), and albumin/globulin (A/G) ratio (mean ± standard deviation [SD]) in cows of various ages. *
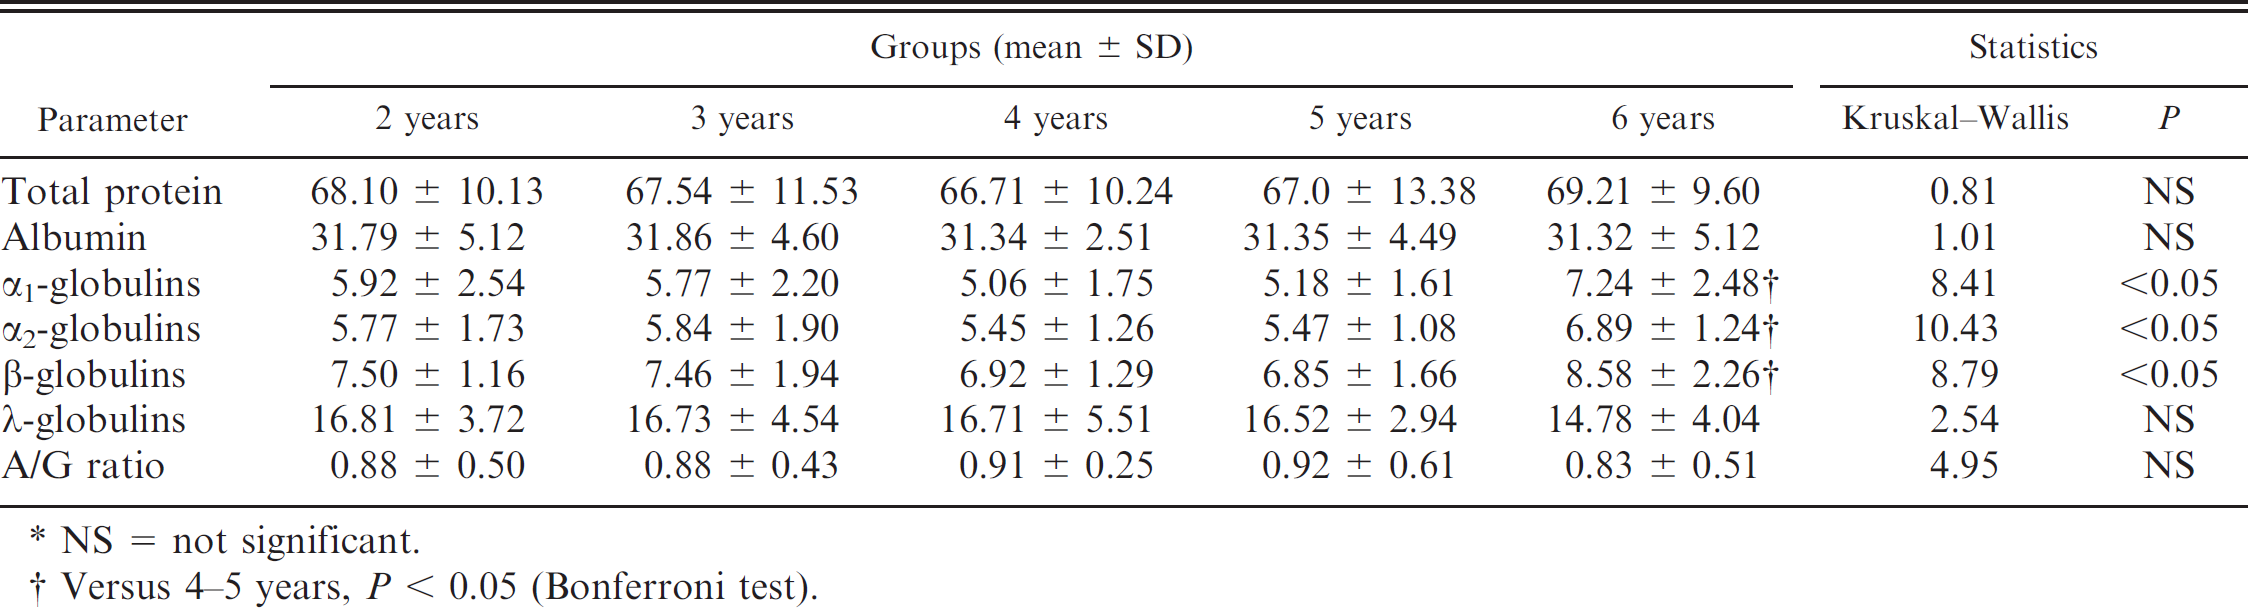
NS = not significant.
Versus 4–5 years, P < 0.05 (Bonferroni test).
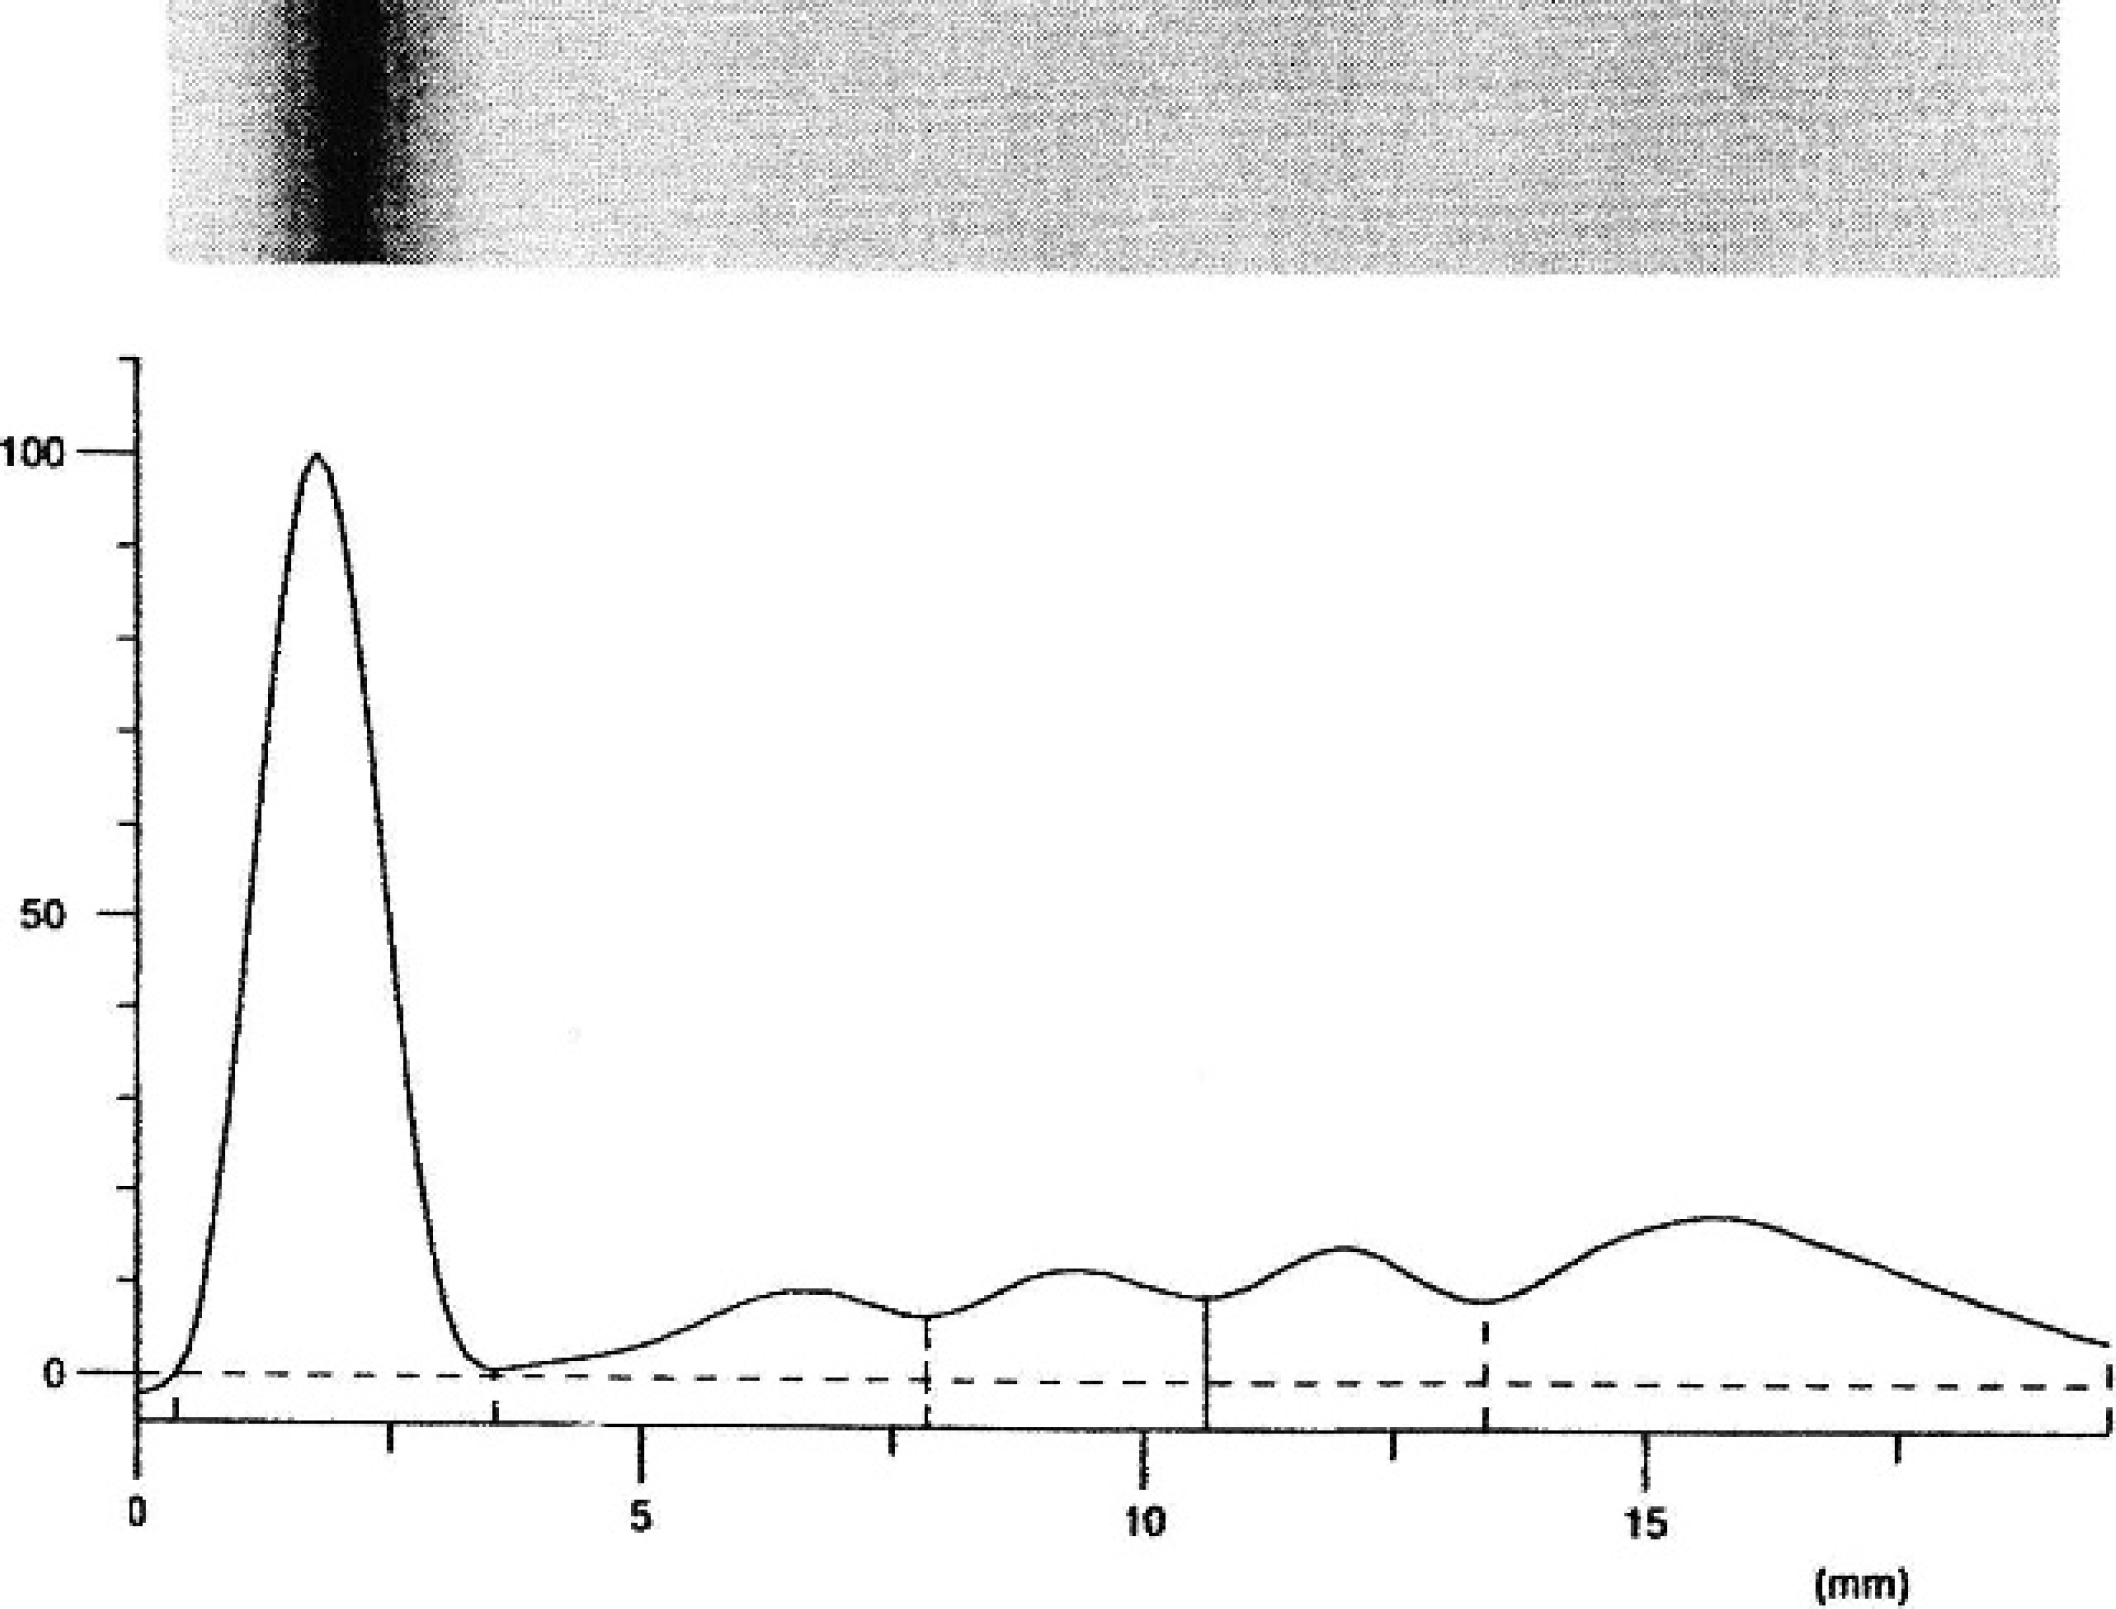
Electrophoretogram from a Modicana dairy cow.
Identifying and quantifying individual protein fractions and determining the normal SPE pattern in a species enable the identification of individuals with altered SPE patterns, which may reflect responses to changes in homeostasis or disease. Using agarose as the support medium for SPE provides good resolution, reproducibility, and clarity of electrophoretic bands. Because SPE is limited by not being able to quantify specific individual proteins other than albumin and is mainly used as a screening method, it is not necessary to separate as many protein fractions as possible. 15 Therefore, separation of serum into 5 fractions in the cows (albumin and α1-, α2-, β-, and γ-globulins) is usually sufficient for diagnostic purposes. In cattle, albumin concentration measured by AC electrophoresis was higher than that obtained by agarose gel. 2 Albumin is the most prominent serum protein in the electrophoretogram of cows, and it constitutes the 39–58% of the total serum protein content. Within the reference range the upper limit of albumin values obtained using agarose gel electrophoresis was similar to the values obtained using cellulose acetate electrophoresis, 8 but the lower limit for albumin concentration obtained using agarose gel study was lower than that obtained using cellulose acetate. This difference is probably due to the different support medium used.
The α fraction migrates as α1 (fast) and α2 (slow) fractions, which is in contrast with some reports in the veterinary literature 8 but in accordance with data obtained by cellulose acetate 13 and by agarose gel electrophoresis. 9 These 2 fractions constitute 3.59–7.13% and 5.09–13.96%, respectively, of the total serum proteins. The β-globulins migrate differently in cows than in goats 1 (as one fraction). This result agrees with that of some authors 8 but is different from the result of some others. 9 The reason for this discrepancy is unclear. The most likely explanation is that the α2 fraction is considered to be β1-globulin. 8 In the present study, visual examination of the gel did not allow for separation of the β-globulins into 2 zones. The β-globulins constitute 7.38–15.28% of the total serum proteins. A previous study 10 found differences in α-globulins and β-globulins between calves of 3–4 weeks in age and cows of 2–10 years of age, with higher values in calves, but only the electrophoretograms were shown in that work, and protein concentrations for each fraction were not calculated. In the current study, these fractions were higher in the older group than in others; no difference in A/G ratio was found. This is an important finding, as particular attention is given to A/G ratio in clinical pathology because it allows for electrophoretic profile classification and identification of dysproteinemia. 8
The results of the present study showed that lower age differences in protein fractions are present in cows but not in goats. 1 The A/G ratio range in the present study is wider than previously published literature values, most likely because of the number of cows used; this could help to further discriminate a physiological electrophoretogram from a pathological one. Although ideally every laboratory should establish its own reference intervals, the reference intervals in the present study were similar to those of previous studies, 14 but concentrations of globulin fractions differed from those in other published references intervals. 8 When deciding whether to establish its own reference intervals, a laboratory often weighs the costs of their development against the number of samples it receives from that species. 5 Although for many years a minimum of 40 samples was suggested 16 for normally distributed data, the Clinical and Laboratory Standards Institute recommends nonparametric statistical calculations, using a minimum of 120 samples for establishing references intervals. 3
In summary, serum protein electrophoresis by the agarose gel method has not been sufficiently standardized in a large number of good-quality samples from cows. The results of the current study yield clinically applicable reference intervals for concentrations of serum total protein concentration and protein fractions in dairy cows and demonstrate that adult physiological protein concentrations are rarely influenced by age. Further studies are necessary to establish if there are breed differences in the reference intervals for serum total protein concentration and subsequent protein fractions.
Footnotes
a.
Konelab 20, Thermo Fisher Scientific Oy, Vantaa, Finland.
b.
Dasit, Milano, Italy.
c.
Helena Biosciences Europe, Gateshead, Tyne and Wear, United Kingdom.
d.
StatSoft Inc., Tulsa, OK.