
Abstract
Urine osmolality (UOsm) is considered the most accurate measure of urine concentration and is used to assess body fluid homeostasis and renal function. We performed analytical validation of freezing point depression measurement of canine UOsm, to establish reference intervals (RIs) and to determine the effect of age, sex, and reproductive status on UOsm in dogs. Clinically healthy dogs (n = 1,991) were retrospectively selected and stratified in groups by age (young [0–12 mo], adults [13–84 mo], and seniors [>84 mo]), sex (females and males), and reproductive status (intact and neutered). RIs were calculated for each age group. Intra- and inter-assay coefficients of variation were <1% in all cases. Good linearity (r2 = 1,p < 0.001) and recovery (89–98%) were observed. The limit of detection and limit of quantification were zero. Urine specific gravity and UOsm had a highly significant positive correlation (r = 0.96, p < 0.001) but had inconsistent agreement. The 95% RI for canine UOsm was 369–2,416 mOsm/kg in young and adult dogs, and 366–2,178 mOsm/kg in seniors. Senior dogs had a significantly lower UOsm than young and adult dogs (p < 0.000). Neutered females had a significantly lower UOsm than intact female dogs (p < 0.002). These results indicate that the method evaluated is adequate for UOsm measurement and that RIs based on age and reproductive status should be used in dogs.
Introduction
Urine concentration allows evaluation of renal response to variations in body fluid homeostasis and assessment of renal tubular function. Colorimetric reagent strips, refractometric specific gravity, and freezing point osmolality are used to measure urine concentration. 3 Test strips utilized to measure urine specific gravity (USG) are based on change of color of bromothymol blue used as the pH indicator. 3 In dogs, USG determined by test strips is considered unreliable because alkaline pH and glucosuria influence the measurement, giving lower results. 4 Refractometry provides an indirect estimate of USG by measurement of the urine refractive index, which is the ratio of the velocity of light in air to the velocity of light in solution. The number, mass, and chemical structure of dissolved particles in solution affect the index of light reflection and hence the measurement. The refractometer SG scale is based on experimental data from normal human, not canine, urine.3,4,6
Urine osmolality (UOsm) is considered the most accurate method to determine urine solute concentration in humans. 6 Osmolality is defined as the number of moles of osmotically active particles per kilogram of solution and is expressed in milliosmoles per kilogram (mOsm/kg). Osmolality is not influenced by the size, weight, or electric charge of particles, but by the number of osmolytes per unit of solvent.1,2,18
UOsm is usually measured by freezing point depression osmometry, based on the principle that each mole of dissolved solute will decrease the freezing point of a liquid by 1.86°C. 1 Most freezing point osmometers are automatic and quick, and measurements are simple to perform. 2 Clinically, decreased UOsm is considered an early marker of renal dysfunction.12,22 Urine concentrating ability decreases in humans13,19 and dogs 21 with age. This variation is attributed to a decrease in glomerular filtration rate and renal blood flow, and a failure of normal extrarenal or renal responsiveness to antidiuretic hormone (ADH).13,19,21 Sex dimorphism is described in humans, with UOsm higher in men than in women. 15 Similarly, in a small population study, UOsm values were reported to be higher in male than in female dogs. 8
We performed analytical validation of UOsm in dogs using an automated freezing point depression osmometer. In addition, we developed reference intervals (RIs) for age groups and evaluated effects of age, sex, and reproductive status on UOsm of healthy dogs.
Materials and methods
Clinically healthy dogs (n = 1,991) were selected retrospectively from 2008 to 2014 from the San Marco Private Veterinary Clinic (Padova, Italy) database, regardless of age, sex, reproductive status, or breed, to develop RIs for UOsm. Patients were considered clinically healthy after a normal physical examination and complete blood count, biochemistry panel, and urinalysis including USG, urine protein-to-creatinine ratio, and urine analytes within the in-clinic laboratory RIs. We did not perform further tests, such as abdominal ultrasound, to confirm the absence of early renal disease. In order to determine RIs for different age groups, dogs were stratified into 3 age groups: young (0–12 mo), adults (13–84 mo), and seniors (>84 mo). Ages ranged from 1 to 193 mo (mean 55). The dogs were of 130 different breeds. Most common breeds were mixed-breed (454), Labrador Retriever (189), and German Shepherd (111). The population consisted of 1,117 females (409 neutered and 708 intact) and 874 males (753 neutered and 121 intact; Table 1).
Distribution of the dog population by sex, age, and reproductive status.
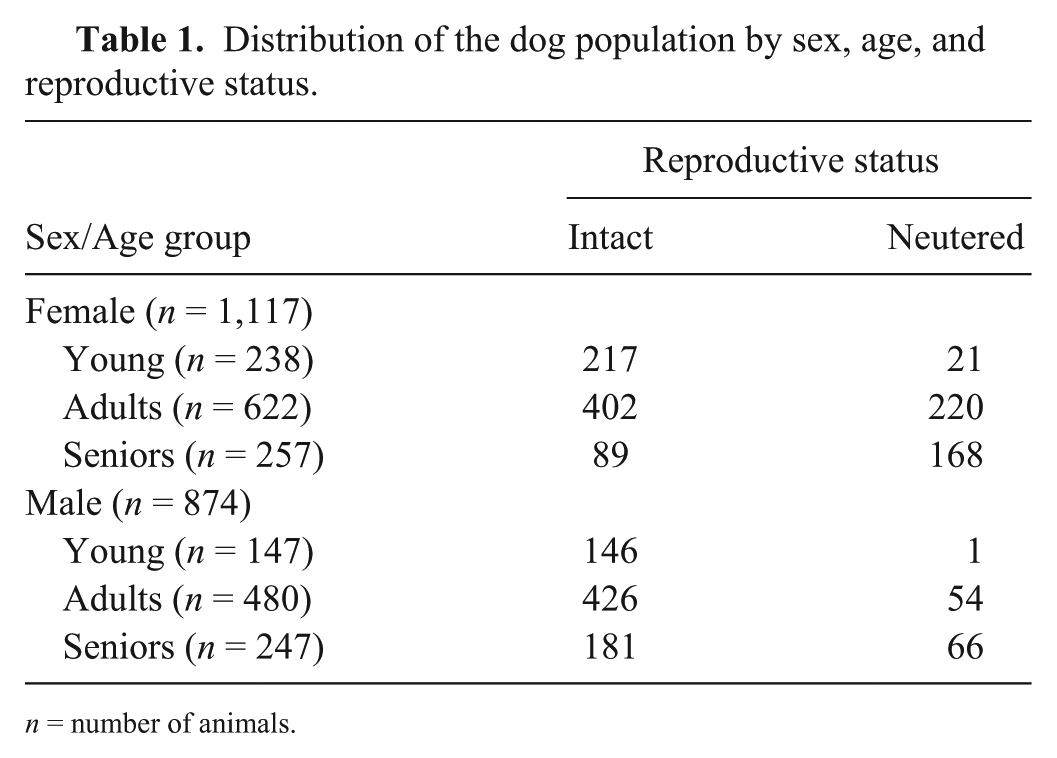
n = number of animals.
Urine samples were collected by ultrasound-guided cystocentesis, transferred to 5-mL sterile plastic vials, and analyzed within 1 h post-collection. Remaining samples were stored at −20°C. The UOsm measurement was performed by an automatic freezing point depression osmometer (Osmo Station OM-6050, ARKRAY, Menarini Diagnostics, Kyoto, Japan). The instrument was checked before use by 3 internal quality controls: human urine chemistry controls (Liquichek, Bio-Rad Laboratories, Hercules, CA) level 1 (446 mOsm/kg) and level 2 (804 mOsm/kg), and distilled water (0 mOsm/kg). Three-point calibration was performed with distilled water (0 mOsm/kg), and the low (300 mOsm/kg) and high (1,000 mOsm/kg) aqueous sodium chloride standard solutions levels provided by the manufacturer (ARKRAY, Menarini Diagnostics). Frozen urine was thawed at room temperature for 1 h and homogenized before measuring osmolality when used for validation studies. 4 All measurements were conducted by the same operator.
Three urine pools (low ≈ 400 mOsm/kg, medium ≈ 1,200 mOsm/kg, and high ≈ 2,000 mOsm/kg) were made to evaluate the precision, linearity under dilution, and limit of quantification (LOQ) of the method. Each pool was obtained by mixing 4 different urine samples. Five diverse urine samples with different UOsm were selected to perform the recovery experiment.
The intra-assay coefficient of variation (CV) was calculated based on 10 successive measurements on duplicates of the 3 urine pools. Inter-assay CV was calculated based on 10 consecutive runs in duplicate, carried out on 5 different days for each urine pool. 11
Accuracy was evaluated based on a recovery test and linearity under dilution study. 14 Recovery was defined as the percentage increase of concentration that was measured in relation to the amount of the standard solution added. 11 Five urine samples with low values: 351 mOsm/kg (sample 1), 642 mOsm/kg (sample 2), 402 mOsm/kg (sample 3), 448 mOsm/kg (sample 4), and 550 mOsm/kg (sample 5), were selected for the recovery experiment. Two aliquots were prepared from each of these samples: the high UOsm standard solution (1,000 mOsm/kg) was added (1:1 volume) to the first aliquot. Distilled water (0 mOsm/kg) was added to the second aliquot (1:1 volume). All samples were analyzed in duplicate. Detected and expected UOsm levels were compared, and the recovery percentages were calculated as described previously. 23 Linearity under dilution was performed using a canine urine sample with known concentration (1,922 mOsm/kg) diluted at 0%, 10%, 20%, 40%, 50%, 60%, 90%, 95%, and 100%, using distilled water. Dilutions were analyzed consecutively in duplicate. 10 Linearity of the dilution series was assessed by linear regression. 23
Limit of detection (LOD) was calculated as the median value plus 2 standard deviations (SD). LOD was based on 10 consecutive measurements in duplicate of the blank (distilled water). 11 LOQ was calculated as the lowest amount of analyte that could be measured with an intra-assay CV < 15%. 20 Twenty-six serial dilutions of 1 urine pool with high UOsm were prepared using distilled water and analyzed 4 times. The CV of each dilution was calculated and plotted as a function of UOsm concentration.
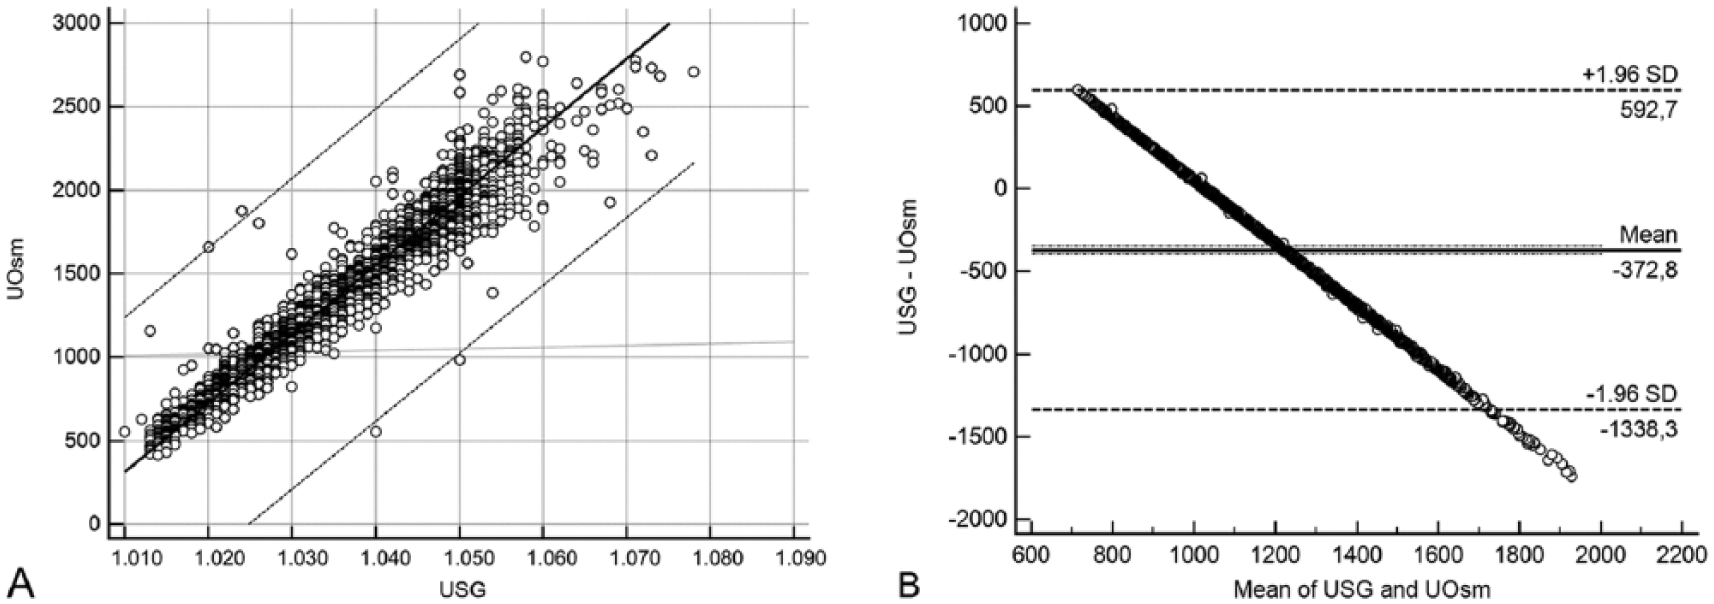
In order to evaluate the agreement between USG and UOsm methods, 11 USG was measured in all animals by a desktop clinical refractometer (T3-NE, ATAGO USA, Bellevue, WA) that was calibrated with distilled water (SG = 1.000). Intra-assay CV, inter-assay CV, and recovery were calculated using routine statistical procedures11,23 with statistical software (Analyse-it v.3.5, Analyse-it Software, Leeds, UK; MedCalc v.14.8.1, MedCalc Software, Ostend, Belgium). Regression analysis was used to compare measured and expected UOsm values obtained in the linearity under dilution study. Method comparison between UOsm and USG was studied by Spearman regression, Passing–Bablok regression, and Bland–Altman plot using commercial software (Analyse-it v.3.5; MedCalc v.14.8.1). Mean and 95% confidence interval (CI) were used to define RIs. All variables met normal distribution criteria and were evaluated with paired 2-tailed Student t-test. Comparison between age, sex, and reproductive status was performed using ANOVA with a Tukey contrast test for multiple comparisons. Statistical significance was set at p < 0.05 for all analyses.
Results
Intra-assay and inter-assay CVs were 0.23–0.89% and 0.16–0.8%, respectively (Table 2). Serial dilutions of a urine pool with high UOsm resulted in linear regression equations with an adjusted correlation coefficient (r2) of 1, and a Pearson coefficient p < 0.001 that reveals an excellent fit to the linear model. Intercept of 2.87 (–5.96 to 11.69) with 95% CI did not differ significantly from zero. Slope was 19.41 (19.27–19.55; Fig. 1). Recovery was 89–98% between observed and expected UOsm (mean: 94.8%; Table 3). The LOD was zero (0 ± 0 mOsm/kg), and the assay was precise with any value tested, therefore the LOQ was also zero. UOsm and USG showed a highly significant positive correlation (r = 0.96,p < 0.001). A proportional error was observed between the methods (Fig. 2).
Intra-assay and inter-assay coefficients of variation (CVs) of urine osmolality (UOsm) determined by freezing point depression osmometry in canine urine pools with 3 concentration levels (low, medium, high).
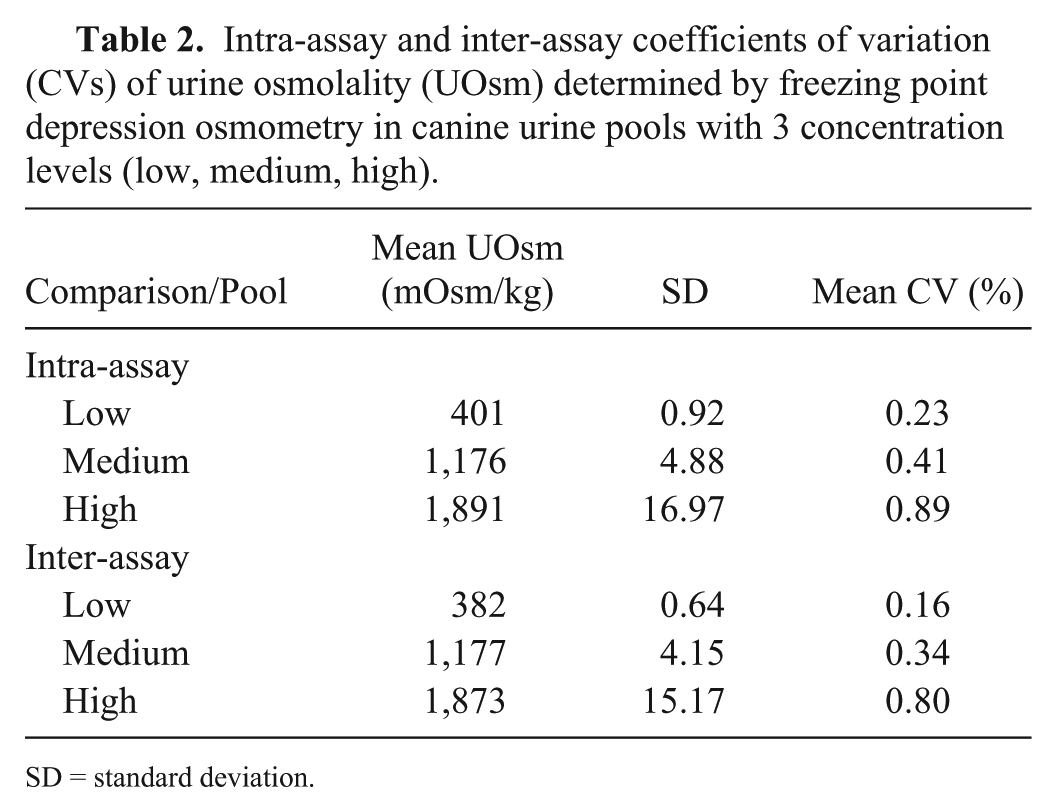
SD = standard deviation.
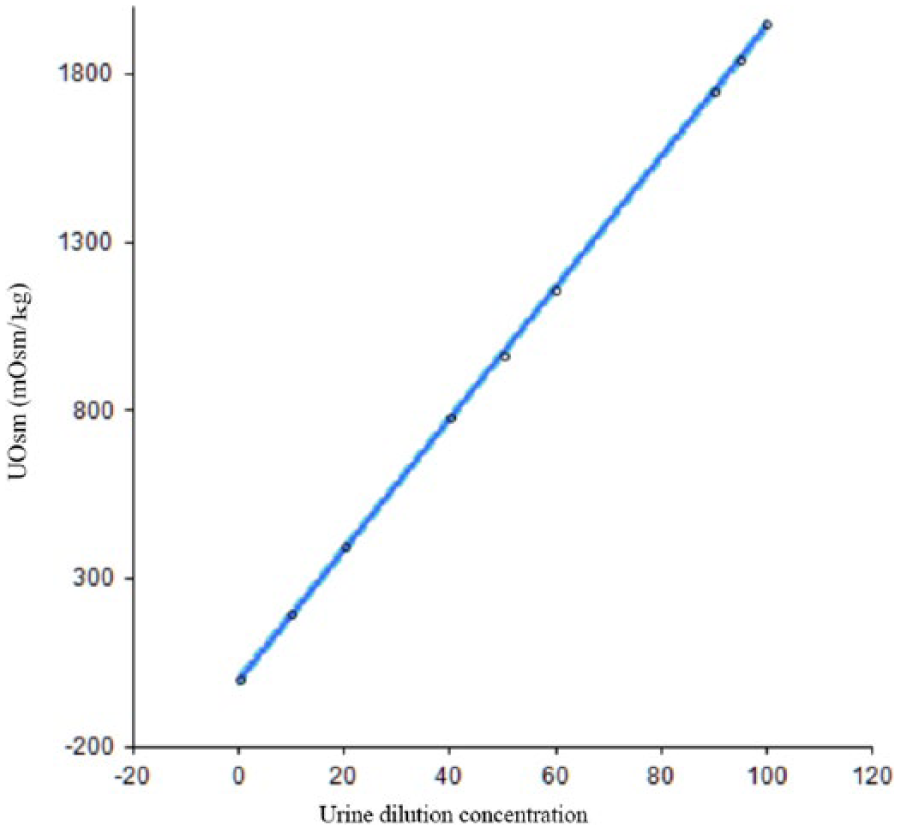
Linearity under dilution from 9 samples with different concentrations, after serial dilution with distilled water of 1 canine urine sample (1,992 mOsm/kg). Urine osmolality (UOsm) was determined by freezing point depression osmometry. Each point is the mean value of duplicate determinations.
Recovery percentages from 5 different canine specimens with low urine osmolality (UOsm), measured by freezing point depression osmometry, after preparing 2 aliquots from each specimen by adding different solutions.
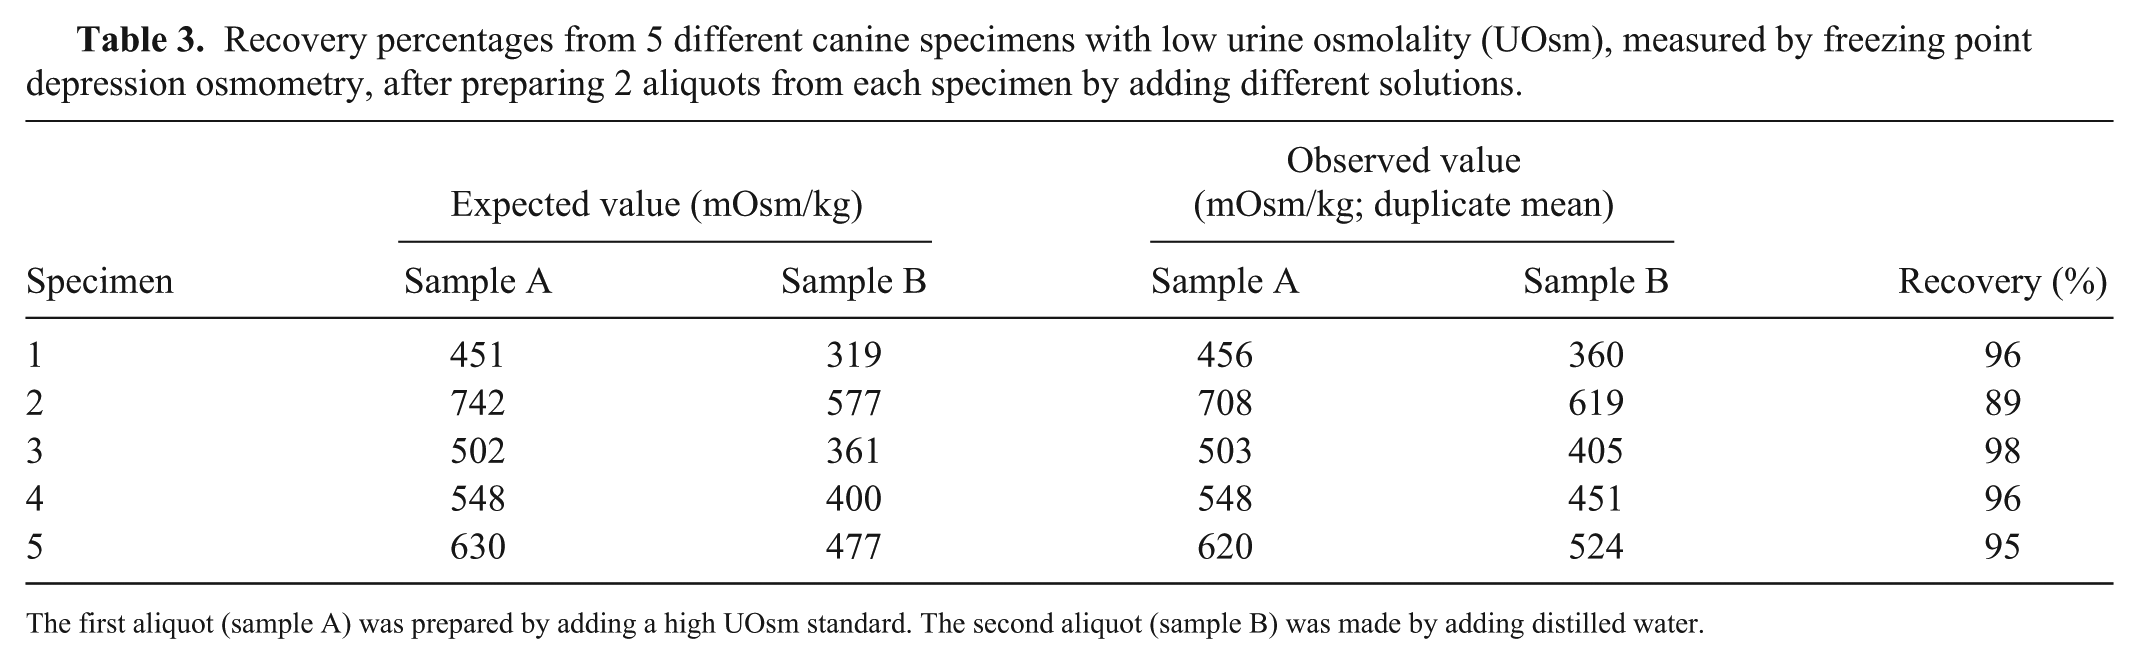
The first aliquot (sample A) was prepared by adding a high UOsm standard. The second aliquot (sample B) was made by adding distilled water.
The 95% UOsm RI for young and adult dogs was 369 (CI: 316–395 mOsm/kg) to 2,416 mOsm/kg (CI: 2,364–2,482 mOsm/kg). In senior dogs, UOsm RI was 366 (CI: 342–405 mOsm/kg) to 2,178 mOsm/kg (CI: 2,032–2,285 mOsm/kg; Table 4). Senior dogs had a significantly lower UOsm (p < 0.000) than young and adult dogs (Table 5).
Urine osmolality reference intervals in young and adult, and senior dogs.
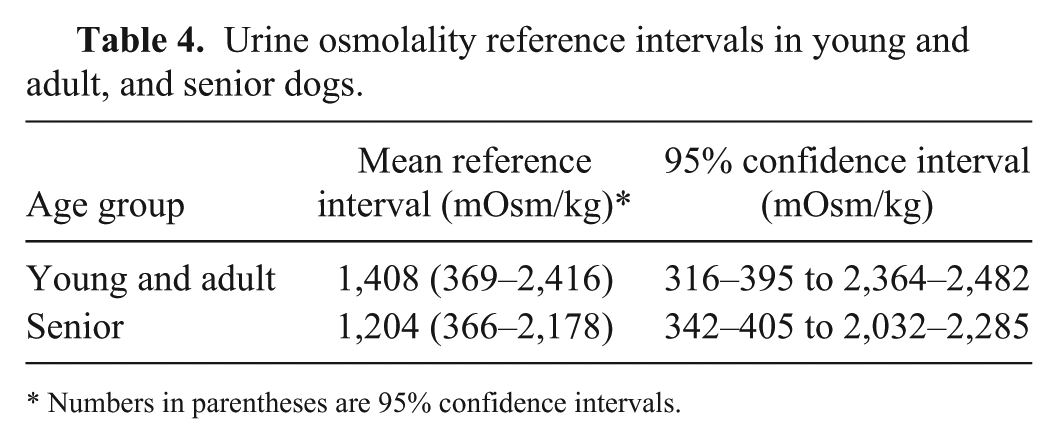
Numbers in parentheses are 95% confidence intervals.
Urine osmolality (UOsm) values in different age groups of healthy dogs.
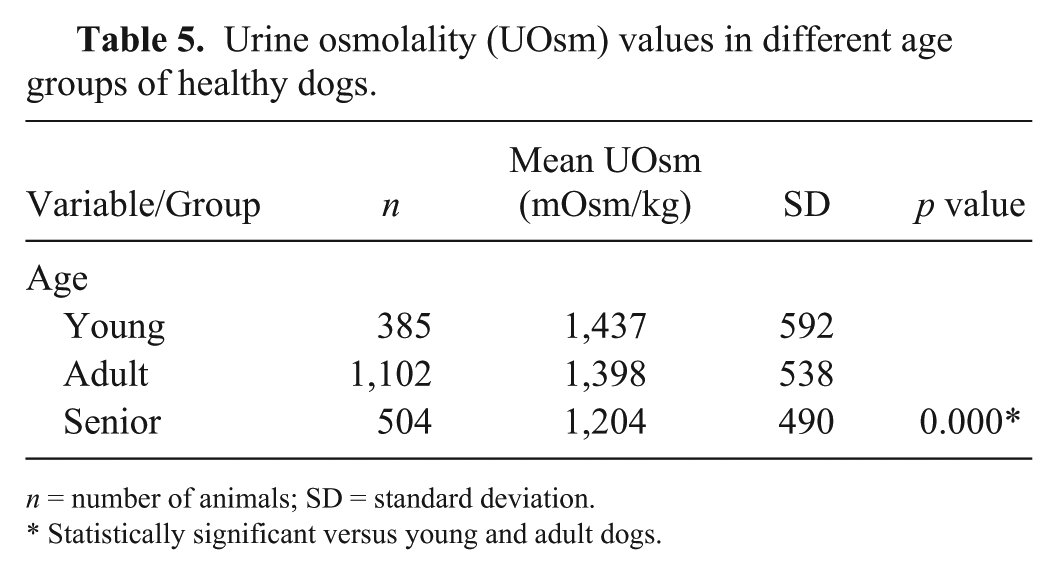
n = number of animals; SD = standard deviation.
Statistically significant versus young and adult dogs.
No statistically significant differences were found between males and females in any age group in the population. UOsm was significantly lower in neutered (1,278 ± 530 mOsm/kg) than in intact female dogs (1,386 ± 569 mOsm/kg; p < 0.002). No statistically significant differences were found in UOsm between neutered and intact male dogs (Table 6).
Comparison between urine osmolality (UOsm) and reproductive status in young, adult, and senior female and male dogs.
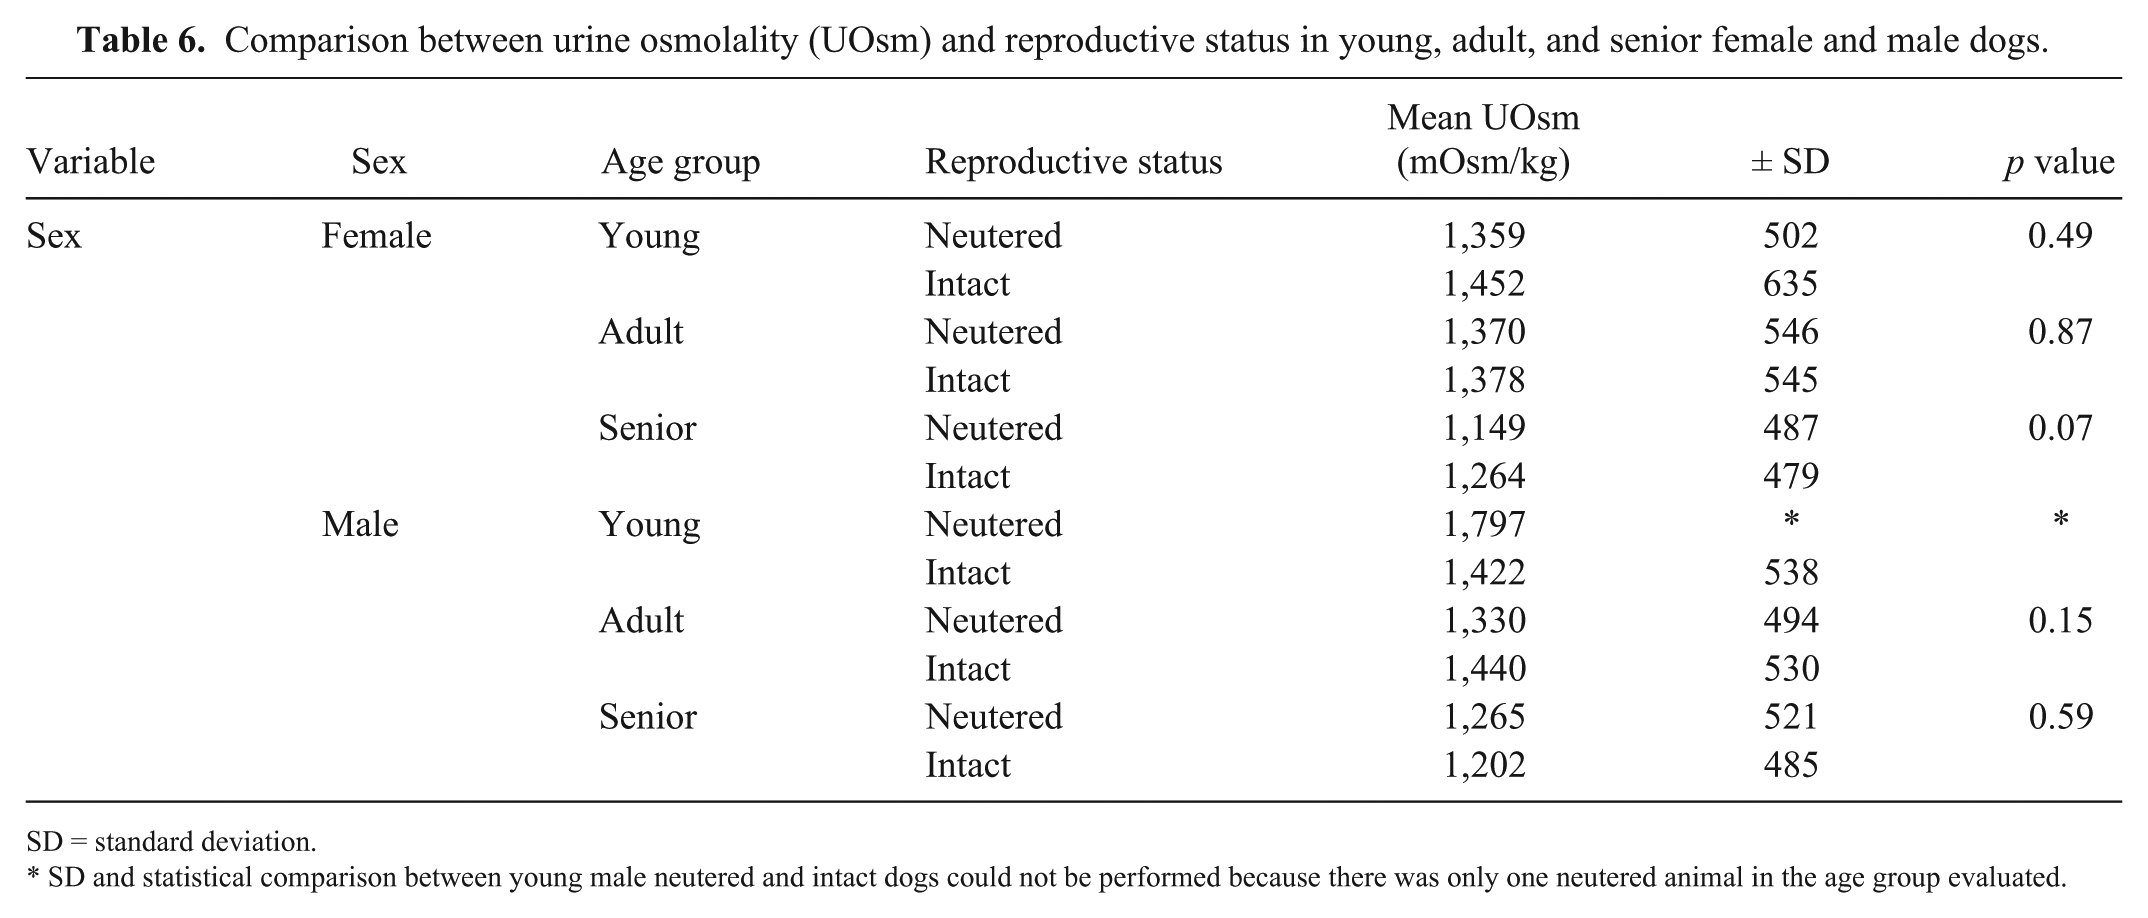
SD = standard deviation.
SD and statistical comparison between young male neutered and intact dogs could not be performed because there was only one neutered animal in the age group evaluated.
Discussion
Precision and linearity under dilution in our study are similar to those reported in humans 5 and dogs. 21 The recovery value was better in the lower range in our study than in the human one. 5 However, in the human study, controls and standard solutions were used for validation instead of urine pools.
The comparison between USG by refractometry and UOsm by freezing point depression showed a highly significant positive correlation in our study, similar to previous reports in dogs.1,4 Nonetheless, some analytes have been found to cause interference and may influence this relationship, such as ketones in the dog, 1 and ketones, protein, and glucose in humans.16,17 We observed a proportional error between the methods with extreme values having the highest differences, making the methods not comparable. Results in human patients with renal impairment suggest that the relationship between USG and UOsm is not as consistent as expected, but the reason is unclear. 17
We found the osmometer validated for our study to be trouble-free and simple to use. Furthermore, its automatic processing and technical characteristics make it suitable for clinical settings, as well as for laboratories with large volumes of samples.5,9
Our results agree in part with those of 2 other studies of UOsm RIs in dogs,7,21 although the number of animals included in the previous studies was considerably smaller than in our study. The upper value of RIs in our study is similar to that elsewhere (2,546 mOsm/kg), 7 but slightly lower than that observed by others (2,830 mOsm/kg). 21 More controversy exists in the lower limit of the RIs. Our values are between those described by 2 other studies (976 mOsm/kg 7 ; 161 mOsm/kg 21 ). The difference between studies can be attributed to the different populations evaluated and the number of animals included.
In our study, UOsm was significantly lower in senior than in young and adult dogs, confirming the decrease of urine concentration in older dogs as described previously. 21 In humans13,19 and dogs, 21 decreased capability to concentrate or dilute urine with age is related to a reduction in glomerular filtration rate and renal blood flow, failure of normal extrarenal or renal responsiveness to ADH, impaired thirst mechanism, and increase in sodium losses.
Differences between morning and evening UOsm values have been reported in dogs. 21 However, urine samples were randomly collected throughout the day in our study. Nonetheless, our results are representative of the situations that occur in routine clinical practice where urine can be collected at different times of the day.
In humans, men have higher UOsm values than women. 15 It seems that this difference does not depend on the direct effects of sex hormones or on the level of sodium intake. 15 Higher UOsm in men could be attributed to the fact that men concentrate urine more than women on their usual diet and spontaneous fluid intake. 15 Similar findings has been reported in male dogs. 8 In our study, no statistically significant differences were observed by sex. However, significantly higher UOsm values in intact than in neutered females were observed. To our knowledge, there is no evidence that can explain these results.
Footnotes
Acknowledgements
We thank the staff of San Marco Veterinary Laboratory for their technical assistance.
Declaration of conflicting interests
The authors declared no potential conflicts of interest with respect to the research, authorship, and/or publication of this article.
Funding
Financial support was provided by the program “Juan de la Cierva” of “Ministerio de Economía y Competitividad,” Spain, through a postdoctoral grant.