
Abstract
Isolation of pathogens from duplicate or multiple milk samples is currently considered the gold standard in diagnosis of bovine intramammary infections (IMI). However, in large field studies and especially in normal dairy production conditions, collection of single samples is often the most practical option to determine the causal agents of mastitis in a herd. The objective of the present study was to determine how well results between the first and the second sample in pairs of duplicate and successive quarter milk samples agree, using 5 different IMI definitions, based on the number of colony forming units (CFU) per milliliter of milk and epidemiology of the pathogens isolated. Agreement between microbiologic results from the first and the second sample of a pair was assessed by calculating the percentage of agreement and kappa coefficient. Milk samples collected at dry-off from 561 Holstein cows in 4 Ohio dairy herds were included in the analyses. Results of the study indicate that the agreement between the first and the second sample of a duplicate pair was high when criteria to call a sample positive was adjusted for the number of CFU/ml of milk by considering the epidemiology of different mastitis organisms. This finding suggests that an IMI can be accurately diagnosed with single samples. For contagious pathogens (Staphylococcus aureus) a cutoff of 100 CFU/ml and a cutoff of 1,000 CFU/ml for major environmental and minor pathogens will serve as a sensible approach to diagnose bovine IMI with single milk samples.
Introduction
Mastitis, inflammation of the mammary gland, is primarily caused by invasion of pathogenic bacteria. 13,25 Determination of the cause of intramammary infection (IMI) is typically accomplished by microbiologic culture of aseptically collected milk samples and interpretation of the culture results. 15 For research purposes, milk samples for microbiologic culture are commonly collected at a single milking or during separate milkings. Sampling strategies for a single milking include collection of single, duplicate, 17 or successive samples (i.e., before and after milking). Interpretation of culture results can be seen as a 2-step process. The first step involves an analysis of the number of colony forming units (CFU) per milliliter of milk of specific pathogens to declare the sample positive. 3 Currently, there are no consistent guidelines regarding how many CFU/ml of milk are required to indicate a true infection, and several different cutoff values have been reported in the literature to declare a sample bacteriologically positive. 1,4,28,29 Quite often, however, investigators and/or published literature do not provide any information about how many CFU/ml were used to diagnose IMI. The second step of the process concerns the interpretation of the results when more than 1 sample is available (i.e., series or parallel). In this regard, the National Mastitis Council (NMC) recommends series interpretation of duplicate samples (i.e., the same pathogen must be isolated from both samples to declare IMI). 20 Similarly, when consecutive samples are obtained, it is recommended that the same pathogen be recovered from 2 out of 3 samples before labeling a sample positive. 20
Several studies have measured the level of agreement between samples taken in pairs as either duplicate 8,17,24 or consecutive samples. 12 The analyses measured the agreement of bacteriologic results between the first and the second sample of the pair; however, these studies date back several decades, and they did not compare different cutoff values nor even report the cutoffs used for the number of CFU/ml to call a sample positive. Duplicate or multiple samples interpreted in series are currently considered the gold standard in IMI diagnosis. 20 It is important to recognize, though, that while series interpretation increases specificity, it simultaneously decreases sensitivity of the testing procedure 7 and, thus, may result in missed infections. In large field trials, a collection of single milk samples is often the most practical and cost-effective option, and single samples are also routinely collected in practical dairy production situations to determine causal agents of IMI in a herd. If agreement between the individual samples in duplicate or multiple sampling is high, then the infection status of a quarter can be accurately determined with a single sample. Thus, the objective of the present study was to determine agreement between culture results from the first and the second sample of paired duplicate and successive quarter milk samples, using different cutoff values for the number of CFU/ml in IMI diagnosis based on the consideration of the epidemiology of the pathogens.
Materials and methods
Milk samples were collected from 561 Holstein cows enrolled in a dry cow therapy investigation in 2 commercial and 2 institutional dairy herds in Ohio. Quarter milk samples were collected according to NMC guidelines 20 throughout the year (i.e., all seasons of the year) between June 2003 and June 2006. All samples were collected during morning milking from healthy animals without signs of clinical mastitis at the last milking before dry-off. One trained technician and 2 of the investigators (AT and PRS) collected all samples. After field collection, samples were immediately placed on ice, transported to the laboratory, and stored at −20°C until microbiology procedures were conducted.
Milk samples were examined microbiologically according to NMC guidelines. 20 In brief, samples were examined by plating 0.01 ml of milk on trypticase soy agar with 5% sheep blood a and on MacConkey agar plates a using sterile disposable calibrated loops. Plates were incubated for 48 hr at 37°C, and bacterial growth was recorded at 24 and 48 hr of incubation. Colonies were first identified based on colony morphology, hemolytic patterns, and Gram staining. Bacterial species were identified following NMC guidelines. 20 Colonies on blood agar with similar morphology were counted and recorded as colony forming units (CFU) per milliliter of milk. Samples were considered contaminated whenever more than 2 types of colonies were present in the sample. 20
Sampling strategies and interpretation of culture results
Two different sampling strategies were evaluated independently: 1) duplicate samples (DS), premilking samples taken one immediately after the other at the last milking at dry-off from 315 cows; and 2) successive samples (SS), premilking and postmilking samples collected at the last milking at dry-off from 246 cows. Each cow contributed only 2 samples (either duplicate or successive) to the analyses. Based on microbiologic results from single samples, 5 definitions of IMI were evaluated: 1) isolation of ≥100 CFU/ml of any pathogen (INF1); 2) isolation of ≥100 CFU/ml of major contagious pathogens (Staphylococcus aureus and Streptococcus agalactiae) or ≥500 CFU/ml of all other pathogens (INF2); 3) isolation of ≥100 CFU/ml of major contagious pathogens (as listed above) or ≥1,000 CFU/ml of all other pathogens (INF3); 4) isolation of ≥100 CFU/ml of major pathogens (S. aureus, streptococci, enterococci, yeast, Arcanobacterium pyogenes, Nocardia spp., coliforms [Escherichia coli, Enterobacter spp., and Klebsiella spp.], and other Gramnegative pathogens) or ≥500 CFU/ml of minor pathogens (coagulase-negative staphylococci (CNS) and Corynebacte-rium spp.; INF4); and 5) isolation of ≥100 CFU/ml of major pathogens (as listed above) or ≥1,000 CFU/ml of minor pathogens (INF5). The different definitions and CFU/ml cutoffs were chosen with the goal of adjusting for the epidemiology of the organisms when using single samples in IMI diagnosis.
Microbiologic gold standard and data analysis
The level of agreement between the microbiologic results from the first and the second sample of the same quarter was assessed independently for both of the sampling strategies (i.e., 2 separate sets of analyses). Percentage of agreement was the total number of samples classified as either positive or negative in both the first and the second sample divided by the total number of samples. 9 The level of positive and negative agreement 5 and their confidence intervals (CIs) were calculated as previously described by Mackinnon. 19 The degree of agreement beyond chance between results from the first and the second sample of a pair based on a dichotomous response (infected = 1, noninfected = 0) was expressed as a kappa coefficient and its 95% confidence interval. b 10 Before calculating kappa, marginal homogeneity of the proportions of positive results from the 2 samples was tested by McNemar's test. 7,22 The calculations were performed pooling all isolates together as well as considering specific types of organisms separately (major contagious pathogens, major environmental pathogens, and minor pathogens). For major contagious pathogens, cutoffs of 100 and 500 CFU/ml were evaluated; whereas for minor pathogens and major environmental pathogens, cutoffs of 100, 500, and 1,000 CFU/ml were assessed.
The currently recommended gold standard for diagnosis of intramammary infections is collection and interpretation of duplicate or consecutive samples in series. 20 In practical conditions and in large field studies, however, single samples are typically collected and are the most practical approach. To assess how well single samples are able to detect IMI in comparison with the recommended gold standard, sensitivity, specificity, and efficiency 18 [(number of true positives + true negatives)/total number of samples] with the 95% CIs were calculated for the first sample of a pair with respect to paired samples. Based on paired samples, a quarter was considered infected if the same pathogen (≥100 CFU/ml) was isolated from both samples of the same quarter according to the recommendations of the NMC. 20 Apparent prevalence based on different IMI definitions was also calculated for all pathogens pooled together as well as for different types of organisms. Analyses were performed using DAG_Stat 19 and STATA 9.2. b
Total number and percentage of the first and the second sample of duplicate samples (DS) and successive samples (SS) from which different types of pathogens were isolated.*
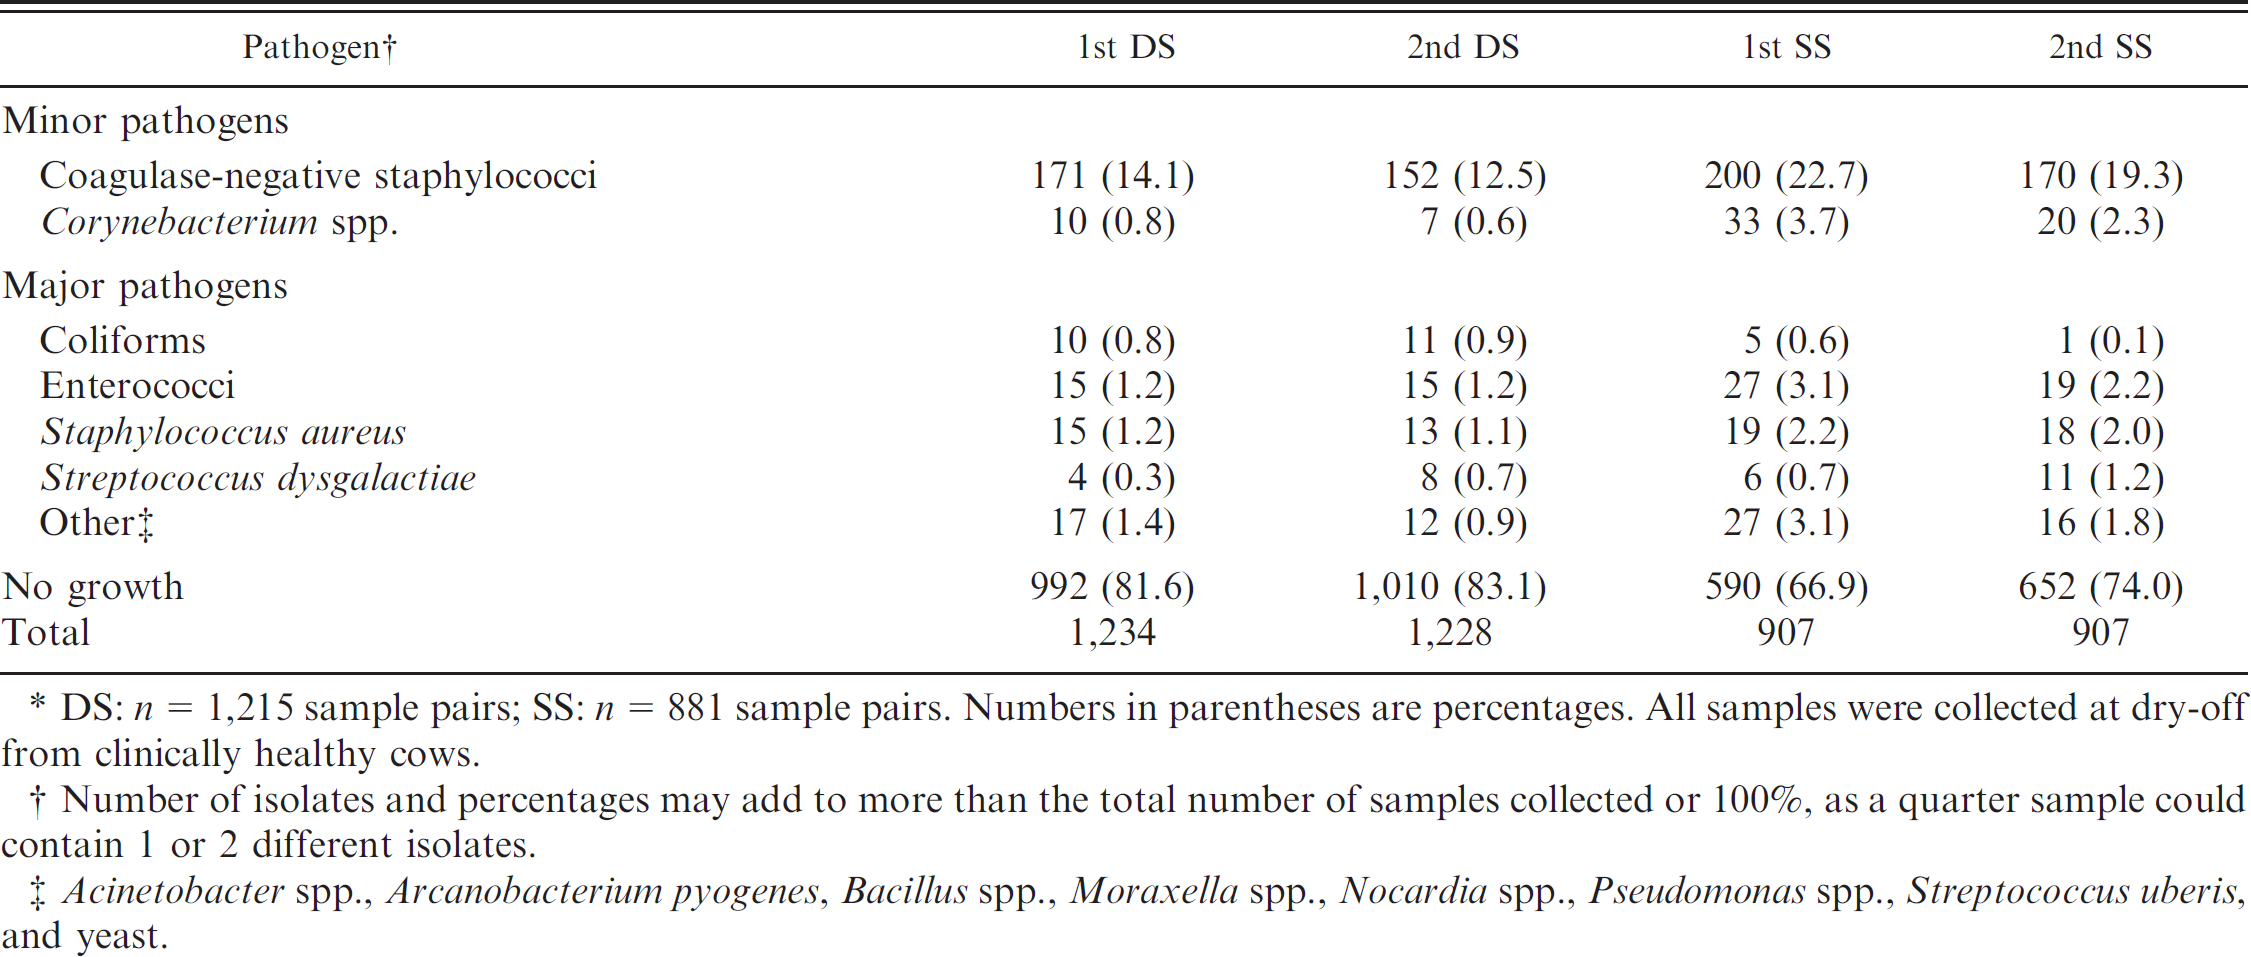
DS: n = 1,215 sample pairs; SS: n = 881 sample pairs. Numbers in parentheses are percentages. All samples were collected at dry-off from clinically healthy cows.
Number of isolates and percentages may add to more than the total number of samples collected or 100%, as a quarter sample could contain 1 or 2 different isolates.
Acinetobacter spp., Arcanobacterium pyogenes, Bacillus spp., Moraxella spp., Nocardia spp., Pseudomonas spp., Streptococcus uberis, and yeast.
Results
Overall, 1,215 duplicate and 881 successive pairs of samples were used in the analyses. A total of 128 quarter milk samples were contaminated (3.1%); pairs with 1 or 2 contaminated samples were omitted from analyses. Bacterial growth was found in 22.6% of the milk samples. In the majority of the samples, only 1 pathogen was isolated; however, in 30 of the samples (1.2%) collected as duplicates samples collected as successive 2 microorganisms were isolated and in 48 (2.7%) of the (SS). Minor pathogens represented the highest percentage of microorganisms isolated from all samples (Table 1). Coagulase-negative staphylococci (CNS) was the most common group of pathogens for all samples, followed by Enterococcus spp. and S. aureus in DS and Corynebacterium spp. and Enterococcus spp. in SS (Table 1). No Strep. agalactiae was isolated from any of the samples processed.
For minor pathogens, medians of 700 and 900 CFU/ml were observed for CNS from the first and the second sample, respectively, and 200 CFU/ml for Corynebacterium spp. from both of the samples (Table 2). The most common major pathogens isolated were S. aureus (median of 5,500 CFU/ml from the first sample and 4,000 from the second), Enterococcus spp. (median of 300 CFU/ml from both the first and the second sample), and coliforms (median of 500 CFU/ml from the first and 200 CFU/ml from the second sample).
Percentiles, minimum, and maximum of colony-forming units (CFU)/ml for main pathogens isolated from the first and the second quarter milk* samples at dry-off (results from duplicate and successive samples are combined)
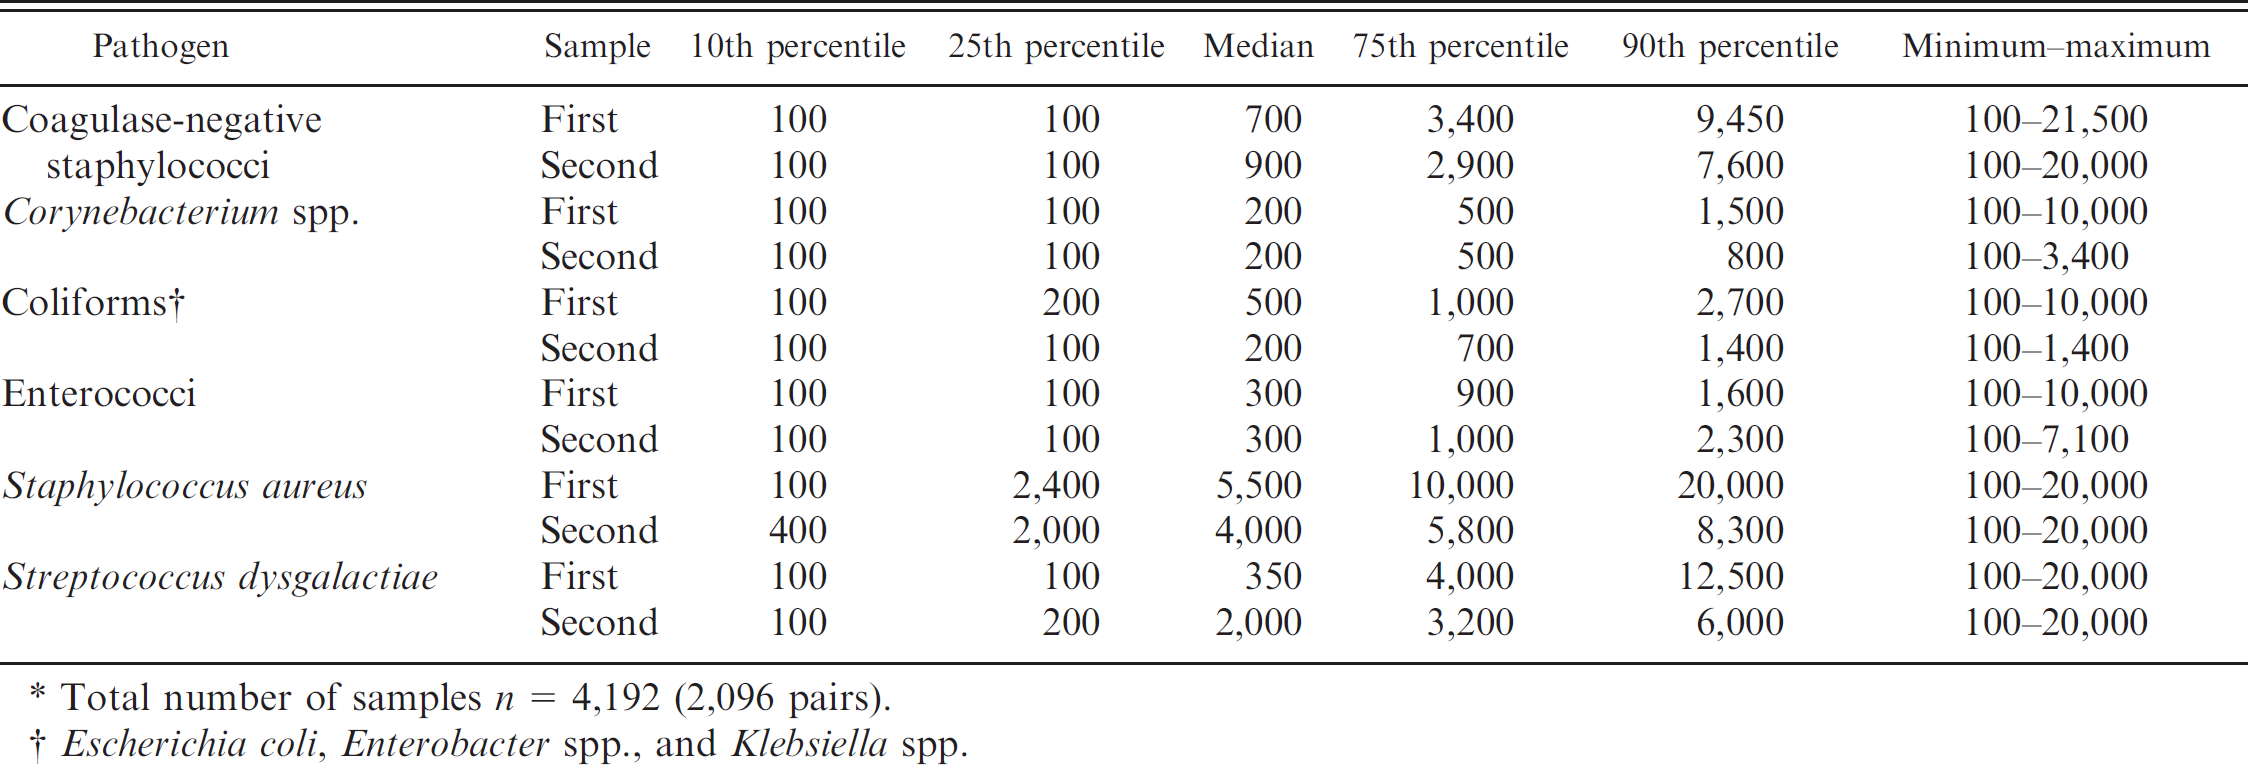
Total number of samples n = 4,192 (2,096 pairs)
Escherichia coli, Enterobacter spp., and Klebsiella spp.
Prevalence, percentage of agreement, and kappa statistic
Total number of positive samples and apparent prevalence based on each of the IMI definitions are presented in Table 3. The first samples provided consistently higher apparent prevalence than the second samples. The highest apparent prevalence was obtained with INF1, and it was markedly higher than the true prevalence. The other IMI definitions gave estimates that were closer to the true prevalence, which was based on series interpretation of the paired samples. 20 Percentages of agreement and kappa statistics (and the 95% CI) are presented in Table 4. The agreement between the first and the second sample was consistently lower in SS than in DS. The highest percentage of overall agreement was observed with INF3 (96.9%) followed by INF2 (95.8%) when results from the first and the second DS were compared. In the case of SS, the highest percentage of agreement was also observed with INF3 (91.3%), followed by INF2 (89.8%). The lowest agreement for both sampling strategies was observed with INF1.
Number of infected quarters and apparent prevalence (in parentheses) of intramammary infections (IMI) based on the first and the second sample of duplicate sample (DS) and successive sample (SS) pairs using different definitions of IMI.*
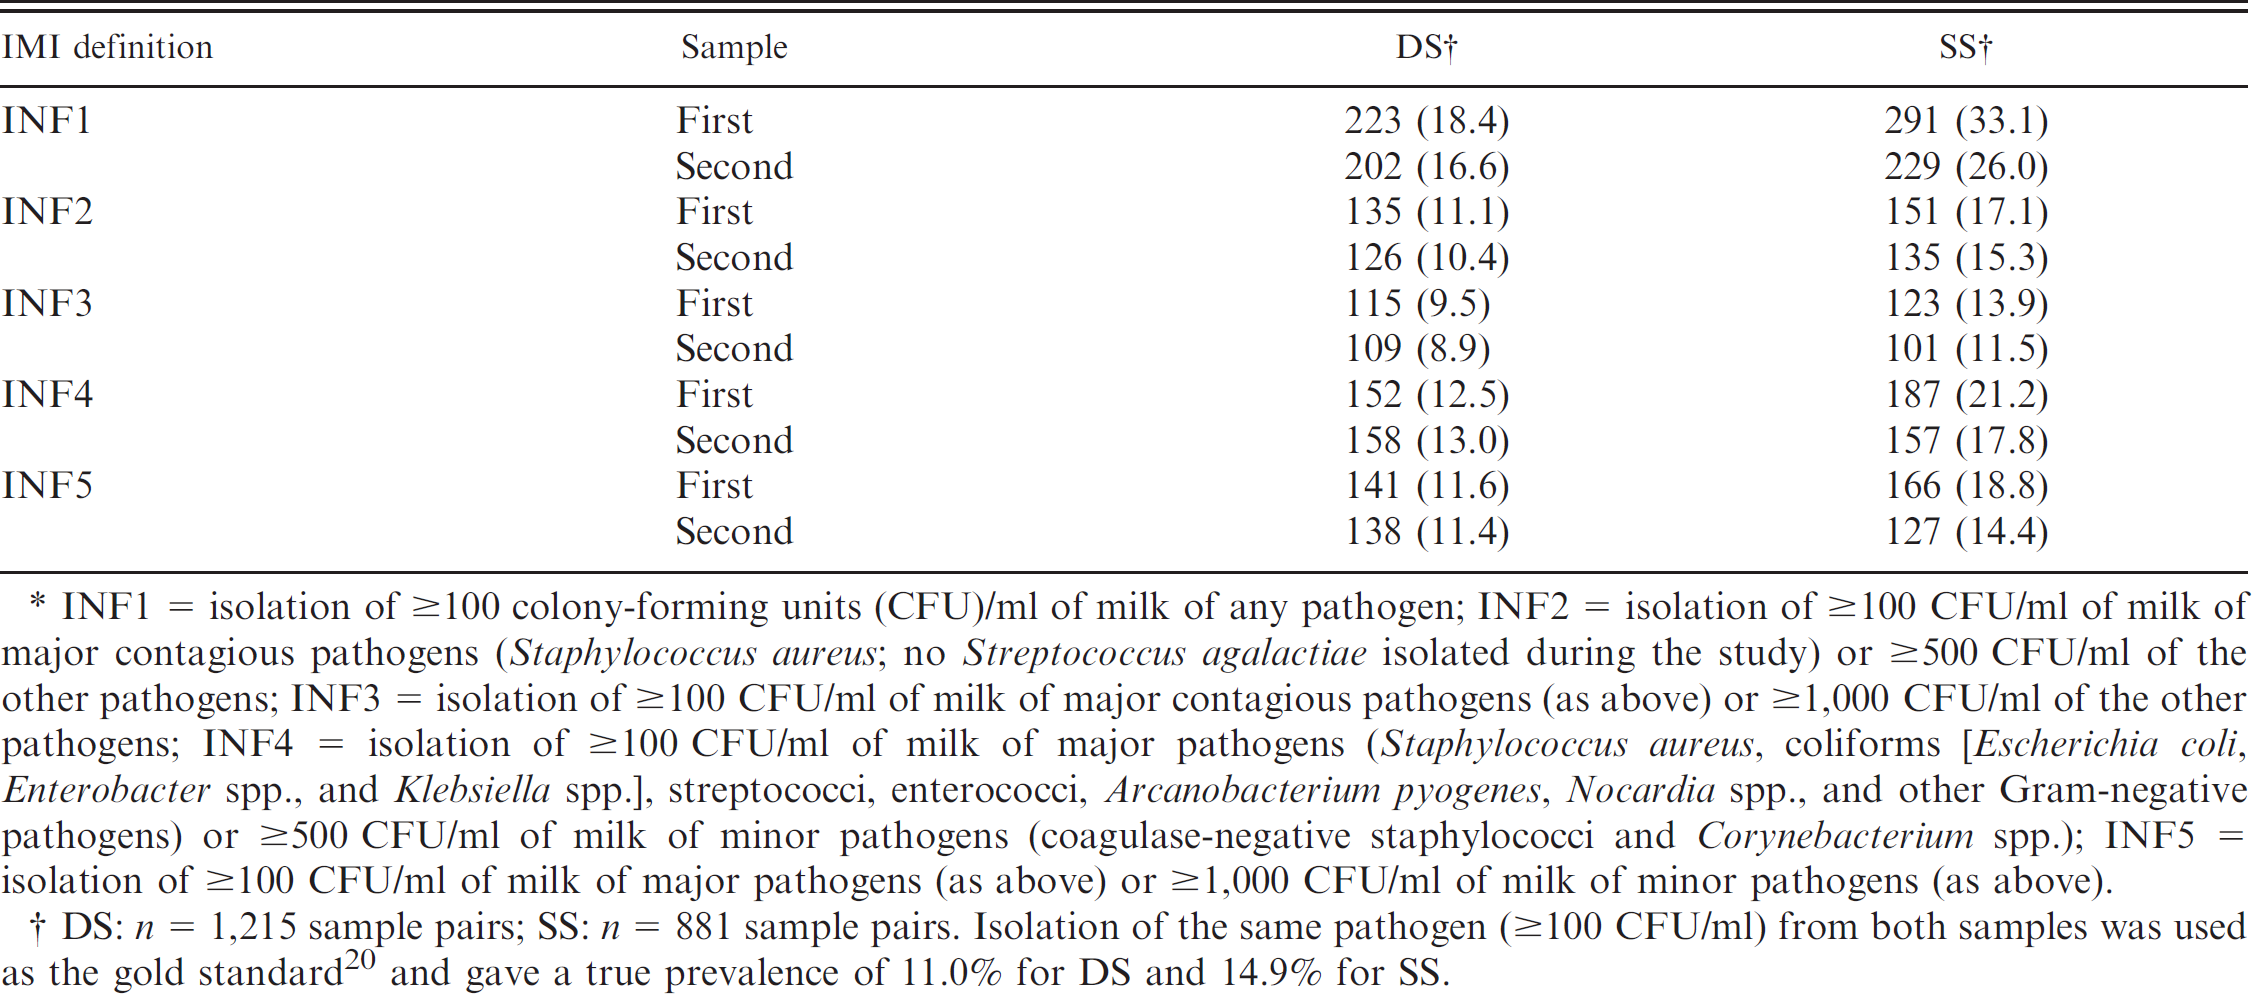
INF1 = isolation of ≥100 colony-forming units (CFU)/ml of milk of any pathogen; INF2 = isolation of ≥100 CFU/ml of milk of major contagious pathogens (Staphylococcus aureus;no Streptococcus agalactiae isolated during the study) or ≥500 CFU/ml of the other pathogens; INF3 = isolation of ≥100 CFU/ml of milk of major contagious pathogens (as above) or ≥1,000 CFU/ml of the other pathogens; INF4 = isolation of ≥100 CFU/ml of milk of major pathogens (Staphylococcus aureus, coliforms [Escherichia coli, Enterobacter spp., and Klebsiella spp.], streptococci, enterococci, Arcanobacterium pyogenes, Nocardia spp., and other Gram-negative pathogens) or ≥500 CFU/ml of milk of minor pathogens (coagulase-negative staphylococci and Corynebacterium spp.); INF5 = isolation of ≥100 CFU/ml of milk of major pathogens (as above) or ≥1,000 CFU/ml of milk of minor pathogens (as above).
DS: n = 1,215 sample pairs; SS: n = 881 sample pairs. Isolation of the same pathogen (≥100 CFU/ml) from both samples was used as the gold standard 20 and gave a true prevalence of 11.0% for DS and 14.9% for SS.
Percentage of agreement, positive agreement (PA), and negative agreement (NA) with 95% confidence intervals, McNemar's test (chi square P-value), and kappa statistics between the first and the second sample of a pair of duplicate samples (DS) and successive samples (SS) using different definitions of intramammary infection (IMI).*
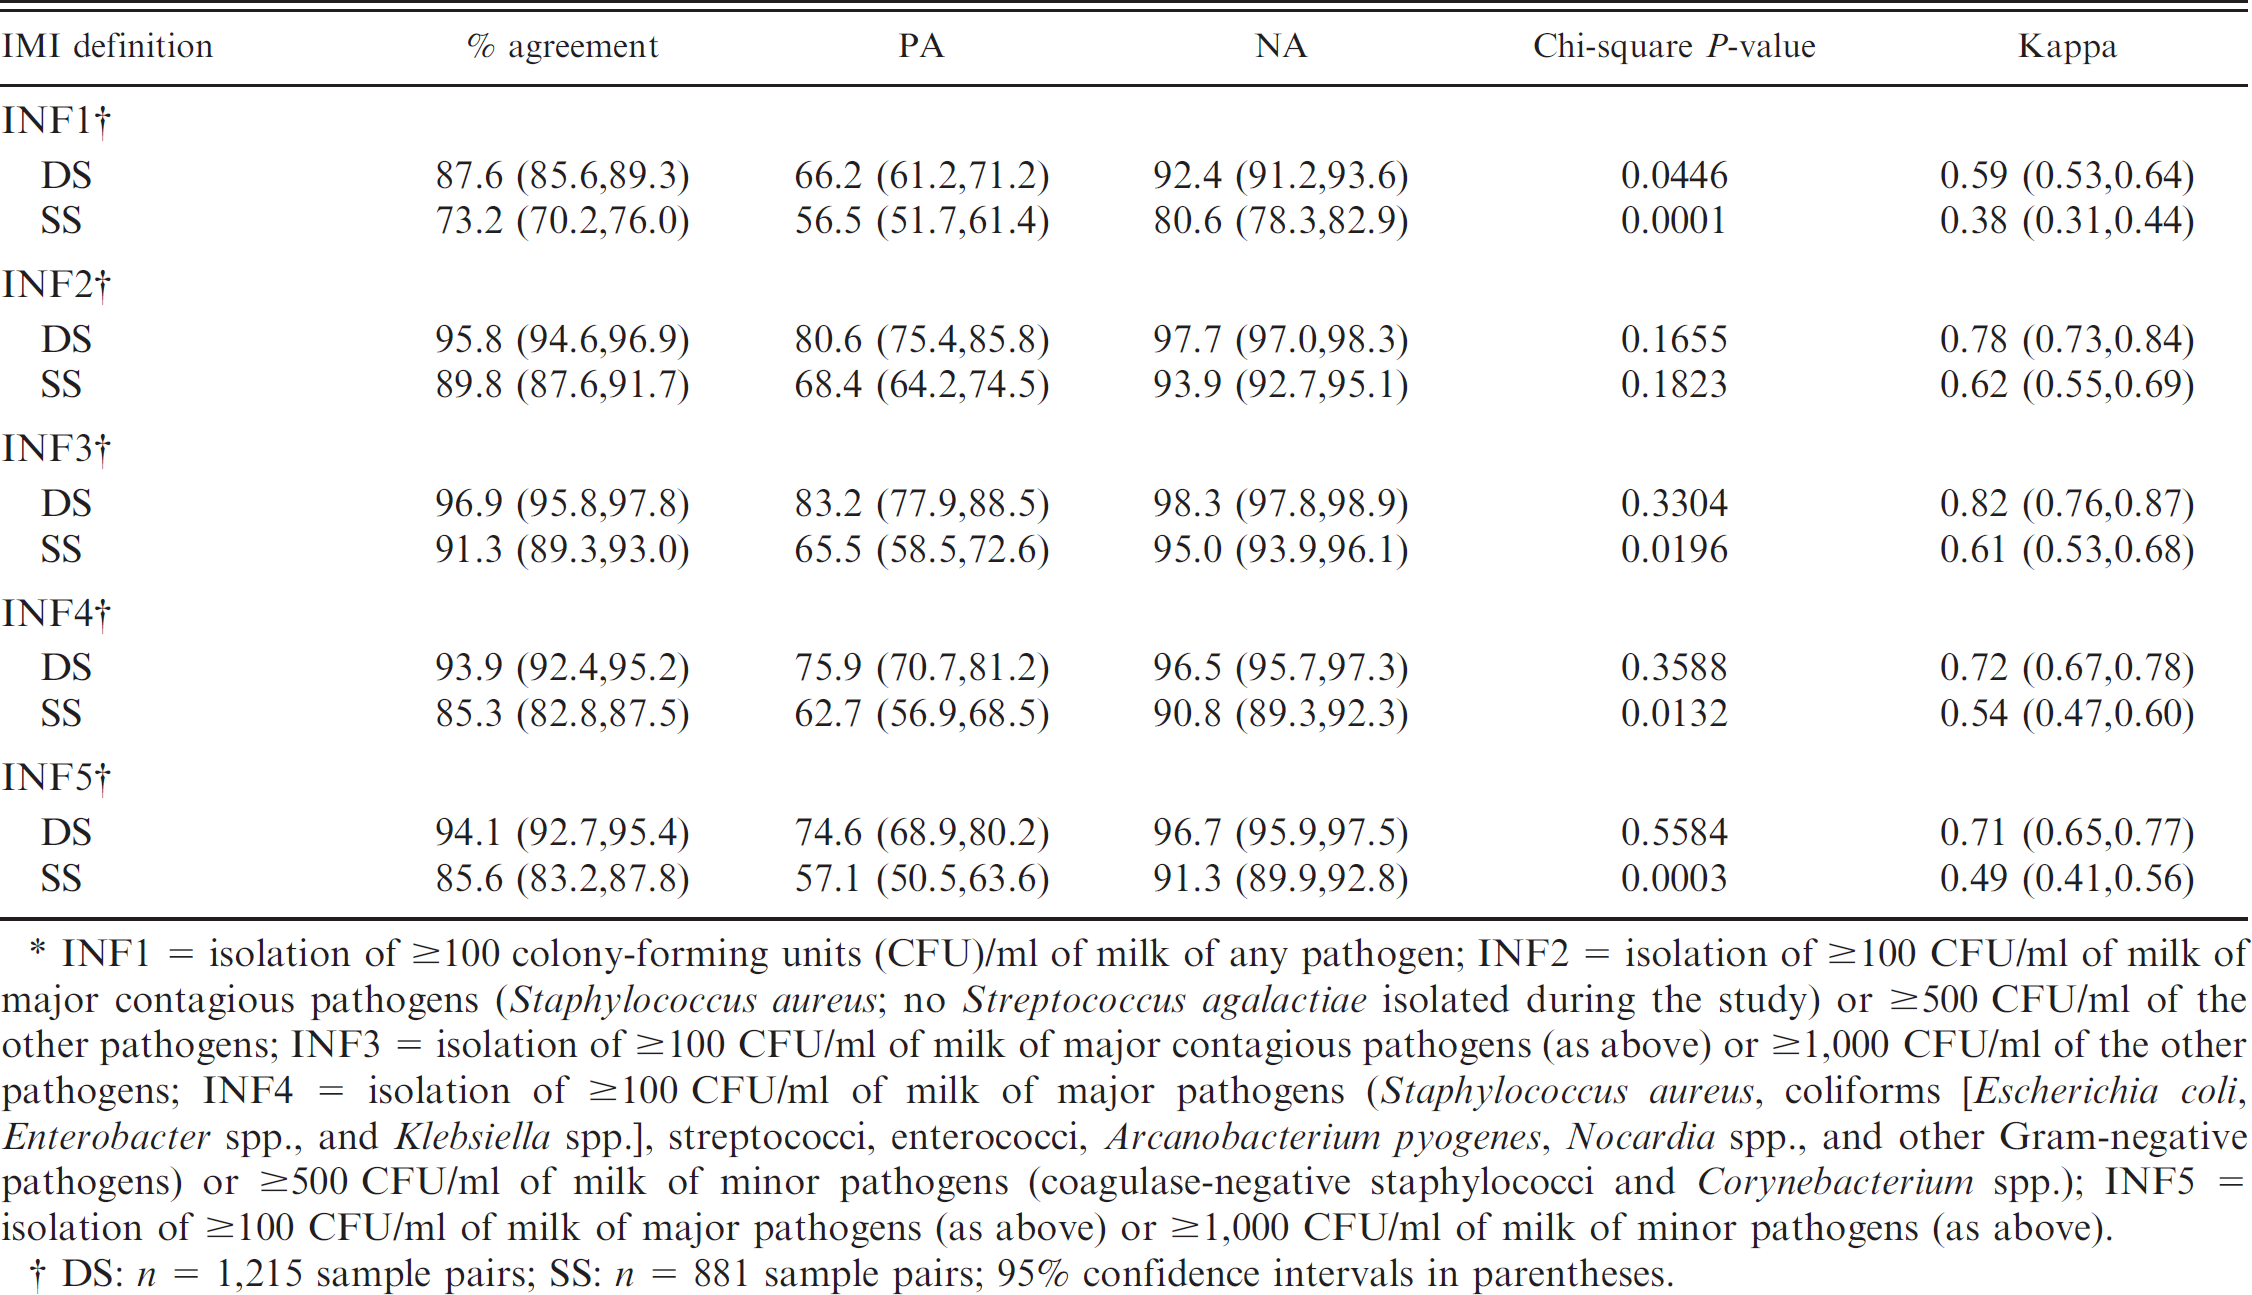
INF1 = isolation of ≥100 colony-forming units (CFU)/ml of milk of any pathogen; INF2 = isolation of ≥100 CFU/ml of milk of major contagious pathogens (Staphylococcus aureus; no Streptococcus agalactiae isolated during the study) or ≥500 CFU/ml of the other pathogens; INF3 = isolation of ≥100 CFU/ml of milk of major contagious pathogens (as above) or ≥1,000 CFU/ml of the other pathogens; INF4 = isolation of ≥100 CFU/ml of milk of major pathogens (Staphylococcus aureus, coliforms [Escherichia coli, Enterobacter spp., and Klebsiella spp.], streptococci, enterococci, Arcanobacterium pyogenes, Nocardia spp., and other Gram-negative pathogens) or ≥500 CFU/ml of milk of minor pathogens (coagulase-negative staphylococci and Corynebacterium spp.); INF5 = isolation of ≥100 CFU/ml of milk of major pathogens (as above) or ≥1,000 CFU/ml of milk of minor pathogens (as above).
DS: n = 1,215 sample pairs; SS: n = 881 sample pairs; 95% confidence intervals in parentheses.
The highest positive (83.2%) as well as negative (98.3%) agreement between paired DS samples was observed with INF3. In the SS, the highest positive agreement was observed with INF2 (68.4%), while the highest negative agreement was achieved with INF3 (95.0%). In all cases, INF1 provided the lowest positive and negative agreement (Table 4).
Number of infected quarters and apparent prevalence (in parentheses) of intramammary infections (IMI) based on the first and the second sample of duplicate (DS) and successive (SS) sample pairs stratified according to the type of pathogen isolated.*
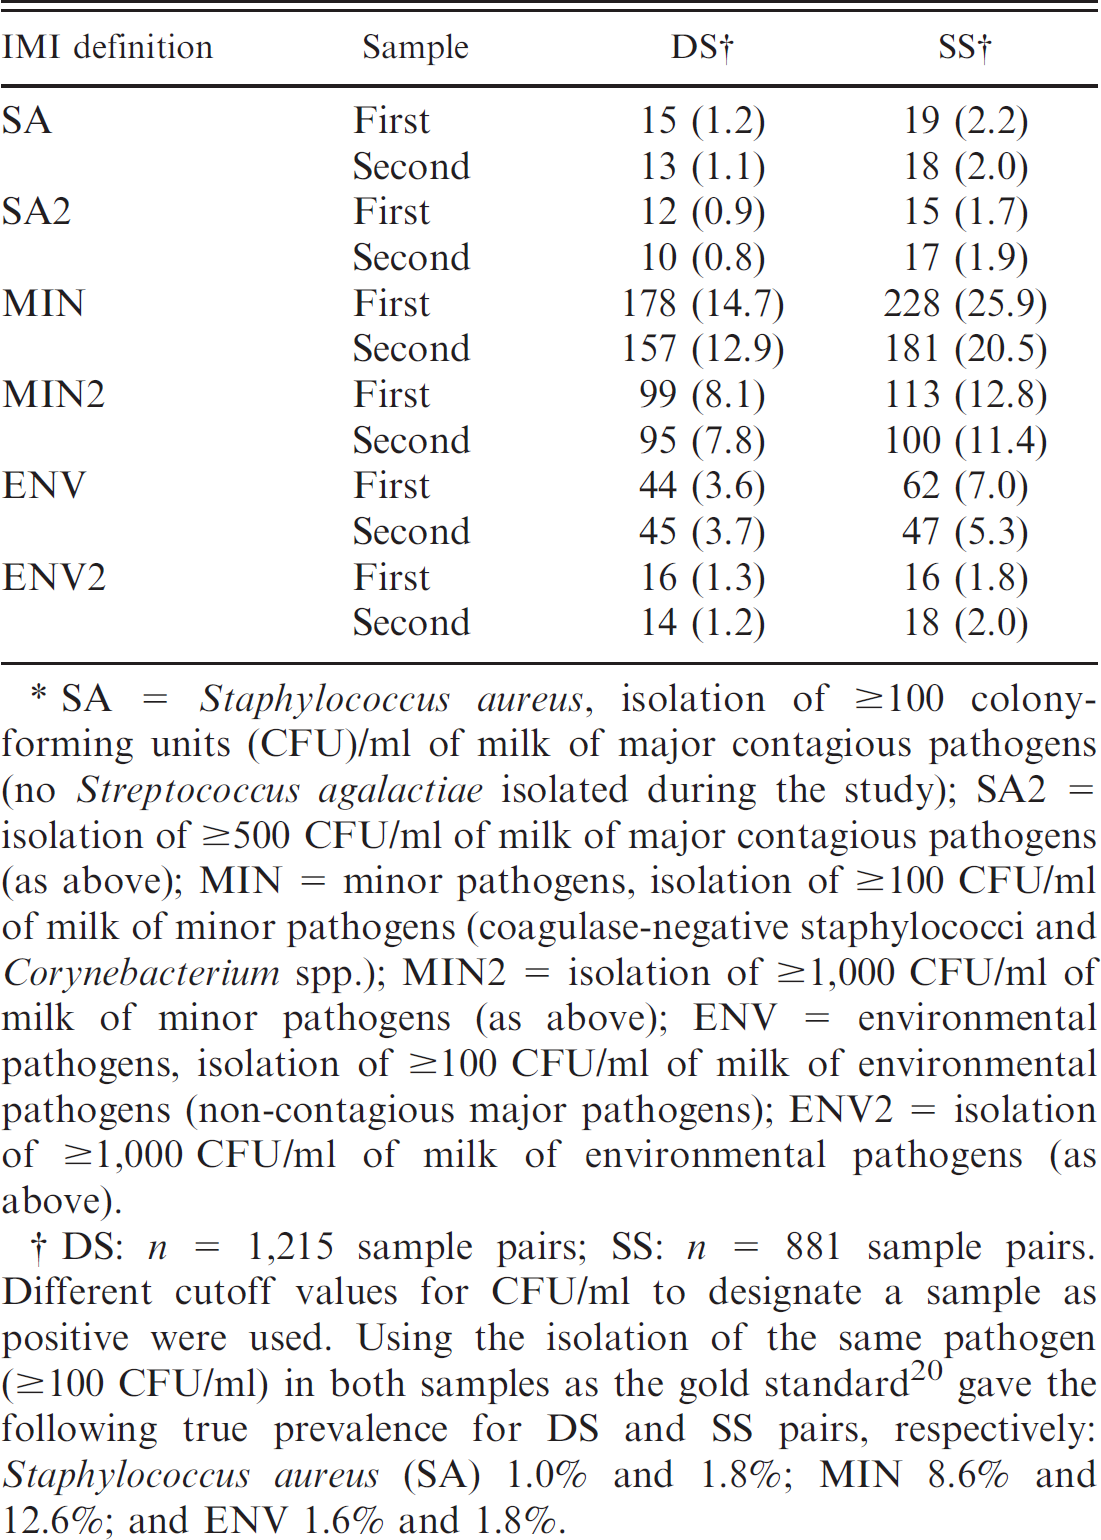
SA = Staphylococcus aureus, isolation of ≥100 colony-forming units (CFU)/ml of milk of major contagious pathogens (no Streptococcus agalactiae isolated during the study); SA2 = isolation of ≥500 CFU/ml of milk of major contagious pathogens (as above); MIN = minor pathogens, isolation of ≥100 CFU/ml of milk of minor pathogens (coagulase-negative staphylococci and Corynebacterium spp.); MIN2 = isolation of ≥1,000 CFU/ml of milk of minor pathogens (as above); ENV = environmental pathogens, isolation of ≥100 CFU/ml of milk of environmental pathogens (non-contagious major pathogens); ENV2 = isolation of ≥1,000 CFU/ml of milk of environmental pathogens (as above).
DS: n = 1,215 sample pairs; SS: n = 881 sample pairs. Different cutoff values for CFU/ml to designate a sample as positive were used. Using the isolation of the same pathogen (≥100 CFU/ml) in both samples as the gold standard 20 gave the following true prevalence for DS and SS pairs, respectively: Staphylococcus aureus (SA) 1.0% and 1.8%; MIN 8.6% and 12.6%; and ENV 1.6% and 1.8%.
Results from McNemar's chi-square test were nonsignificant for comparing the first and the second sample in DS using INF2, INF3, INF4, or INF5 (Table 4). This finding suggests that the 2 proportions positive, obtained with the first and the second sample using those IMI definitions, were equal. 22 A significant P-value from McNemar's test for INF1, on the other hand, indicated that the proportions of positive results in the 2 samples differed significantly when not adjusted for the number of CFU/ml of isolated organisms. As with the simple percentage of agreement, the highest chance-corrected agreement (kappa = 0.82) between culture results from the first and the second sample was observed when diagnosis was based on isolation of ≥100 CFU/ml of major contagious pathogens or ≥1,000 CFU/ml of all other pathogens (INF3) in DS. The 95% CIs of kappa for the definitions INF2–INF5, however, overlapped, suggesting no significant differences (Table 4). The true agreement (i.e., kappa) between the first and the second sample in SS was always lower than in DS (Table 4).
The apparent prevalence of different types of pathogens based on the first and the second sample is presented in Table 5. Prevalence of S. aureus as well as prevalence of environmental major pathogens in the study population was low (ranging between 0.8% and 2.2% and between 1.2% and 7.2%, respectively, depending on the IMI definition, the sampling strategy, and the sample). When evaluating agreement between the first and the second sample of DS for contagious pathogens (i.e., S. aureus [no Strep. agalactiae isolated during the study]) the overall agreement and negative agreement between the samples were excellent, 99.7% and 99.8%, respectively (Table 6). Positive agreement was also high (81.8–85.7%); however, lower than negative agreement. Two different CFU cutoffs for S. aureus were evaluated; while results for both were very similar, isolation of ≥100 CFU/ml gave a higher kappa value than a cutoff of 500 CFU/ml (0.86 vs. 0.82, not a significant difference, though, with the 95% CIs overlapping). Results were very similar with SS. Regarding both major environmental and minor pathogens, using a cutoff of 1,000 CFU/ml consistently provided higher agreement (overall, positive, negative, and kappa) than the lower cutoffs. (Only results with the cutoffs of 100 and 1,000 CFU/ml are presented in Table 6, because the results with 500 CFU/ml were very similar, but consistently lower than those with 1,000 CFU/ml). The 95% CIs for kappa statistics, and for the other agreements, using 100 and 1,000 CFU/ml cutoffs for minor pathogens (MIN and MIN2 in Table 6) did not overlap, indicating a significant difference in the level of agreement between these definitions. The overall agreement, as well as negative agreement between the definitions using cutoffs of 100 and 1,000 CFU/ml for environmental pathogens, was also significantly different. In SS, with the cutoff of 100 CFU/ml for both minor and environmental pathogens, McNemar's test gave a significant result (P < 0.05), suggesting that proportions positive in the 2 samples differed significantly using these IMI definitions. A similar, significant result was obtained with 1,000 CFU/ml for minor pathogens.
Percentage of agreement, positive agreement (PA), and negative agreement (NA) with 95% confidence intervals, McNemar's test (chi-square P-value), and kappa statistics between the first and the second sample of a pair of duplicate (DS) and successive samples (SS), stratified according to the type of pathogen isolated and using different cutoff values for colony-forming units (CFU)/ml to designate a sample as positive.*
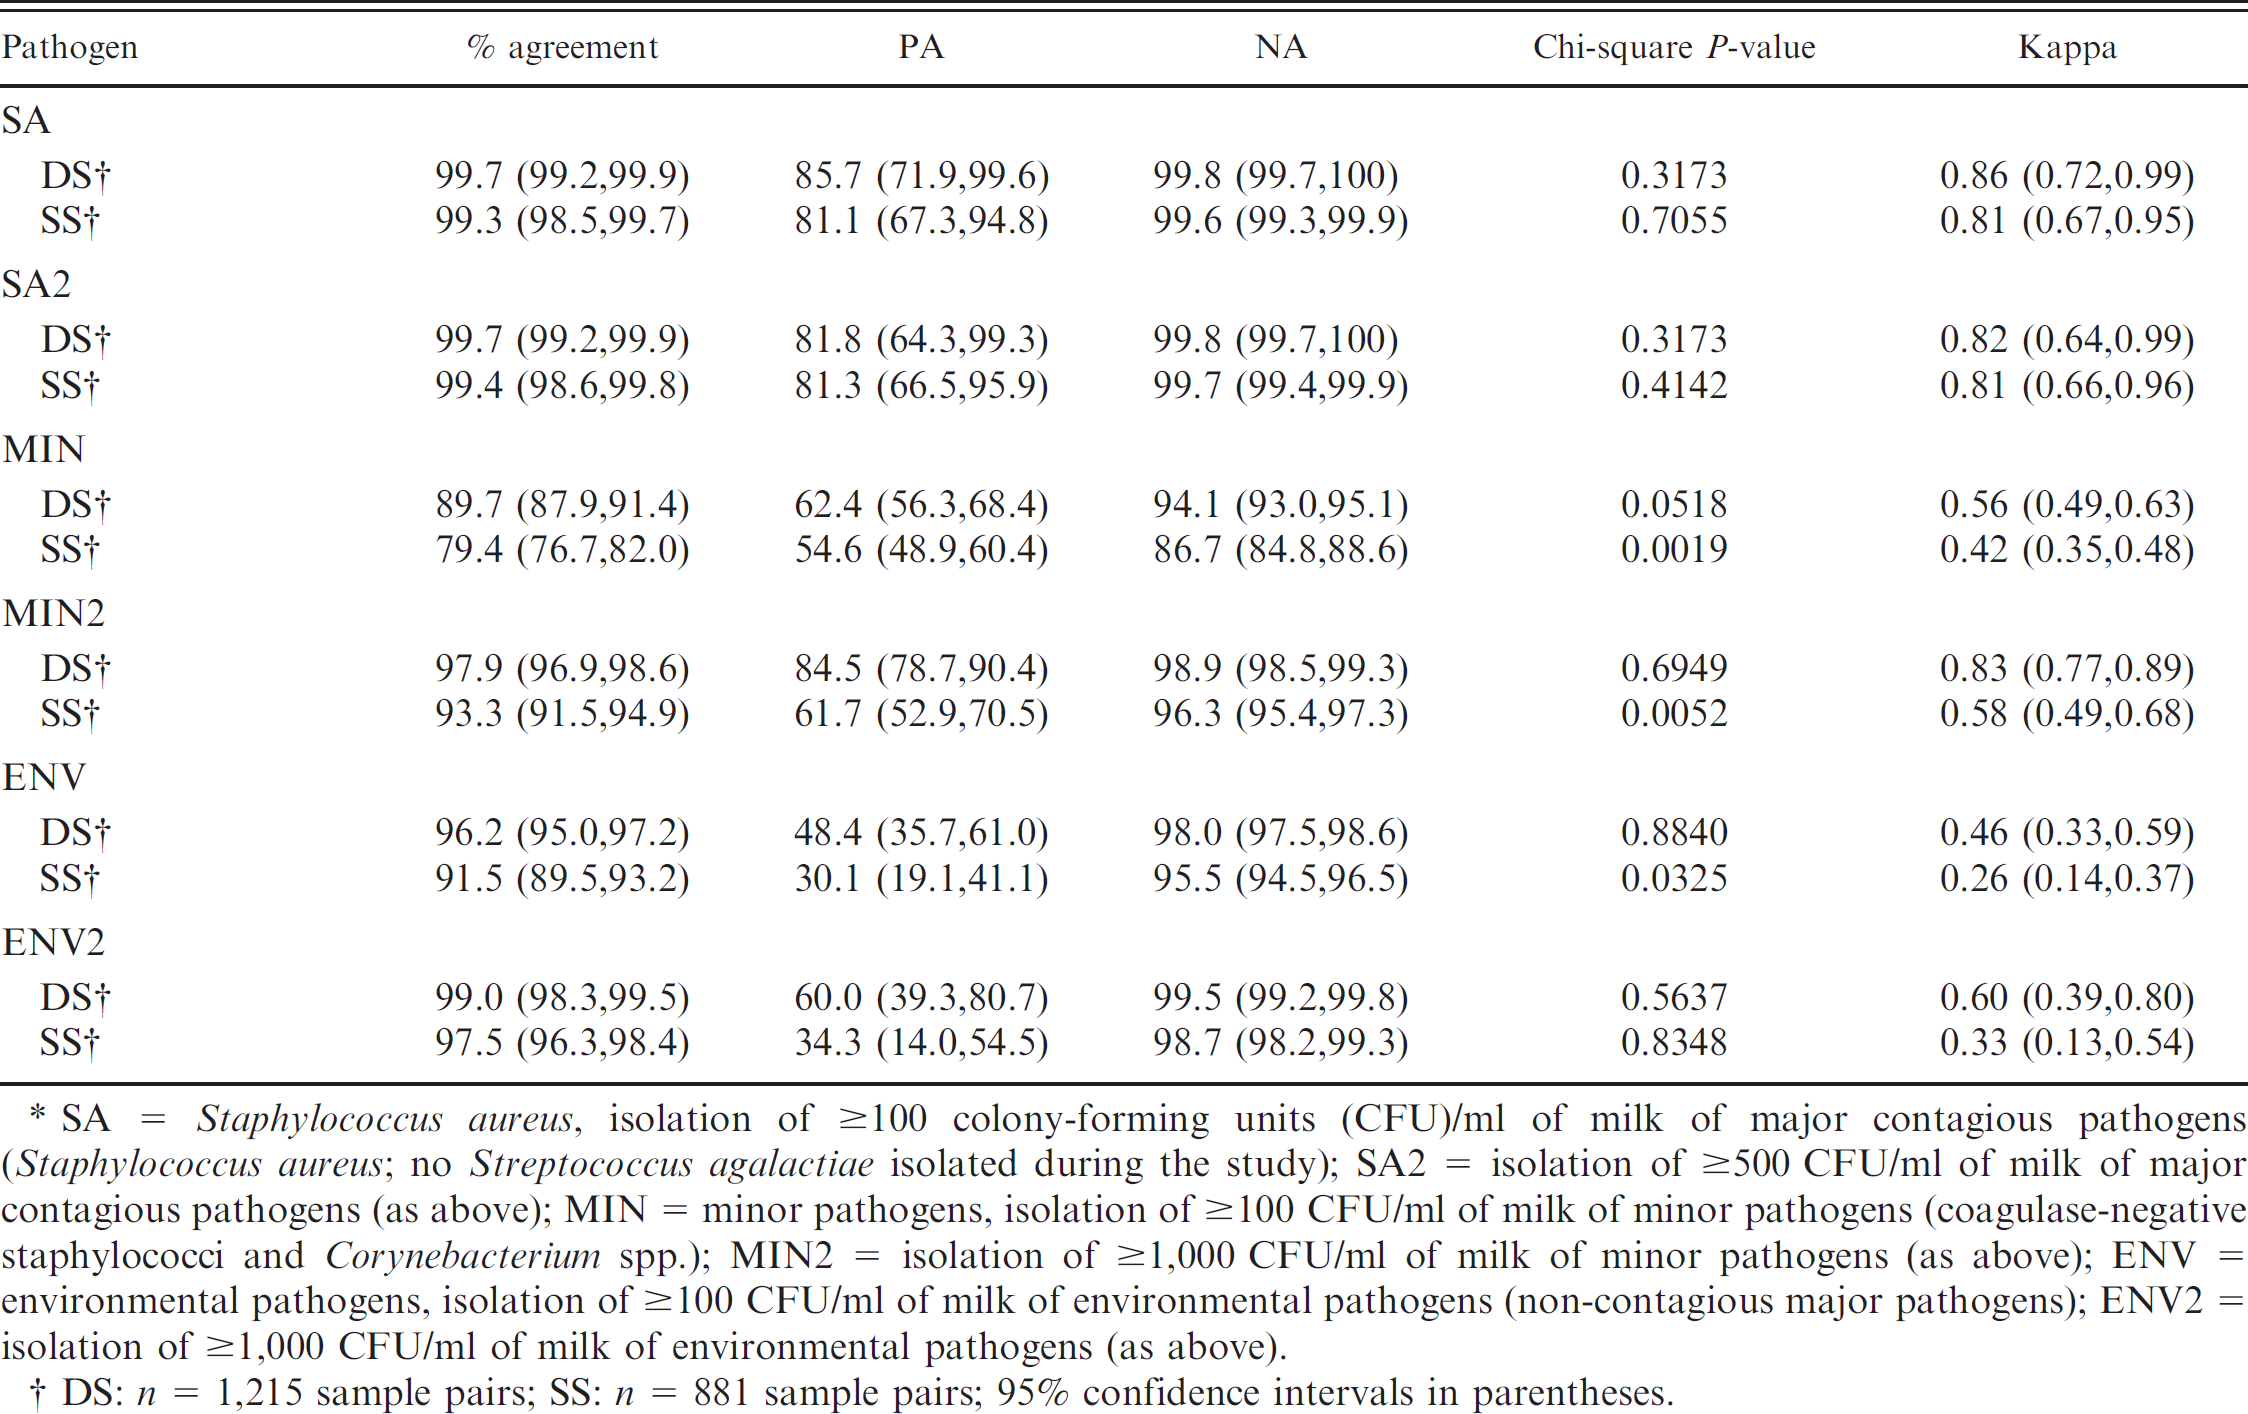
SA = Staphylococcus aureus, isolation of ≥100 colony-forming units (CFU)/ml of milk of major contagious pathogens (Staphylococcus aureus; no Streptococcus agalactiae isolated during the study); SA2 = isolation of ≥500 CFU/ml of milk of major contagious pathogens (as above); MIN = minor pathogens, isolation of ≥100 CFU/ml of milk of minor pathogens (coagulase-negative staphylococci and Corynebacterium spp.); MIN2 = isolation of ≥1,000 CFU/ml of milk of minor pathogens (as above); ENV = environmental pathogens, isolation of ≥100 CFU/ml of milk of environmental pathogens (non-contagious major pathogens); ENV2 = isolation of ≥1,000 CFU/ml of milk of environmental pathogens (as above).
DS: n = 1,215 sample pairs; SS: n = 881 sample pairs; 95% confidence intervals in parentheses.
Sensitivity and specificity
A 100% sensitivity (Se) for single samples with INF1 was automatically obtained because INF1 used the same cutoff of 100 CFU/ml for all organisms as the gold standard, which required both samples to be positive in order for the quarter to be positive. Otherwise, the highest sensitivity for single samples was obtained with INF4 (Se = 86.0), followed by INF2 (Se = 82.4) in DS as well as in SS (sensitivities 82.2 and 78.5 for INF4 and INF2, respectively; Table 7). Diagnosis of IMI from single samples using INF3 had the highest specificity when compared with the gold standard from DS and SS (98.7% and 95.5%, respectively). The highest correct classification rates i.e., efficiency) of single samples were obtained using INF2 and INF3 (95.9%) in DS and INF3 (91.5%) in SS (Table 7). INF1 provided the lowest specificity and efficiency in both DS and SS.
Discussion
Implementing an appropriate milk sampling scheme depends on the nature and overall objective of a study. 16 Traditional milk sampling schemes for research purposes have involved obtaining multiple samples per quarter. The recommended gold standard (duplicate or consecutive samples interpreted in series) aims at increasing specificity and reducing false positives. 20 However, in field trials, determination of prevalence of infection can be based on a single, aseptically collected milk sample. 16 Generally, in large field studies, single milk samples are collected under the assumption that the presence of misclassification bias will be equally distributed among the experimental groups. However, any diagnostic test interpretation approach, whether aiming at increased sensitivity or specificity, will have its advantages and disadvantages, as sensitivity and specificity of a test typically behave inversely.
Universal standards or guidelines for the number of CFU/ml required to diagnose IMI do not exist and, in many cases, no information is provided in the published literature regarding this aspect of IMI diagnosis. Isolation of ≥100 CFU/ml of major contagious pathogens has been commonly used to diagnose IMI from quarter milk samples collected from cows with clinical 2,14 and subclinical mastitis. 21,30,32 However, some common mastitis pathogens can colonize teat skin and/or the teat canal without causing IMI 20 or can be environmental contaminants in milk. Therefore, isolation of >100 CFU/ml of milk may be required as an indication of a true IMI with these types of pathogens. When noncontagious major pathogens are considered, higher cutoffs for CFU/ml have been suggested and used as a requirement to diagnose IMI (e.g., ≥200 CFU/ml, 2 400 CFU/ml, 21 or 500 CFU/ml 23,26,27 ). The results of the current study agree with the suggested higher cutoffs, as the agreement for the major environmental pathogens between the first and the second sample was highest using a cutoff value of 1,000 CFU/ml. Using a cutoff of 500 CFU/ml produced similar results, but a slightly lower kappa value, thus suggesting a better true agreement with 1,000 CFU/ml. For minor pathogens, thresholds of 1,000 and 4,000 CFU/ml have been used to declare an IMI. 2,21 In the present study, using a cutoff of 1,000 CFU/ml for minor pathogens provided an almost perfect agreement7 between the first and the second sample in DS (kappa = 0.83, which was significantly higher than kappa = 0.56 with a cutoff of 100 CFU/ml). This finding supports the use of higher cutoffs for these types of organisms. The percentages of agreement and kappa statistics (agreement beyond chance) were almost perfect also for contagious pathogens (in the present study, this applies specifically to S. aureus, as no Strep, agalactiae was isolated). Positive agreement and kappa statistic for S. aureus were higher (even though not statistically significantly) when using a cutoff of 100 CFU/ml instead of 500 CFU/ml, which would suggest that isolating at least 100 CFU/ml of S. aureus from a single sample will detect the infections as effectively as duplicate or successive samples. These results also indicated that overall, at least 75% of all samples positive for S. aureus shed the organism in considerable numbers (>2,000 CFU/ml), similar to results reported previously. 30
Sensitivity, specificity, efficiency, and the 95% confidence intervals (in parentheses), for the first sample of a pair as compared with the pairs of duplicate samples (DS) and successive samples (SS) collected at dry-off for 5 different definitions of intramammary infection (IMI).*
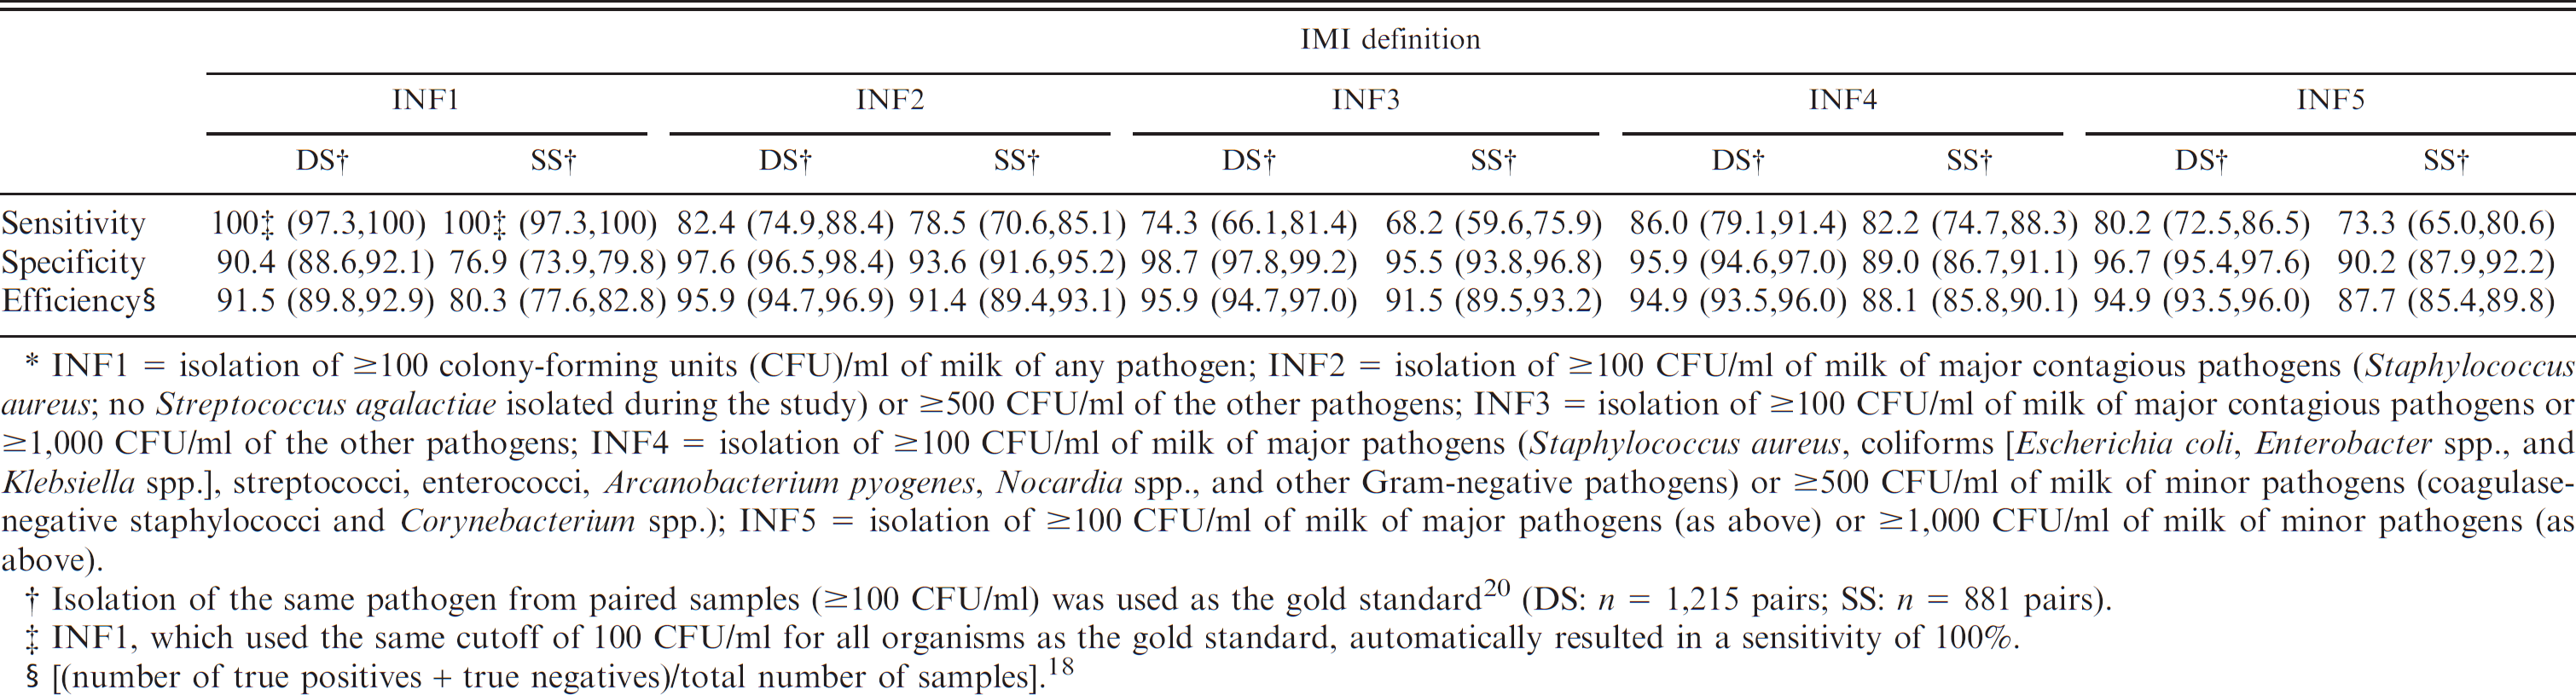
INF1 = isolation of ≥100 colony-forming units (CFU)/ml of milk of any pathogen; INF2 = isolation of ≥100 CFU/ml of milk of major contagious pathogens (Staphylococcus aureus; no Streptococcus agalactiae isolated during the study) or ≥500 CFU/ml of the other pathogens; INF3 = isolation of ≥100 CFU/ml of milk of major contagious pathogens or ≥1,000 CFU/ml of the other pathogens; INF4 = isolation of ≥100 CFU/ml of milk of major pathogens (Staphylococcus aureus, coliforms [Escherichia coli, Enterobacter spp., and Klebsiella spp.], streptococci, enterococci, Arcanobacterium pyogenes, Nocardia spp., and other Gram-negative pathogens) or ≥500 CFU/ml of milk of minor pathogens (coagulase-negative staphylococci and Corynebacterium spp.); INF5 = isolation of ≥100 CFU/ml of milk of major pathogens (as above) or ≥1,000 CFU/ml of milk of minor pathogens (as above).
Isolation of the same pathogen from paired samples (≥100 CFU/ml) was used as the gold standard 20 (DS: n = 1,215 pairs; SS: n = 881 pairs).
INF1, which used the same cutoff of 100 CFU/ml for all organisms as the gold standard, automatically resulted in a sensitivity of 100%.
(number of true positives + true negatives)/total number of samples]. 18
Previous studies have reported a percentage of agreement between the first and second samples of a pair, using different sampling schemes. 8,17,24 To the authors' best knowledge, this is the first study reporting separately positive and negative agreements in addition to overall agreement and kappa statistics with different CFU/ml cutoff values in evaluating IMI diagnoses. Overall, almost 80% of all samples collected during the current study were negative for growth, so it was not surprising that the negative agreement was consistently higher, regardless of the type of pathogens, sampling strategy, or the IMI definitions used, than the positive agreement. It has been reported that kappa may depend on sensitivity and specificity of the 2 tests being compared, 33 and that different distribution for prevalence (i.e., a substantial imbalance in the marginal totals of a 2 × 2 table either vertically or horizontally) can create paradoxical results on kappa and decrease kappa value despite a high observed percentage agreement. 9 As a consequence, when prevalence of a disease is low, results obtained for kappa may be lower than expected 9 even if the test under evaluation had high sensitivity and specificity. 33 In the present study, this would mean that the calculated kappa values may be biased downwards.
A high percentage of agreement between results from the first and the second samples in DS using INF2, INF3, INF4, and INF5 were observed in the present study. All of those IMI definitions considered and adjusted for the epidemiology of different types of mastitis-causing organisms by using higher cutoffs for CFU/ml for organisms that could get into the milk as a result of environmental contamination and/or as a part of normal skin flora. The observed high agreement suggested that, overall, culture results obtained with single samples would well represent the results obtained with the currently recommended gold standard using duplicate samples interpreted in series. Even though a direct comparison is not possible, raw agreement between the first and the second sample when INF3, INF4, or INF5 were used was similar to estimates reported earlier (i.e., 96.2%17 and 94.1%24) between the first and the second sample of paired DS.
The first and the second DS had significantly higher kappa coefficients and percentages of agreement than those of SS, as indicated by nonoverlapping 95% CIs, regardless of the definition of IMI used (Table 4). It is expected that samples collected at the same point in time (i.e., DS) are likely to yield the same pathogens (Table 1). When SS are collected, it has been proposed that milk samples collected after milk removal (i.e., postmilking samples) will have less contamination 31 and that some pathogens that colonize the streak canal without causing intramam-mary infection will be removed by milking. 20 Therefore, lower agreement can be expected in SS than in DS when the results from the first sample are compared with the results of the second sample, and this was observed in the current study.
Some researchers have recommended evaluating sensitivity and specificity of culture results instead of percentage of agreement, when results from 2 tests are compared to diagnose IMI. 6,30 The disadvantage of this approach is that arbitrarily one of the tests needs to be considered “the truth,” even though “the truth” is, in fact, unknown. The efficiency (correct classification rate) of a test can also be used as a measure of agreement because it gives the probability that culture results from single samples and the gold standard agree. 18 Sensitivities, specificities, and efficiencies were calculated in the present study for single samples using the 4 different IMI definitions (INF2–INF5), which adjusted for the number of CFU/ml to declare the sample positive. Interpretation of DS or SS in series (≥100 CFU/ml of the same organisms in both samples) was used as the gold standard. The first IMI definition, INF1, used the same cutoff for all organisms as the gold standard, so it automatically achieved 100% sensitivity, but specificity and efficiency for INF1 were the lowest among all the IMI definitions. Otherwise, the highest sensitivity was obtained using INF4 (isolation of ≥100 CFU of major pathogens and ≥500 CFU/ml of all other organisms) and highest specificity using INF3. These test characteristics, including efficiency, however, did not differ meaningfully between different IMI definitions, as all the 95% CIs within a sampling strategy overlapped. The limitation of the present study was that there was no method of determining which of the “diagnostic tests” gave the ultimate truth; thus even the gold standard could have provided a false result. Quantification of the level of inflammation through somatic cell counts (or other measures of inflammation) in milk could provide some assistance in determining the true IMI status. 16
A test with high specificity will have few false positives, while a test with high sensitivity will have few false negatives. The goal of the current standard of collecting at least 2 samples and interpreting them in series is to minimize false-positive results. Achieving this goal will increase false negatives. The goal of having few false positives may also be achieved by collecting single quarter milk samples and then adjusting for the number of organisms based on the source of infection. More S. aureus has been recovered from the first sample than from the second sample of paired SS. 11 In the current study, the overall percentage of samples positive for S. aureus was low (≤2.2%) and there did not appear to be any meaningful difference in the percentage of samples positive between the first and the second samples. Even though some strains of S. aureus can be found in the skin, most mastitis cases related to this pathogen in dairy herds are caused by strains highly adapted to the mammary gland. 34 Based on the results of the present study, S. aureus appeared to be shed quite consistently and in relatively high numbers, thus isolation of this pathogen from a single sample could be considered indicative of a true IMI. And, with respect to contagious pathogens, it may be better to err on the side of caution and to get a false-positive rather than a false-negative result.
The epidemiology of mastitis pathogens is an important factor that should be taken into account when diagnosing IMI. Etiology of bovine mastitis has changed in the last 40 years, 13 evolving from mastitis mainly caused by major contagious pathogens to mastitis caused by microorganisms that are found mostly in the environment or as part of the normal skin flora. Consideration of this evolving epidemiology of mastitis is important when deciding the best way to define and diagnose IMI. In the present study, the percentage of major contagious pathogens (i.e., S. aureus) recovered from samples collected at dry-off was low, and minor pathogens represented the majority of isolates. Collection of samples in the present study was limited to dry-off only and represented only subclinical infections. However, as the objective of the current study was to determine the level of agreement between results from the first and the second sample of a pair, the restricted time point is not considered a major limitation. In addition, the data were analyzed separately for different types of organisms. Furthermore, attention was given to proper identification of different pathogens during culture of samples, resulting in isolation of a variety of mastitis pathogens that can be easily isolated from quarter samples collected at different time points during the lactation.
In conclusion, any sampling and diagnostic test interpretation strategy will have its advantages and disadvantages, which need to be considered while keeping the goals of testing in mind. Diagnosis of IMI requires consideration of multiple factors, from the sampling strategy and interpretation of the culture results to the epidemiology of the causal organisms. If the same results can be obtained with single milk samples as with multiple samples in bovine IMI diagnosis, an obvious advantage with single sample collection is that a more precise estimation of disease frequency (i.e., incidence or prevalence) will be achieved, as a larger sample size will be realized with the same resources. Results of the current study indicate that the agreement between the first and the second sample of duplicate sample pairs is high, when the number of CFU/ml is adjusted by considering the epidemiology of the organisms. This finding suggests that bovine IMI can be accurately diagnosed with single samples. Using a cutoff of 100 CFU/ml for contagious pathogens and a cutoff of 1,000 CFU/ml for major environmental and minor pathogens will serve as a sensible approach for diagnosing bovine IMI with single milk samples.
Acknowledgements
This study was supported by U.S. Department of Agriculture (USDA) Animal Health Formula Funds through the Council for Research at Ohio State University College of Veterinary Medicine and by the National Research Initiative of the USDA Cooperative State Research, Education and Extension Service (grant 200535204-15587). The authors appreciate the cooperation of the farm managers who were involved in this project and thank Yayoi Fukuhara for her invaluable help.
Footnotes
a.
Remel Inc., Lenexa, KS.
b.
StataCorp LP, College Station, TX.