
Abstract
The present study investigated 3 methods of hemoglobin (Hb) determination in goats using the ADVIA 120 and ADVIA 2120 systems. Ethylenediaminetetraacetic acid anticoagulated caprine blood samples (n = 40 goats) were subjected to Hb determination via the cyanmethemoglobin methods in both instruments and a novel, cyanide-free, colorimetric method with the ADVIA 2120. Statistical analysis of the data included a linear regression, Passing-Bablok regression, and Bland-Altman diagram. Colorimetric Hb results determined with both analyzers had excellent correlation (r = 0.98); however, a mean proportional bias of −19.1% was present in comparison to the reference method. There also was excellent agreement between cellular Hb concentrations when measured with both analyzers (r = 0.96), and the constant bias was close to zero. However, imprecision was higher compared to colorimetric methods. Excellent to fair agreement was evident for all calculated erythrocyte and Hb variables. Because of the excellent correlation between the ADVIA 120 and ADVIA 2120, the cyanide-free method of Hb determination could be used with caprine blood specimens; however, the proportional bias must be considered.
Keywords
Introduction
In goats, hematologic analyses are problematic in impedance-based hematology analyzers due to the lack of a species-specific software program and the extremely low mean cellular volume of caprine erythrocytes, which have been considered the smallest in domestic animals. 8 The ADVIA 120 hematology system a is a laser-based, multispecies analyzer that is equipped with a veterinary software program that has been specifically adapted and validated for use with caprine blood samples (Püsch M: 2002, Hämatologiesystem ADVIA 120, Softwareadaptation und Evaluation bei den Tierarten Schaf und Ziege [Hematology analyzer ADVIA 120, software adaptation and evaluation for the species sheep and goat]. Dissertation, Justus-Liebig-Universität, Giessen, Germany. Abstract in English). Moreover, reference intervals for goats have been established for the ADVIA 120 hematology system. 14
Recently, the ADVIA 2120 was introduced by Bayer HealthCare (now Siemens). This new bench-top hematology analyzer is based on the ADVIA 120 hematology system and designed for use by medium-to-large volume clinical pathology laboratories. An advantage of the ADVIA 2120 analyzer is the option to operate using a cyanide-free, colorimetric method 4,13 to determine hemoglobin (Hb) concentration; the potassium cyanide used for the standard cyanmethemoglobin colorimetric analysis has caused enormous environmental concern. 13 Alkaline, cyanide-free reagents are used for the cyanide-free colorimetric measurement of Hb. These reagents consist of an alkaline borate solution (borate 50 mmol/l, pH 11.2) and a surfactant (N,N-dimethyl-laurylamine N-oxide, 20 g/l), which causes erythrocyte hemolysis, facilitating the oxidation of heme iron by structural disruption of the protein so that it is exposed to the bulk reagent solution. 13 Most of the salt bridges of Hb are lost due to the alkaline pH of the reagent. 13 In the absence of cyanide, further disruption of the Hb protein structure occurs, generating iron(III)-hemes that are ligated by 1 water molecule and 1 hydroxide ion. 13 The ligated hemes are solubilized by surfactant micelles resulting in a green end product that can be photometrically detected. 13 In the ADVIA 120 hematology system, however, Hb measurement is performed with the standard cyanmethemoglobin colorimetric method, which has been recommended as the standard analytic method by the International Committee for Standardization in Hematology. 18 This cyanmethemoglobin method has been modified for use in the ADVIA hematology system. 10
In both the ADVIA 120 and ADVIA 2120 analyzers, Hb is detected by flow cytometry by cyanide and cyanide-free methods. Flow cytometry is based on low- and high-angle laser light scatter and is used for the measurement of Hb concentration and volume of individual erythrocytes (red blood cells [RBC]). 12 Low- and high-angle light-scatter signals are used to calculate the cellular volume and Hb concentration. 12 Flow cytometry provides a determination of the actual Hb mass within the erythrocyte by multiplying the erythrocyte volume by the Hb concentration on a cell-by-cell basis, 12 allowing differentiation of extracellular and intracellular Hb. 16 Thus, a novel analyte designated the “corpuscular Hb concentration mean” (CHCM) has been introduced, which is unique for the H*1 hematology system and the ADVIA 120 and ADVIA 2120 analyzers. The CHCM indicates the average concentration of Hb within individual erythrocytes as measured by flow cytometry. 2 In comparison, the mean corpuscular Hb concentration (MCHC) is a calculated value that indicates the average Hb concentration within erythrocytes based on an analysis of total colorimetric Hb in a hemolyzed sample. Thus, hemolysis or lipemia may result in a falsely elevated MCHC, whereas the CHCM is not affected. 2 During hematologic analysis, the CHCM and MCHC are automatically compared by the ADVIA software, and a system flag is generated if a discrepancy of more than 5% 14 or 1.18 mmol/l (1.9 g/dl 11 using a conversion factor of 1.61, as recommended in the literature 11 ) is detected between these values. The mass of human and caprine Hb differs slightly 1 ; however, this is of no clinical significance regarding the analytic guidelines proposed by the manufacturer. Thus, calculation of the difference between MCHC and CHCM provides an accurate quantification of the degree of hemolysis in a given sample. 16
“Cellular Hb” (i.e., Hb detected by flow cytometry) can be calculated from the CHCM by using the following formula: cellular hemoglobin [HGB] = CHCM x (RBC x mean corpuscular volume [MCV])/1000. This calculation is automatically performed during routine measurements; however, the resultant value is not routinely displayed by the analyzer. As for MCHC and CHCM, only a minimal difference between total colorimetric Hb and cellular Hb is expected in the absence of hemolysis or lipemia. In human blood specimens, good agreement has been reported between hematology values determined by the ADVIA 120 using the standard cyanide colorimetric method and the ADVIA 2120 operating with the cyanide-free reagent. 6,7 Similar agreement between both analytic methods was obtained in canine, feline, and equine blood specimens, but Hb measured with the cyanide-free method was overestimated compared to the reference method, with a mean proportional bias ranging from −19.4% to −22.0%. 3
To the authors' knowledge, studies have not been performed to evaluate the use of the cyanide-free method of Hb determination in goats. Therefore, the present study was designed to compare these 3 methods of Hb measurement. Colorimetric analysis of total Hb was performed using the cyanide-free method (ADVIA 2120) or the cyanide-based standard method of analysis (ADVIA 120). In addition, cellular Hb concentration was determined by flow cytometry in both analyzers. Moreover, calculated analytes derived from the Hb measurement, such as the mean corpuscular Hb (MCH) and MCHC, were also compared. Variables that are needed for the calculation of these parameters, such as the number of erythrocytes (RBC count), the hematocrit (Hct) value, and the MCV were also included in the evaluations, as they might have had an influence on the results along with the Hb measurement.
Materials and methods
Study design
The prospective study was performed using 40 fresh (<4 hr old) consecutive caprine blood samples that were anticoagulated with tripotassium ethylenediamine tetra-acetic acid. All blood samples were submitted for analysis to the Department of Veterinary Clinical Sciences, Clinical Pathology and Clinical Pathophysiology (Justus-Liebig-University Giessen, Giessen, Germany). Caprine blood samples were included regardless of any underlying disease. The only inclusion criteria was the presence of a sufficient sample volume for analysis with the ADVIA 120 and ADVIA 2120 systems and the absence of clots.
The hematology analyzers were operated by the technicians of the Central Laboratory (Faculty of Veterinary Medicine, Justus-Liebig University Giessen, Giessen, Germany), who were experienced in the use of both hematology analyzers. Internal quality control materials b provided by the manufacturer were run daily. External quality assessment was performed for both analyzers using human control material c every second week and veterinary control samples d every 3 months.
For all caprine samples, a complete blood cell (CBC) count and automated differential count were done in the ADVIA CBC/Diff mode. The agreement between both the ADVIA 120 and ADVIA 2120 hematology analyzers was determined for all measured parameters including Hb and CHCM. Moreover, RBC, Hct, and MCV also were measured because they were needed to calculate the cellular Hb concentration of erythrocytes (cellular Hb) and the erythrocyte indices (MCH, MCHC). The MCH and MCHC are automatically calculated with the ADVIA 120 and ADVIA 2120 software using the following formulas and measured analytes: MCH = (Hb/RBC) x 10, and MCHC = [Hb/(RBC x MCV)] x 1000. 2 The ADVIA 2120 system was equipped with the veterinary software version 5.3.1.-MS, and the ADVIA 120 was installed with the veterinary software version 3.1.8.0-MS.
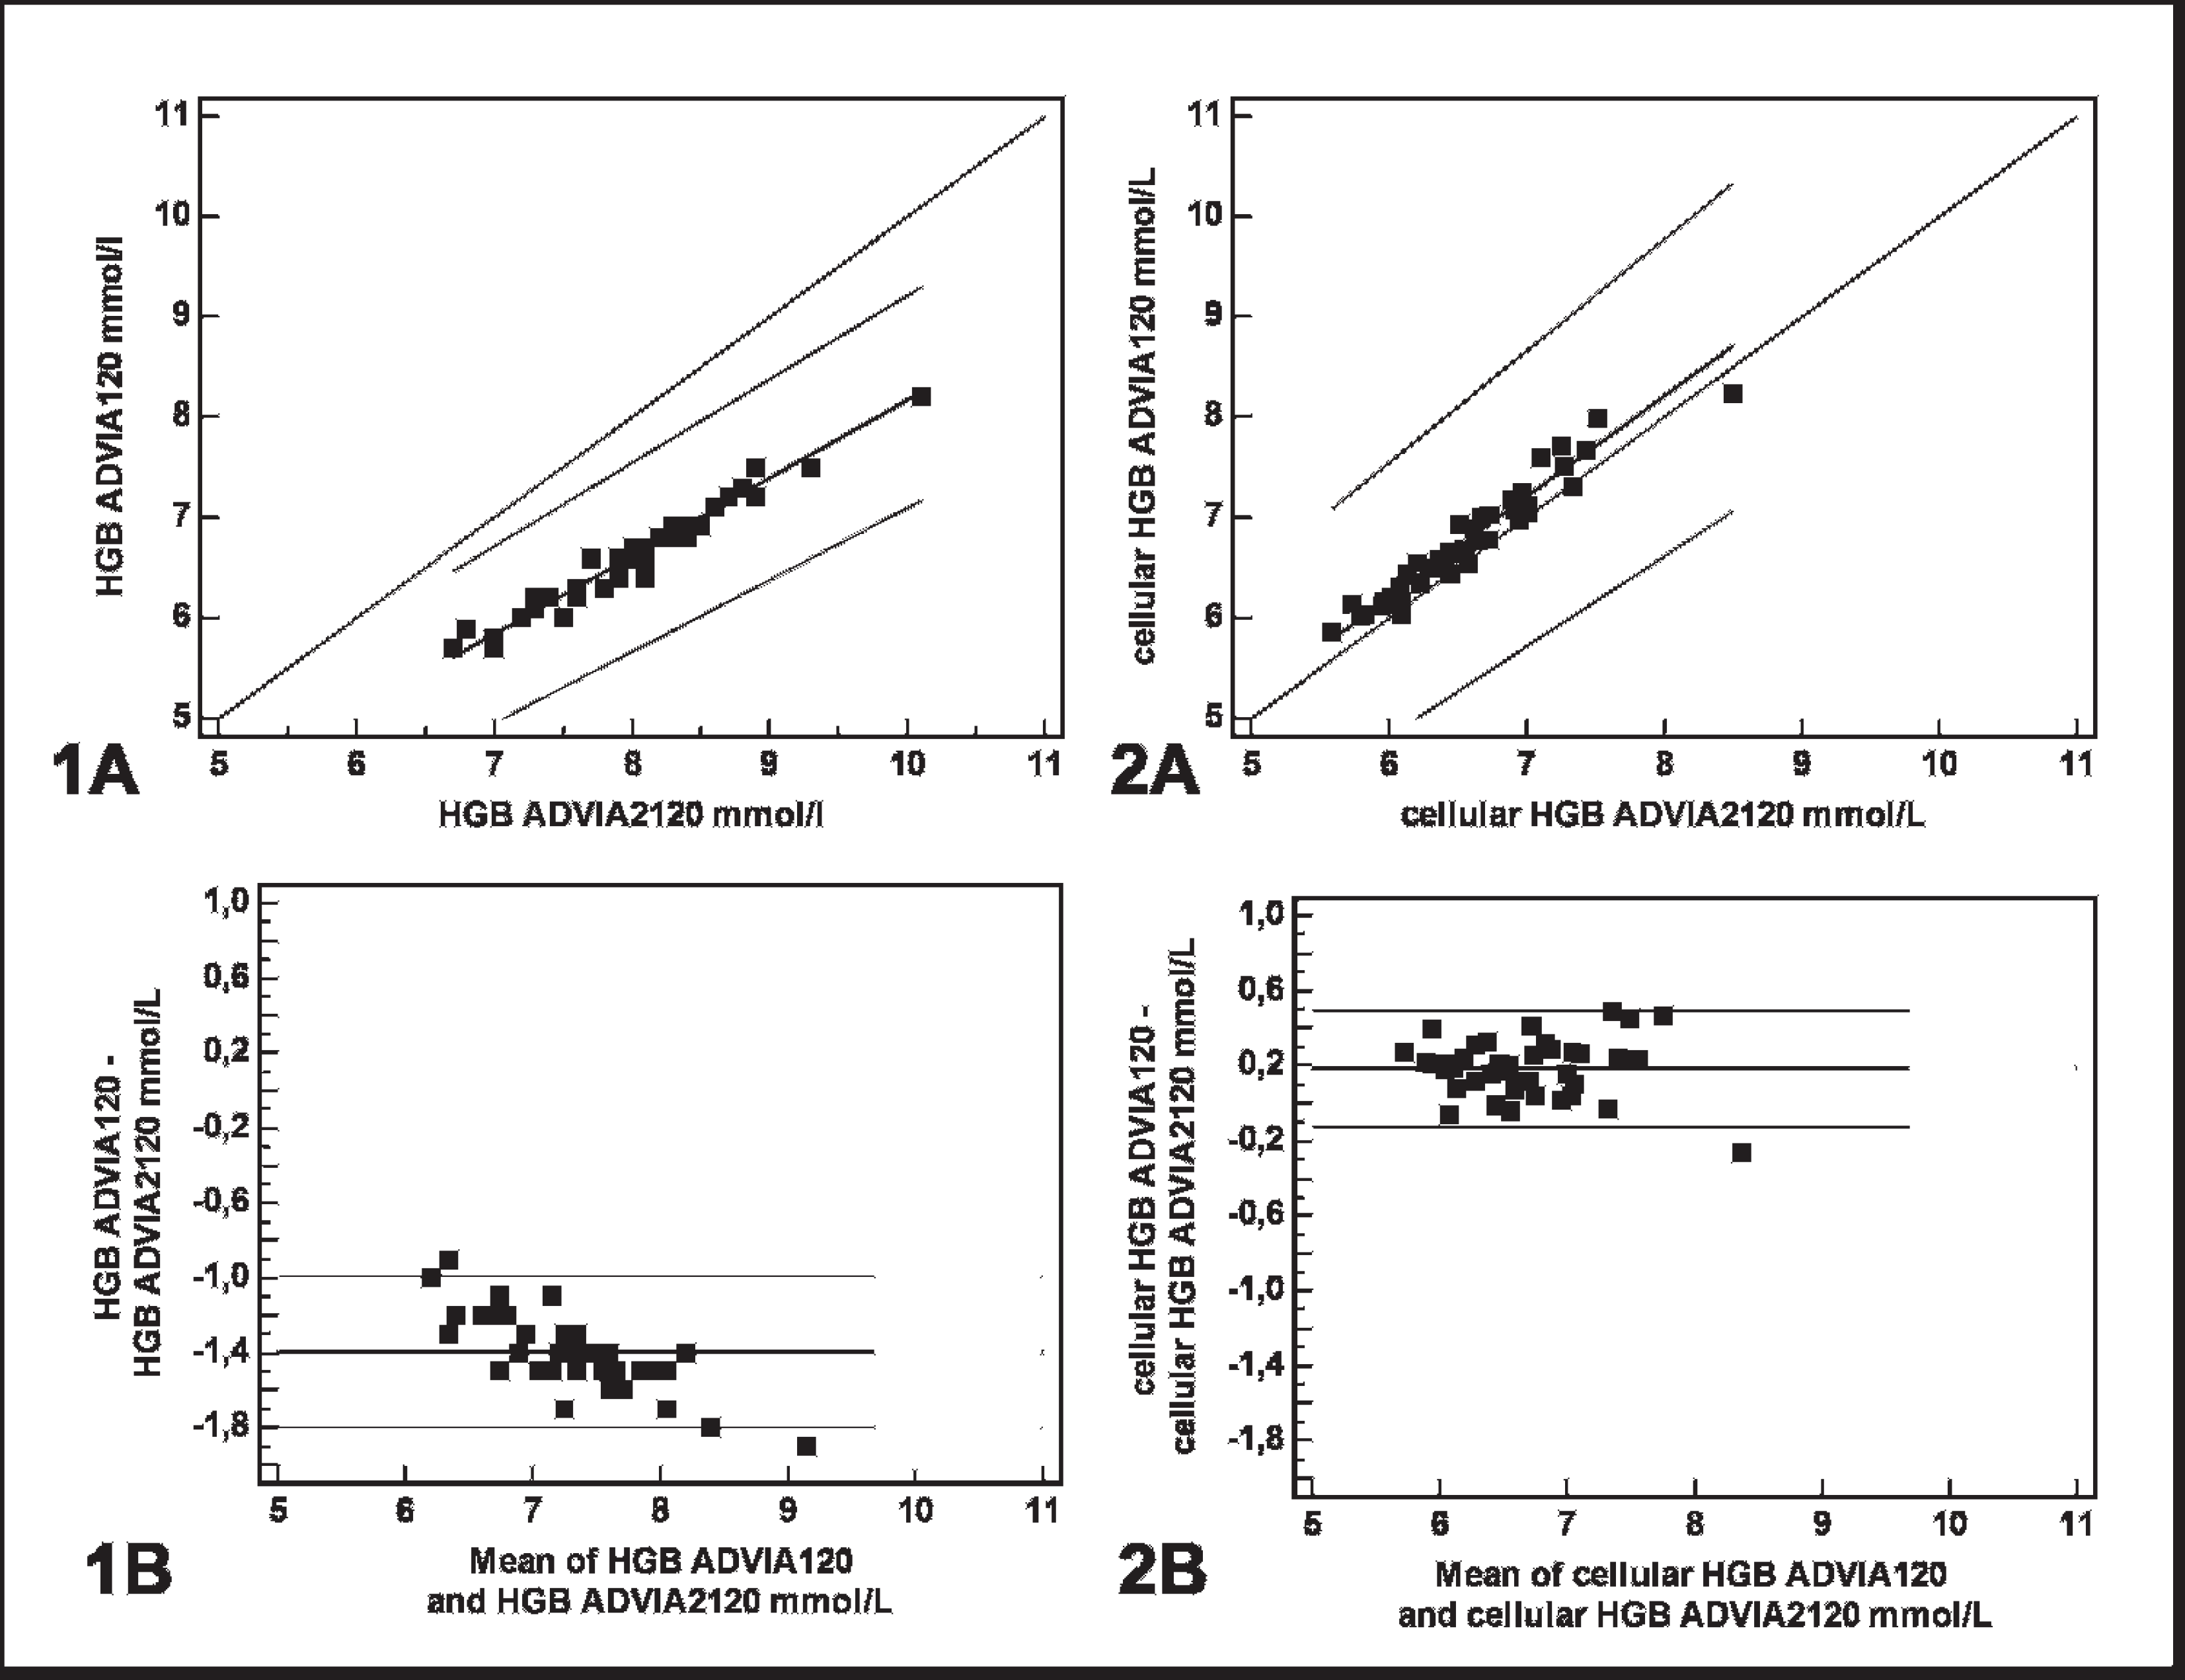
Agreement between the ADVIA 2120® (x axis) and ADVIA 120® (y axis) for colorimetric measurement of (total) hemoglobin (Hb) using a novel, cyanide-free analytic technique and the cyanide-based reference method.
Statistical analyses
Data was analyzed using Graph Pad Prism e and MedCalc statistical software. f A Kolmogorov-Smirnov test was performed to verify the assumption of normality. For statistical analysis, the ADVIA 120 system was considered the reference method, and results obtained with both analyzers were compared with a linear regression and Passing-Bablok regression analyses. Moreover, Bland-Altman diagrams depicting the mean bias ±1.96 standard deviation were prepared. Correlations were ranked as excellent (r = 0.93-0.99), good (r = 0.80-0.92), fair (r = 0.59-0.79), or poor (r < 0.59).
Results
Excellent correlation was observed between the Hb results determined with the ADVIA 120 using the standard cyanide-based method and with the ADVIA 2120 using the cyanide-free method (Fig. 1). However, a mean proportional bias of −19.1 % was present (Fig. 1). Cellular Hb calculated from the CHCM had excellent correlation between both analyzers, with a minimal constant bias (Fig. 1); however, slightly higher imprecision was present compared to the results obtained with the colorimetric measurement using either the cyanide-based or cyanide-free analytic method (Fig. 1). Results for analytes derived from the Hb measurement and those needed for mathematic calculations are presented in Table 1. There was excellent agreement between the ADVIA 2120 and ADVIA 120 systems for the MCV, Hct, RBC, and MCH, with all correlation coefficients being higher than 0.93. For variables that were not based on the colorimetric Hb measurement, such as Hct, RBC, and MCV, a minimal bias was present. Similar to the colorimetric Hb determination, the MCH assayed with the cyanide-free method was proportionally overestimated compared to the reference method, and it had a mean bias of −17.3% (Table 1). As shown in Table 1, the MCHC had fair agreement between both methods, with a mean constant bias of −10.1%.
Agreement between the ADVIA 120® and the ADVIA 2120® for the determination of hemoglobin (Hb) and associated parameters in blood specimens from goats (n = 40).*
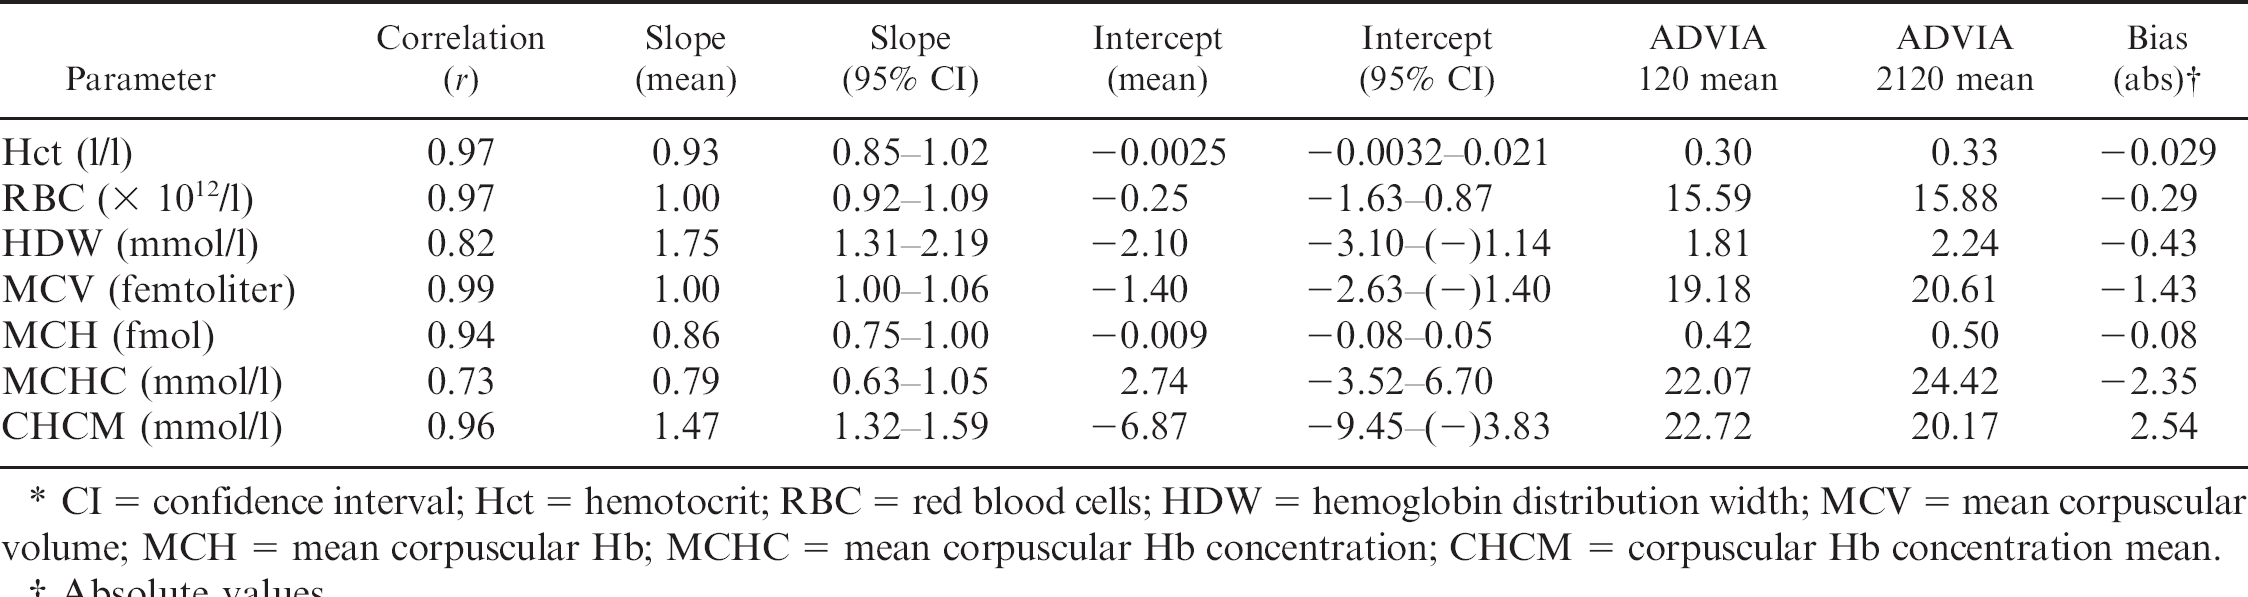
CI = confidence interval; Hct = hemotocrit; RBC = red blood cells; HDW = hemoglobin distribution width; MCV = mean corpuscular volume; MCH = mean corpuscular Hb; MCHC = mean corpuscular Hb concentration; CHCM = corpuscular Hb concentration mean.
Absolute values.
Discussion
As demonstrated in the present study, an excellent correlation between the colorimetric (total) Hb values was obtained with the ADVIA 2120 using the cyanide-free method and the ADVIA 120 cyanide-based method. A similar agreement between both the cyanide-free method and the standard cyanide-based method also was reported on blood specimens from humans, 6 dogs, cats, and horses. 3 Although a bias was not evident in the laboratory results for human specimens, 6 a mean proportional bias of −21.0%, −22.0%, and −19.4% was demonstrated for specimens from dogs, cats, and horses, respectively. 3 The cause for this mean proportional bias of approximately −20% in veterinary specimens analyzed by the cyanide-free method remains unclear. It can be hypothesized that differences in Hb structure and molecular mass may be responsible for the systematic error demonstrated in blood specimens from goats and other animal species. 1 Additionally, the erythrocytes of some species showed highly different susceptibility toward lysis induced by H2O2 and 2,2′-azobis (2-amidinopropane) dihydrochloride. 15 However, it is unlikely that proportional bias can be attributed to the Hb structure because a bias was not reported for blood specimens from humans with diseases caused by abnormalities in the Hb molecule, such as sickle-cell anemia and α-thalassemia. 6 Moreover, goats, dogs, cats, and horses 1 also differ in their Hb structure, so a variable bias would be expected if the systematic error was, in fact, caused by differences in the configuration of the Hb molecule. Variations in the instrument settings of the ADVIA 120 and the ADVIA 2120 are a further explanation for the presence of systematic error; however, this can be excluded because both analyzers demonstrated similar performance during internal and external quality control. In instances of high correlation (r = 0.99 or greater) and high precision of measurement, it is generally accepted that ordinary linear regression analysis can be used to estimate the errors between 2 methods. 17 Therefore, the slope and intercept of the regression line can be used to calculate the expected Hb values using the cyanide-based reference method. Including the formula of the regression line for goats in a Laboratory Information System or in the veterinary software of the ADVIA 2120 would enable veterinary laboratories to operate this analyzer with the cyanide-free method in future. However, the mean values for the proportional bias (Table 1) should be used with caution, as they are not representative for individual analyses. As expected, only a minimal constant bias close to zero was present for the cellular Hb (Fig. 1), which was also reported in animal species other than goats. 3 Minimal differences between measurements could have been caused by slight variations among the laser light adjustments of the analyzers. As for blood specimens from dogs, cats, and horses, 3 cellular Hb can be used for blood specimens from goats without prior adjustment of the veterinary software. A disadvantage, however, is that precision is lower for the cellular Hb in goat specimens, which has also been observed in blood specimens from dogs, cats, horses, 3 and people. 9 This lower precision may be attributed to light scattering by erythrocyte membranes or incomplete isovolumetric sphering of erythrocytes prior to analysis. 9 Moreover, additional light, which is reflected from internal flow cell surfaces and from hydrodynamically focused streams that ensheath particulate material, may cause variations in signal size or strength, both of which are detected by flow cytometry. Even if a small portion of this reflected light returned to the detector, it would substantially increase the likelihood of light fluctuations and beam noise. 5
As random errors may be accumulative, the agreement between calculated variables such as the MCH and MCHC was lower than the agreement between directly measured analytes. This has also been demonstrated for blood specimens from noncaprine animal species, 3 but has not been evaluated in human blood specimens.
Footnotes
a.
Siemens AG, Erlangen, Germany.
b.
ADVIA® TESTpointTM, 3 levels, Siemens AG, Erlangen, Germany.
c.
RIQAS, Randox Laboratories Ltd., Crumlin, County Antrim, UK.
d.
Veterinary Laboratories Agency Quality Assurance Unit, Sutton Bonington, Loughborough, Leicestershire, UK.
e.
GraphPad Software Inc., San Diego, CA.
f.
MedCalc for Windows, version 9.0.1.1, MedCalc Software, Mariakerke, Belgium.