
Abstract
Error recording and management is an integral part of a clinical laboratory quality management system. Analysis and review of recorded errors lead to corrective and preventive actions through modification of existing processes and, ultimately, to quality improvement. Laboratory errors can be divided into preanalytical, analytical, and postanalytical errors depending on where in the laboratory cycle the errors occur. The purpose of the current report is to introduce an error management system in use in a veterinary diagnostic laboratory as well as to examine the amount and types of error recorded during the 8-year period from 2003 to 2010. Annual error reports generated during this period by the error recording system were reviewed, and annual error rates were calculated. In addition, errors were divided into preanalytical, analytical, postanalytical, and “other” categories, and their frequency was examined. Data were further compared to that available from human diagnostic laboratories. Finally, sigma metrics were calculated for the various error categories. Annual error rates per total number of samples ranged from 1.3% in 2003 to 0.7% in 2010. Preanalytical errors ranged from 52% to 77%, analytical from 4% to 14%, postanalytical from 9% to 21%, and other error from 6% to 19% of total errors. Sigma metrics ranged from 4.1 to 4.7. All data were comparable to that reported in human clinical laboratories. The incremental annual reduction of error shows that use of an error management system led to quality improvement.
Introduction
Error recording and management is an important part of any clinical laboratory quality management system (QMS), and all QMS require the identification and monitoring of errors. 18 Veterinary laboratories participating in accreditation schemes such as those from the International Organization for Standardization (ISO) or quality improvement initiatives may be required to have formal processes for identifying opportunities for improvement.5,9,10 For example, although the European College of Veterinary Clinical Pathology (ECVCP, http://www.esvcp.com) has no specific guidelines regarding error management, facilities applying for recognition as a training laboratory for the ECVCP residency program are required to submit a copy of the laboratory’s Quality Plan. The plan must include details of internal and external quality control (QC) procedures for various departments. Likewise, the American Society of Veterinary Clinical Pathology (ASVCP) does not discuss error management in their QC Guidelines; however, recording of sample quality problems and client feedback is specifically recommended (http://www.asvcp.org/pubs/pdf/ASVCPQualityControlGuidelines.pdf). In an article discussing the relevance to and implementation of ISO 15189 in veterinary laboratories, the authors state that out of 12 laboratories undergoing review by the ECVCP Laboratory Standards Committee, only 4 facilities had formal means for identifying improvement opportunities. 5 Laboratories with either ISO 9001 or ISO 15189 accreditation must have a system for identifying errors. The definitions for the concepts involving laboratory error used in the ISO norms are provided in Table 1. The ISO 9001:2008 Standard for Quality Management Systems requires that a nonconforming product should be identified and controlled and that records of the nonconformities as well as resulting actions should be maintained. 9 The ISO 15189:2007 Standard for Medical Laboratories requires documentation and recording of each episode of nonconformity as well as regular review of these records. 8 Identification may take the form of incident reports, improvement opportunity processes, internal audits, and/or risk analyses. 10 Once errors have been identified, regular analysis by management should take place in order to identify the causes and institute corrective actions.
International Organization for Standardization (ISO) definitions.*
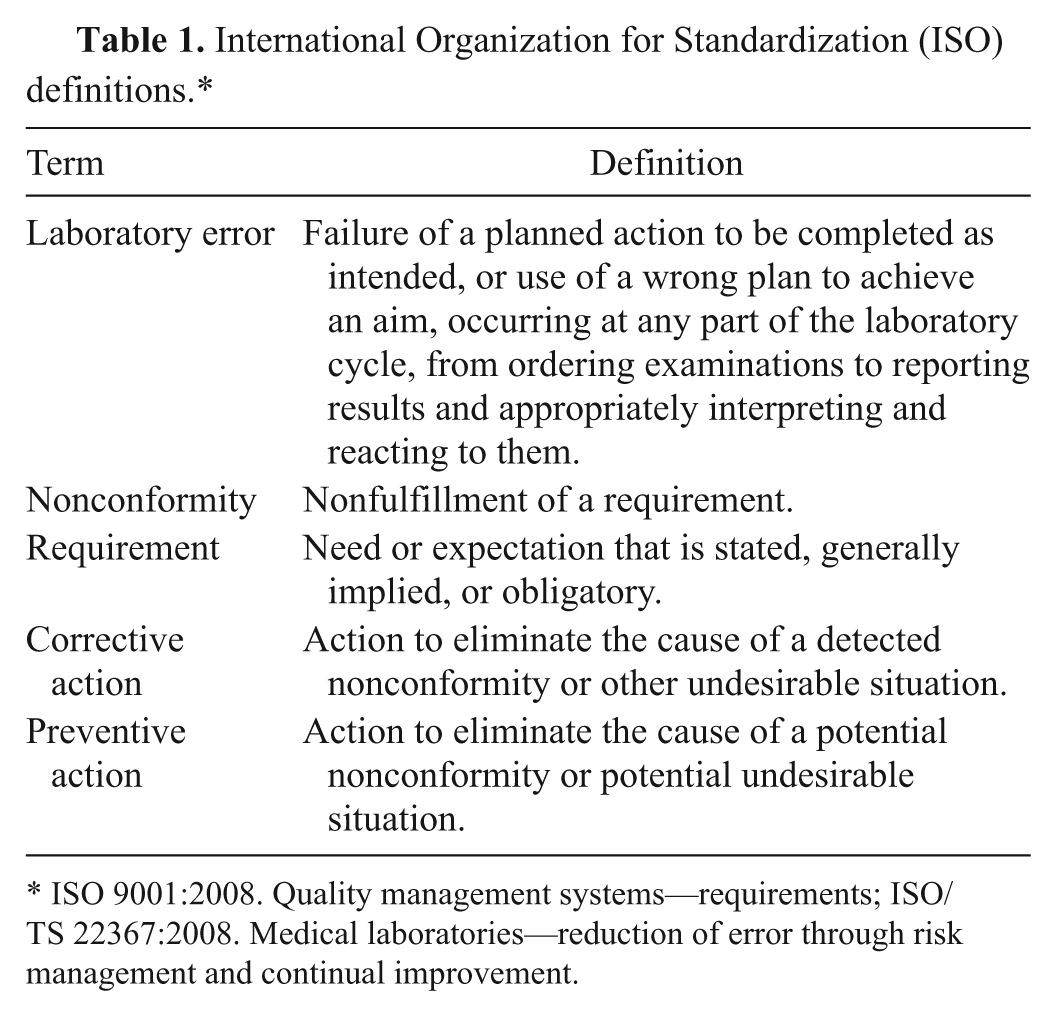
ISO 9001:2008. Quality management systems—requirements; ISO/TS 22367:2008. Medical laboratories—reduction of error through risk management and continual improvement.
Although an error management system may be a compulsory part of a QMS, no uniform system for managing errors exists. In addition, there is a scarcity of information regarding this process in the veterinary literature. There is also no published information regarding the numbers and types of errors that are typically found in veterinary clinical laboratories. A small number of reports have been published about error management in human laboratory medicine.
Most of the studies concerning human laboratory error management advocate the use of an error management system that evaluates errors within the framework of the Total Testing Process (TTP).1,7,15,16 The TTP breaks laboratory testing down into 11 steps, starting with a clinical question that prompts a test selection and ending with the impact of the test result on patient care. 2 These steps are grouped into preanalytical, analytical, and postanalytical phases, with some authors also describing pre-preanalytical and post-postanalytical phases. 15 Alternatively, errors may also be classified according to who bears responsibility for the event, preventability, or the impact on patient care. 10 Such studies concerning error management in human medical laboratories are heterogeneous, and reported error rates differ according to study design, TTP steps analyzed, and whether results are reported per patient, per sample, or per test result. Results vary from errors occurring in 0.05% of patients in a clinical chemistry section to 0.61% of test results across a whole laboratory over 3 years. 3 Other studies report error frequencies as 1:1,000 (0.1%), 1 error per 33–50 events (2–3%), or 1 error per 214–8,300 (0.01–0.5%) of laboratory results.11,15,16 In 2 studies 10 years apart reporting error frequencies and types in a human hospital stat lab, total error frequency decreased significantly from 0.47% to 0.31% per result.4,16
It is therefore hypothesized that the total error rates and error patterns in a veterinary clinical diagnostic laboratory are similar to those reported for human clinical diagnostic laboratories and that the use of an error management system will lead to a reduction of errors over time. The objective of the present study was to use data retrospectively collected from an automated error management system in a veterinary clinical diagnostic laboratory over an 8-year period in order to test these hypotheses.
Materials and methods
Error recording and management system
The data that were examined in the current study originated from a commercial veterinary clinical laboratory offering a diagnostic service for veterinarians in practice. A wide range of tests were performed, including hematology, clinical chemistry, endocrinology, serology, coprology, urinalysis, cytology, and microbiology. Hematology, clinical chemistry, and endocrinology testing was mostly performed on automated analyzers. The evaluation of blood smears, enzyme-linked immunosorbent assays (ELISAs), and immunochromatography (IC) tests relevant to these fields took place manually. Internal QC for the analyzers included the daily use of multiple levels of control material. Results were evaluated against various control rules and performance goals based on total allowable errors, which had been set for various tests. The laboratory participated in a national external quality assurance scheme (OEQUASTA, the Austrian Society of Quality Assurance and Standardisation) aimed primarily at human diagnostic laboratories, which involved hematology and clinical chemistry testing. Serological testing included indirect fluorescent antibody tests, ELISAs, IC tests, passive agglutination tests, and agar gel immunodiffusion tests. Quality control for these tests depended on the use of positive and negative controls. Quality control for microscope-based testing such as cytology, coprology, and urinalysis took the form of regular comparison of results from specimens independently examined by 2 individuals. Quality control procedures and assessment of and response to QC results were documented in standard operating procedures. Results that did not meet the set performance goals for internal and external quality assurance were recorded in the system as analytical errors. The laboratory has ISO 9001 accreditation and was also approved as a training laboratory by the ECVCP Laboratory Standards Committee. ISO certification was achieved in April 2001 and required the establishment of an error identification and management system. During the design of the QMS, error management was assigned to the control of nonconformities process, which falls under the Measurement, Analysis, and Improvement Process section. This is illustrated in Figure 1, which shows the process landscape of the QMS. Processes are described in the QMS in the form of flow diagrams. Figure 2 shows the control of nonconformities process flow diagram. Initially, error recording in the laboratory took place by hand using customized forms, but this system was discarded, as recording incidents and processing of information were excessively time-consuming and there was no standardization in the wording used. A recording system a integrated into the Laboratory Information System (LIS) was subsequently used. The module was designed to follow the control of nonconformities process flow diagram. An earlier version of this application has been described previously (Leidinger E: 2008, LIMS-integrated error management in an ISO 9001-certified diagnostic lab [poster]. European Society of Veterinary Clinical Pathology 10th Annual Congress.). The automated system was well received by ISO auditors involved in the annual internal and external audits. Both internal and external audits are required for ISO 9001 certification. 2 During an audit, various aspects of the QMS are examined, and the presence of an automated error management system provides proof of ISO 9001 compliance, good documentation, and measurement of performance. The error recording software could be accessed directly from the LIS, and errors were recorded by all employees after appropriate training in the various error categories and details of data entry. It was important that staff members understood the different types of errors and entered errors in the correct categories, as this formed the basis for the monthly and annual error reports. The initials of the employee submitting the information were recorded, but there was no field for recording the name of the person who may have caused the error; this was in an effort to avoid a “blaming and shaming” environment and personal strife and stress among employees.
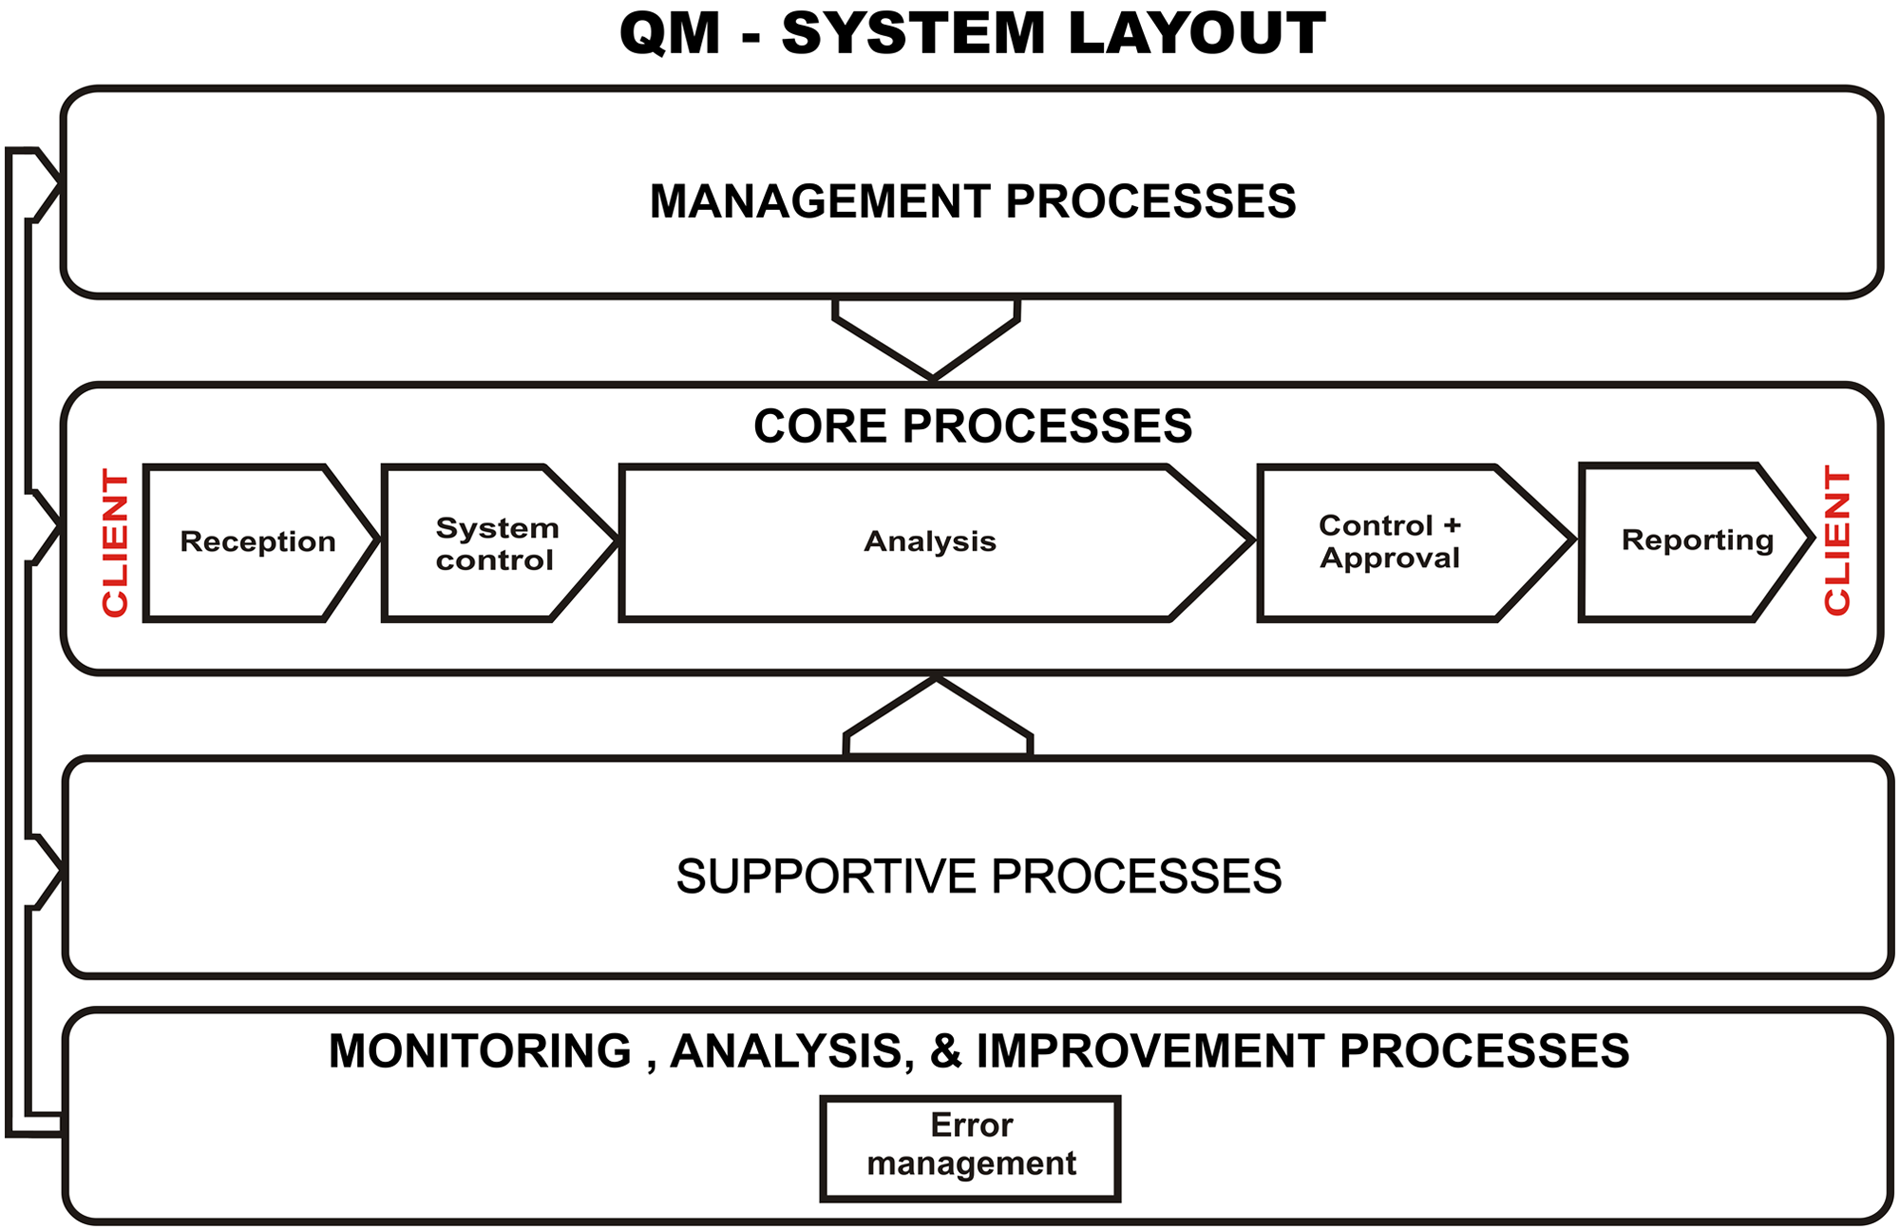
Quality management (QM) system process landscape.
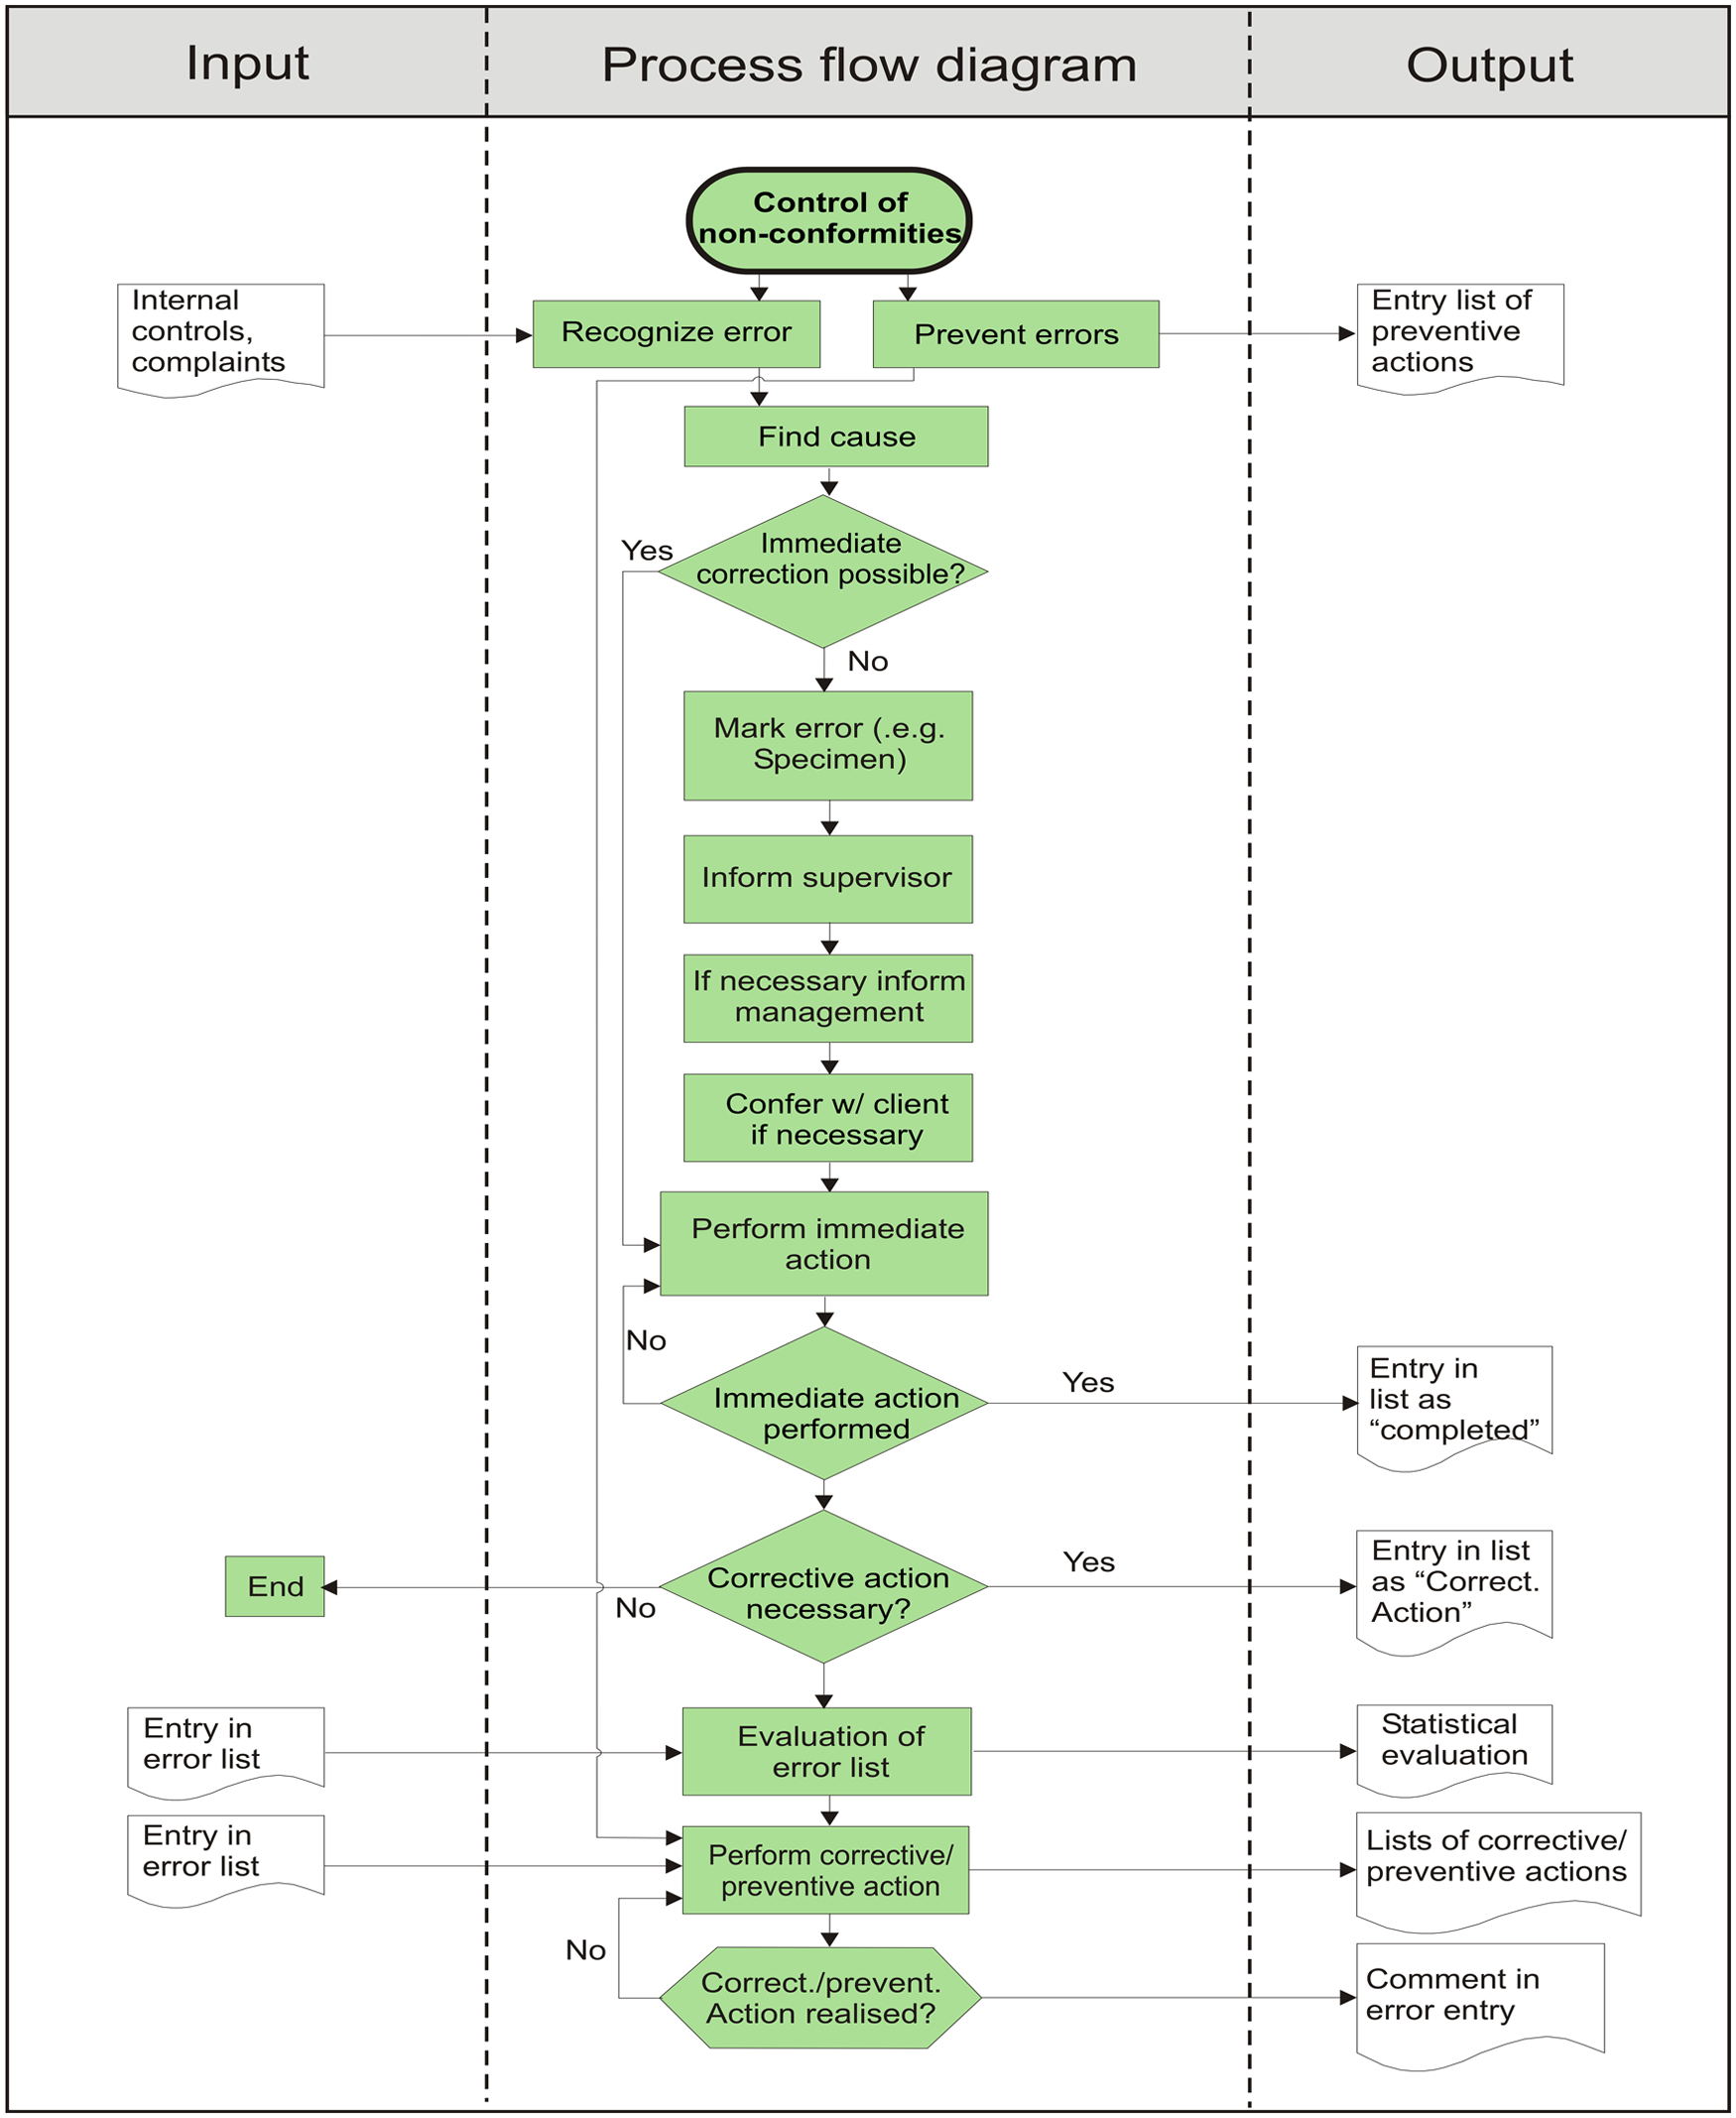
Control of nonconformities process flow diagram. The central column indicates the steps in the process, and the left and right columns indicate the process inputs and outputs, respectively.
Figure 3 shows the data entry screen of the error management application. Upon first entering data, a choice was made from a list of error categories. The categories corresponded to steps in sample processing and also included management functions not directly related to a processing step. Once the appropriate category had been selected, a subcategory of that error was chosen. The subcategories were freely defined, and, once used, stayed in the list for future use. The subcategories field in the database was set to “unique index,” which prevented the entry of exactly the same term twice. To prevent duplication of entries where the terms used are similar (e.g., “wrong veterinarian name” and “incorrect client name,” which both refer to the same error), further maintenance of the subcategory file was manually performed by the system administrator, who was the only person permitted to access the maintenance mode. Details regarding the identification of the error, the sample number concerned, and a short description of the error and its cause were then included. In addition, fields for recording the immediate and planned corrective actions were also available. An immediate corrective action was usually carried out prior to error recording when possible and was recorded in the appropriate field. Finally, a checklist defining the status of the error and whether corrective or preventive actions were carried out was completed. The checklist options were not mutually exclusive and more than 1 option could be selected. If a sample was affected by more than 1 error or an error fell into more than 1 category, then multiple entries were made for that sample number categorizing the different error types. Explanations and further details of the categories and terms used in the application are found in Table 2. The error categories were grouped into preanalytical, analytical, postanalytical, and other error types in order to better compare the data to that published for human laboratories. Sources of information contributing to error recording included client complaints, staff information, nonconformities detected by internal QC and QC statistics, results of external proficiency testing, nonconformities reported during internal and external audits, and information from suppliers.
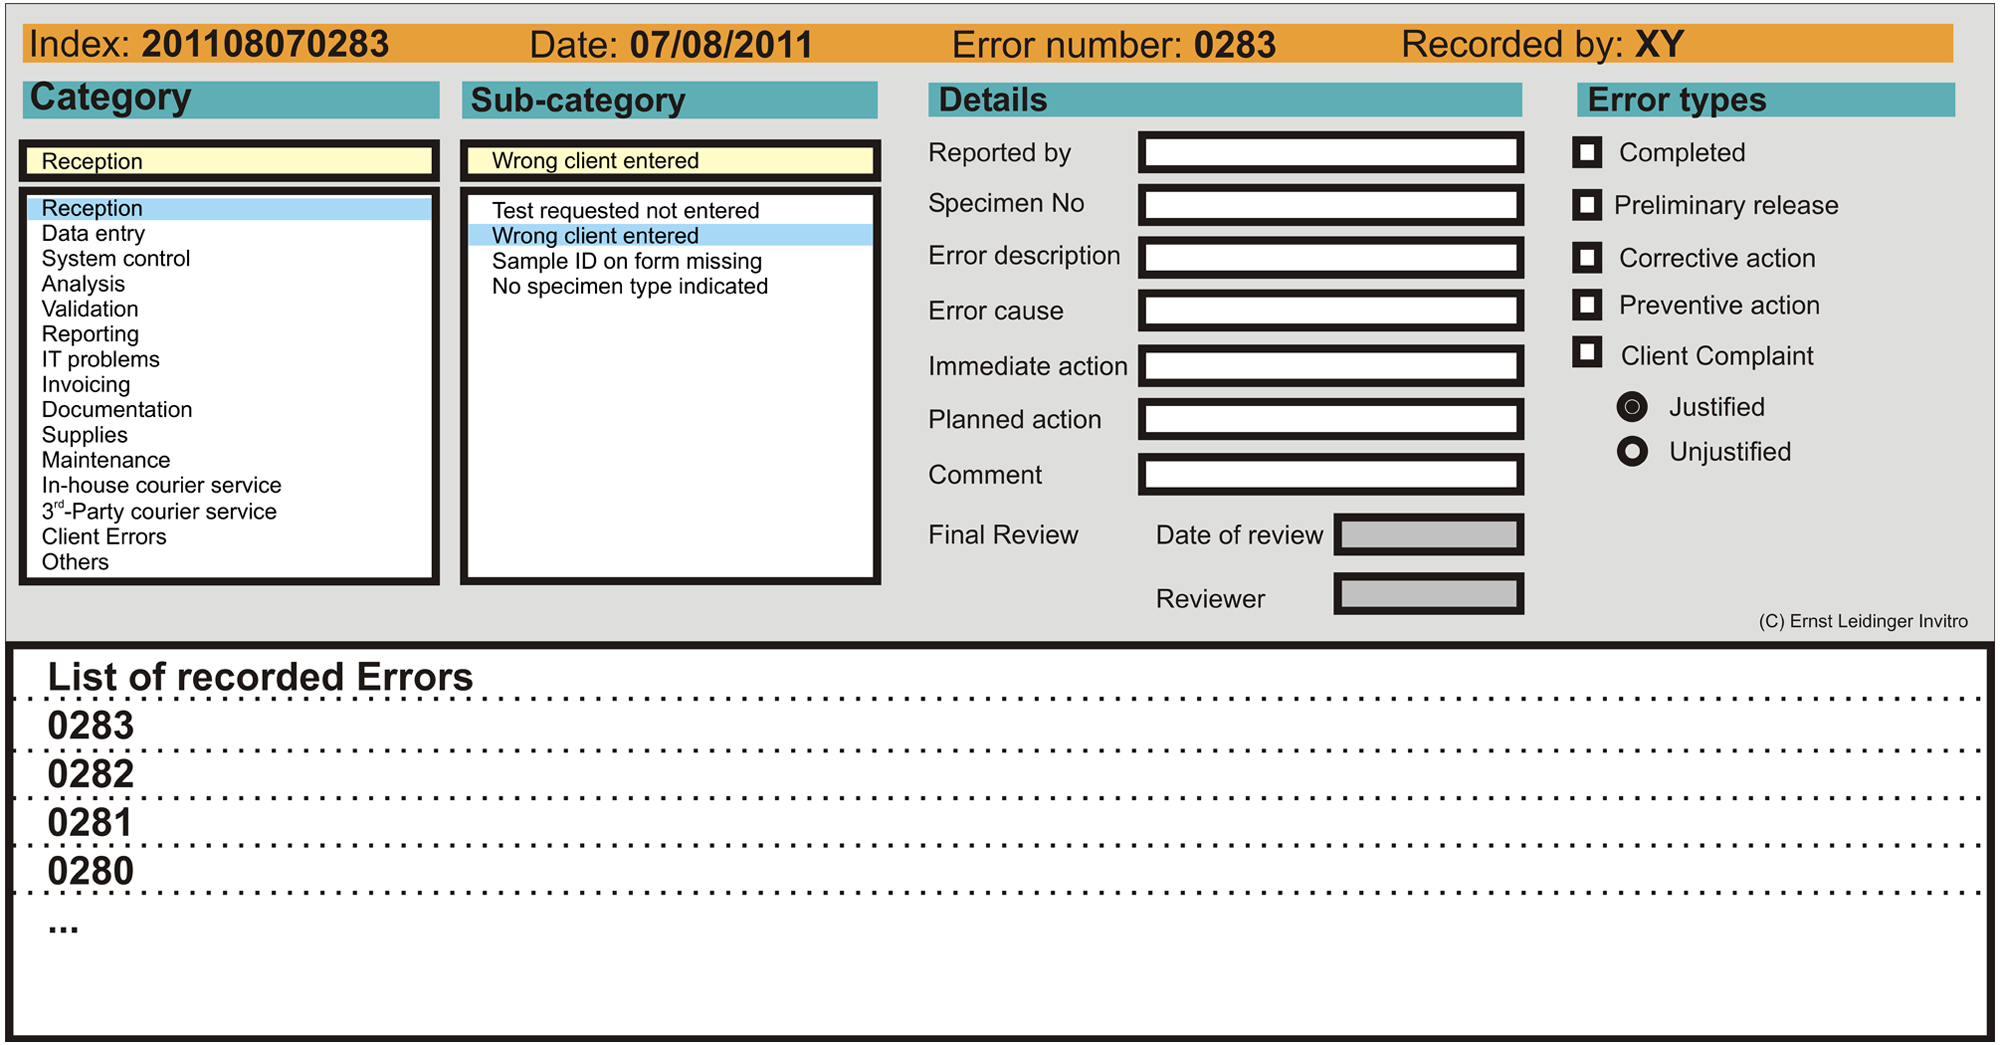
Error management system data entry screen.
Error types and categories used in the error management application.*
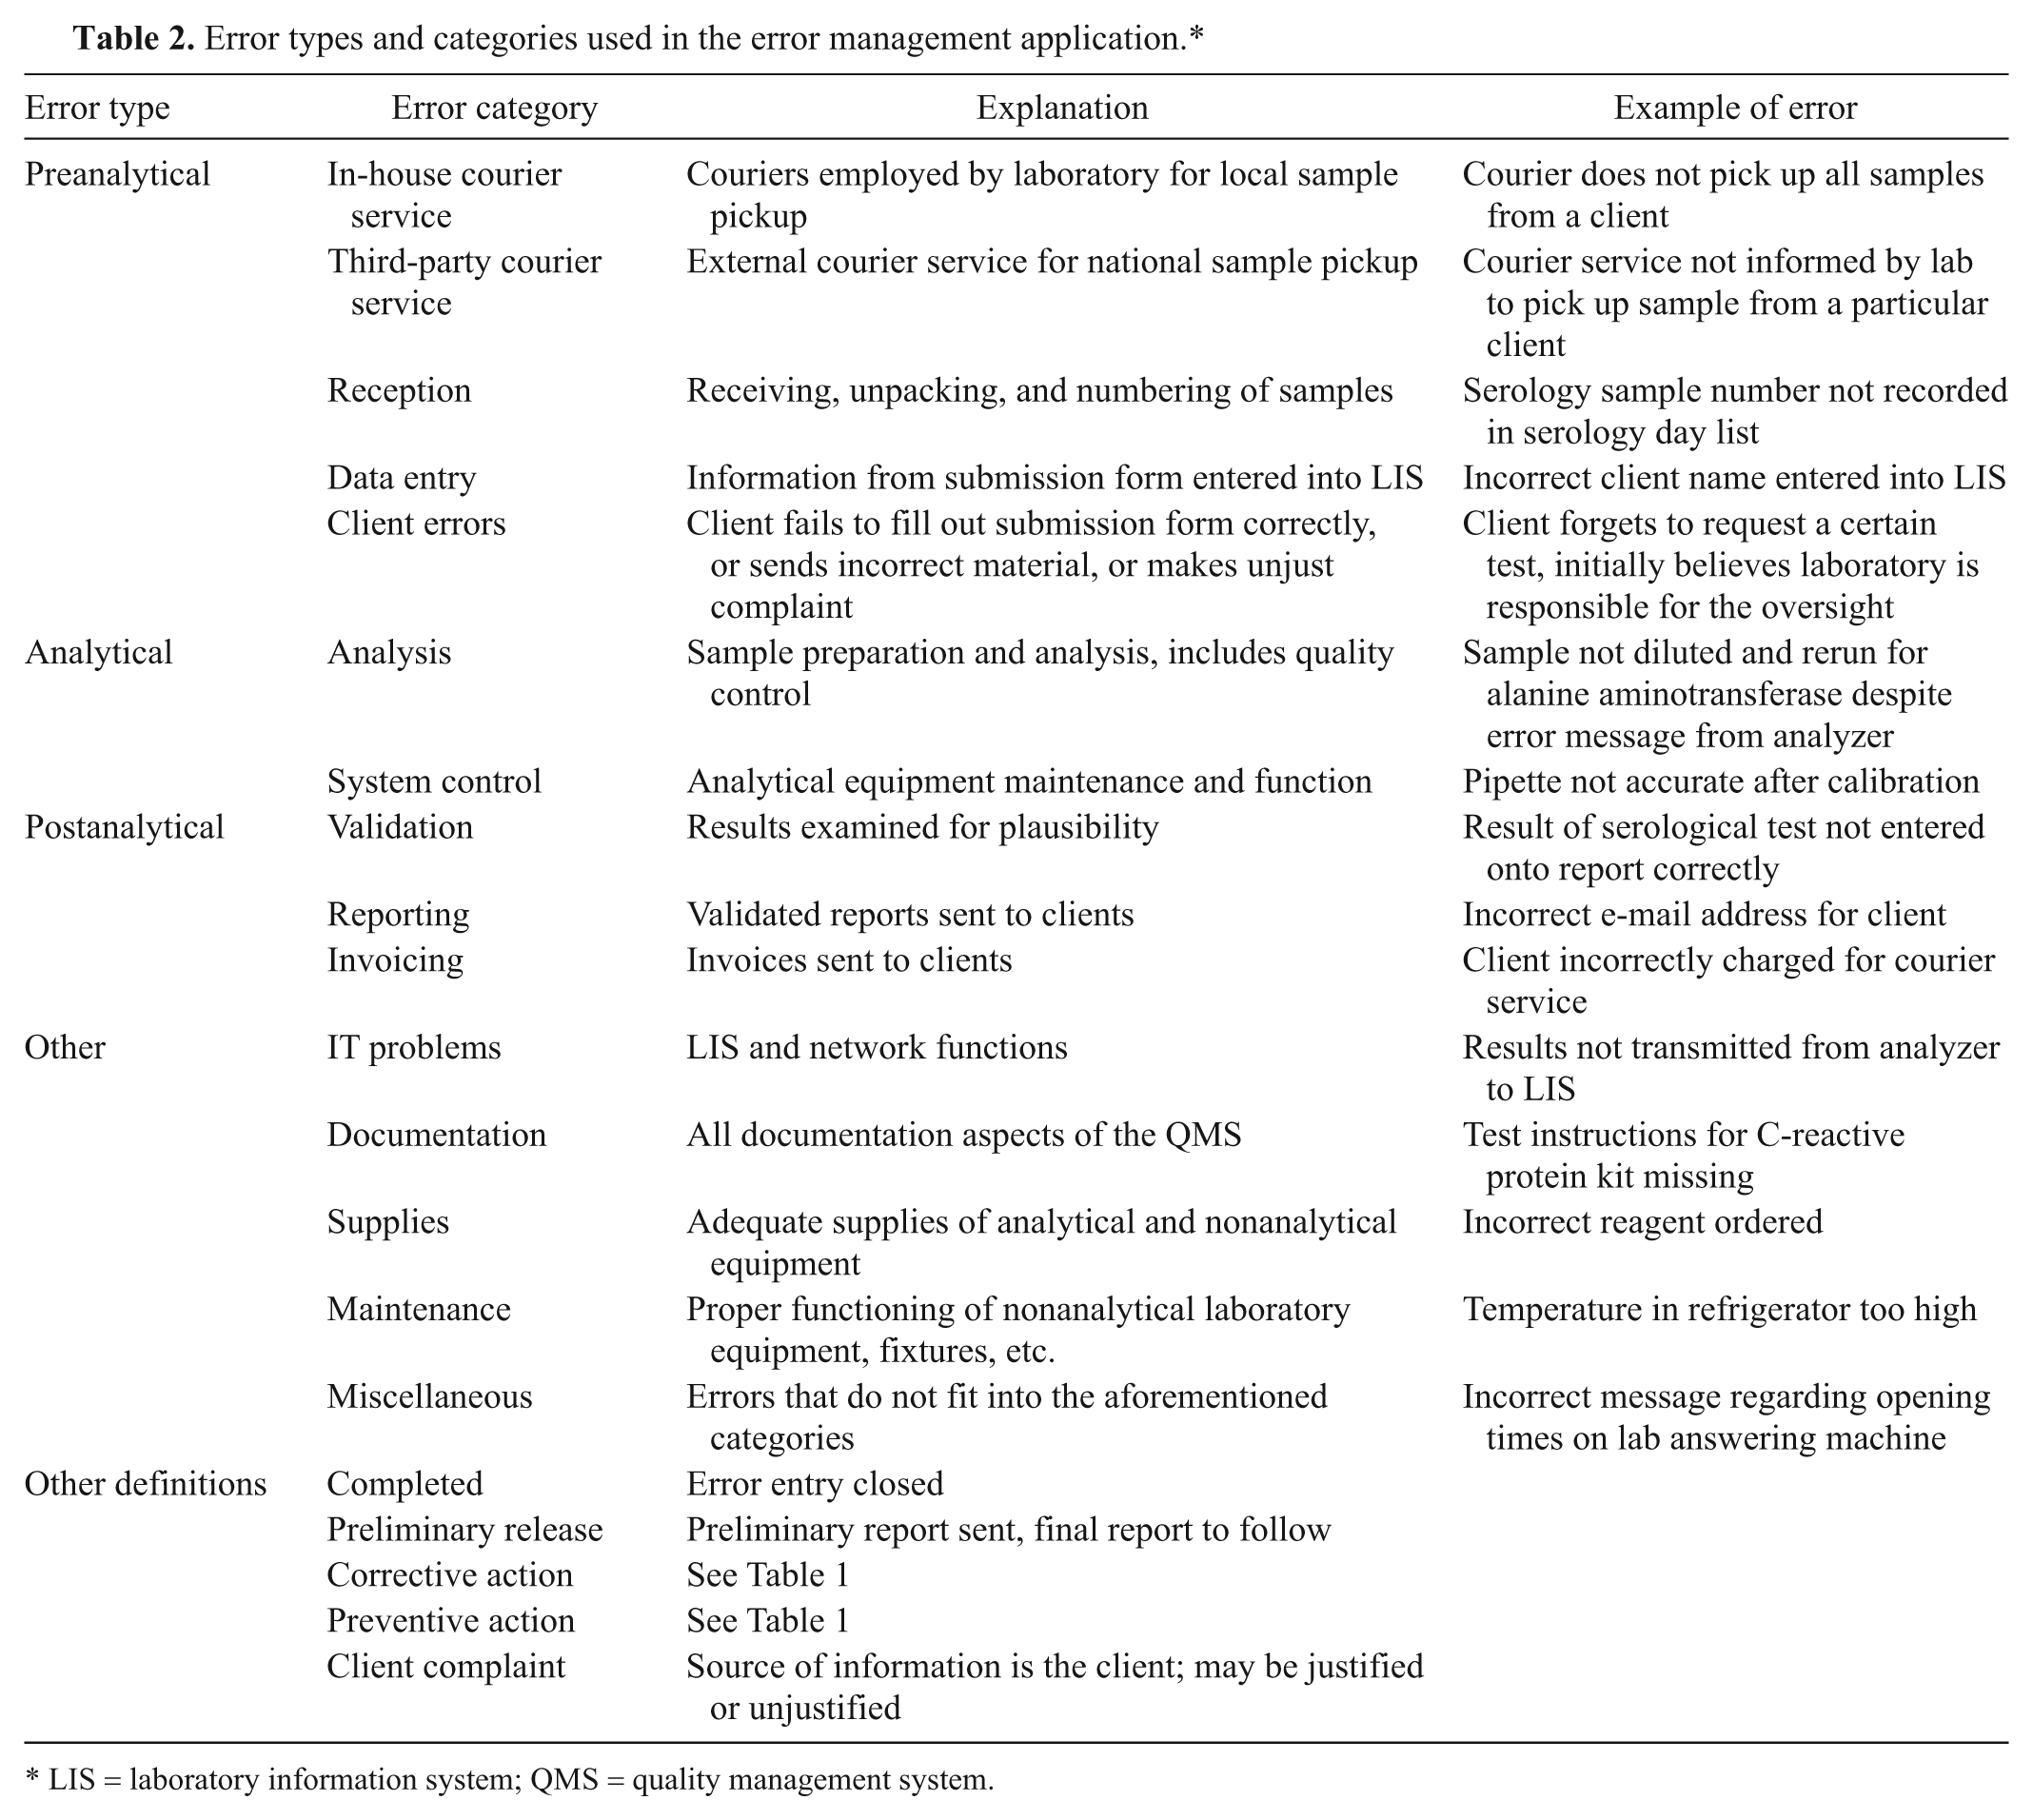
LIS = laboratory information system; QMS = quality management system.
Documents created by the software a included a monthly error report, an annual error report, and lists of corrective and preventive actions. The monthly and annual error reports were examined by the laboratory director. Planned corrective and preventive actions were also decided on by the laboratory director, usually after consultation with the quality manager and occasionally other staff members for whom the error may have been relevant. Immediate corrective actions were generally carried out by the staff member reporting the error without prior consultation. Monitoring of the effectiveness of corrective and preventive actions was also the responsibility of the laboratory director, and a report was included in the annual management review.
Data analysis
The monthly and annual error reports generated by the software application listed the number of errors falling into each category per month or year as well as the total number of errors as a percentage of total sample number. The monthly reports contained all errors recorded for that month, and the annual error report contained all errors recorded for that year. The data from the annual error reports from 2003 to 2010 were transcribed to a spreadsheet. b All data were included. The absolute number of each type of error per year, the number of corrective and preventive actions carried out in each year, and the error rate per total number of samples were recorded. Descriptive statistics were used to further examine the data. The frequencies of error types were calculated as a percentage of total errors for each year from 2003 to 2010. Confidence intervals (95% CI) for total error rates for each year were calculated. Sigma metrics were calculated for the different error types over the period of the study. The total number of errors was calculated for each of the 4 categories by including the annual total errors for each category from 2003 to 2010. This number was divided by the total number of samples processed by the laboratory over the 8-year period and converted to defects per million using an online Six Sigma calculator (http://www.westgard.com/six-sigma-calculators-2.htm). The defects per million result was converted to a sigma metric by the calculator.
The described software was not used to record hemolytic and lipemic samples. This was purposefully excluded during the programming of this particular software application as it was recorded elsewhere in the system. The presence of hemolysis and/or lipemia was noted in the comments section of the clinical chemistry report. The degree of lipemia and hemolysis was graded from + to +++ using visual assessment, as no automated indexes were available on the chemistry analyzer used in this particular laboratory. If samples were considered too hemolytic to process by the technician, the samples were rejected, and the veterinarian was informed. Lipemic samples were ultracentrifuged to clear the lipemia and then pipetted. Data concerning the number of hemolytic and lipemic samples (but not the grade) appeared on the annual statistical reports comparing process goals (e.g., turnaround times) with yearly data and was examined separately from other types of errors. Data were presented as the total number of hemolytic and lipemic samples recorded per year as well as the percentage of hemolytic and/or lipemic samples of total clinical chemistry samples. These data were tabulated in order to compare the total number of hemolytic and lipemic samples per year. The data were presented separately for the following reasons: a sample may be both hemolytic and lipemic, and as each incidence of hemolysis and lipemia was recorded as a separate event, independent of whether they occurred simultaneously, it was not possible to present the aforementioned data in terms of “total hemolytic and lipemic samples per sample number.” In addition, the sample number herein referred to the total number of clinical chemistry samples, not total laboratory samples. Such a distinction made the data unsuitable for inclusion into the error rate calculations, and therefore, the number of hemolytic and lipemic samples was not included in the preanalytical error category.
Results
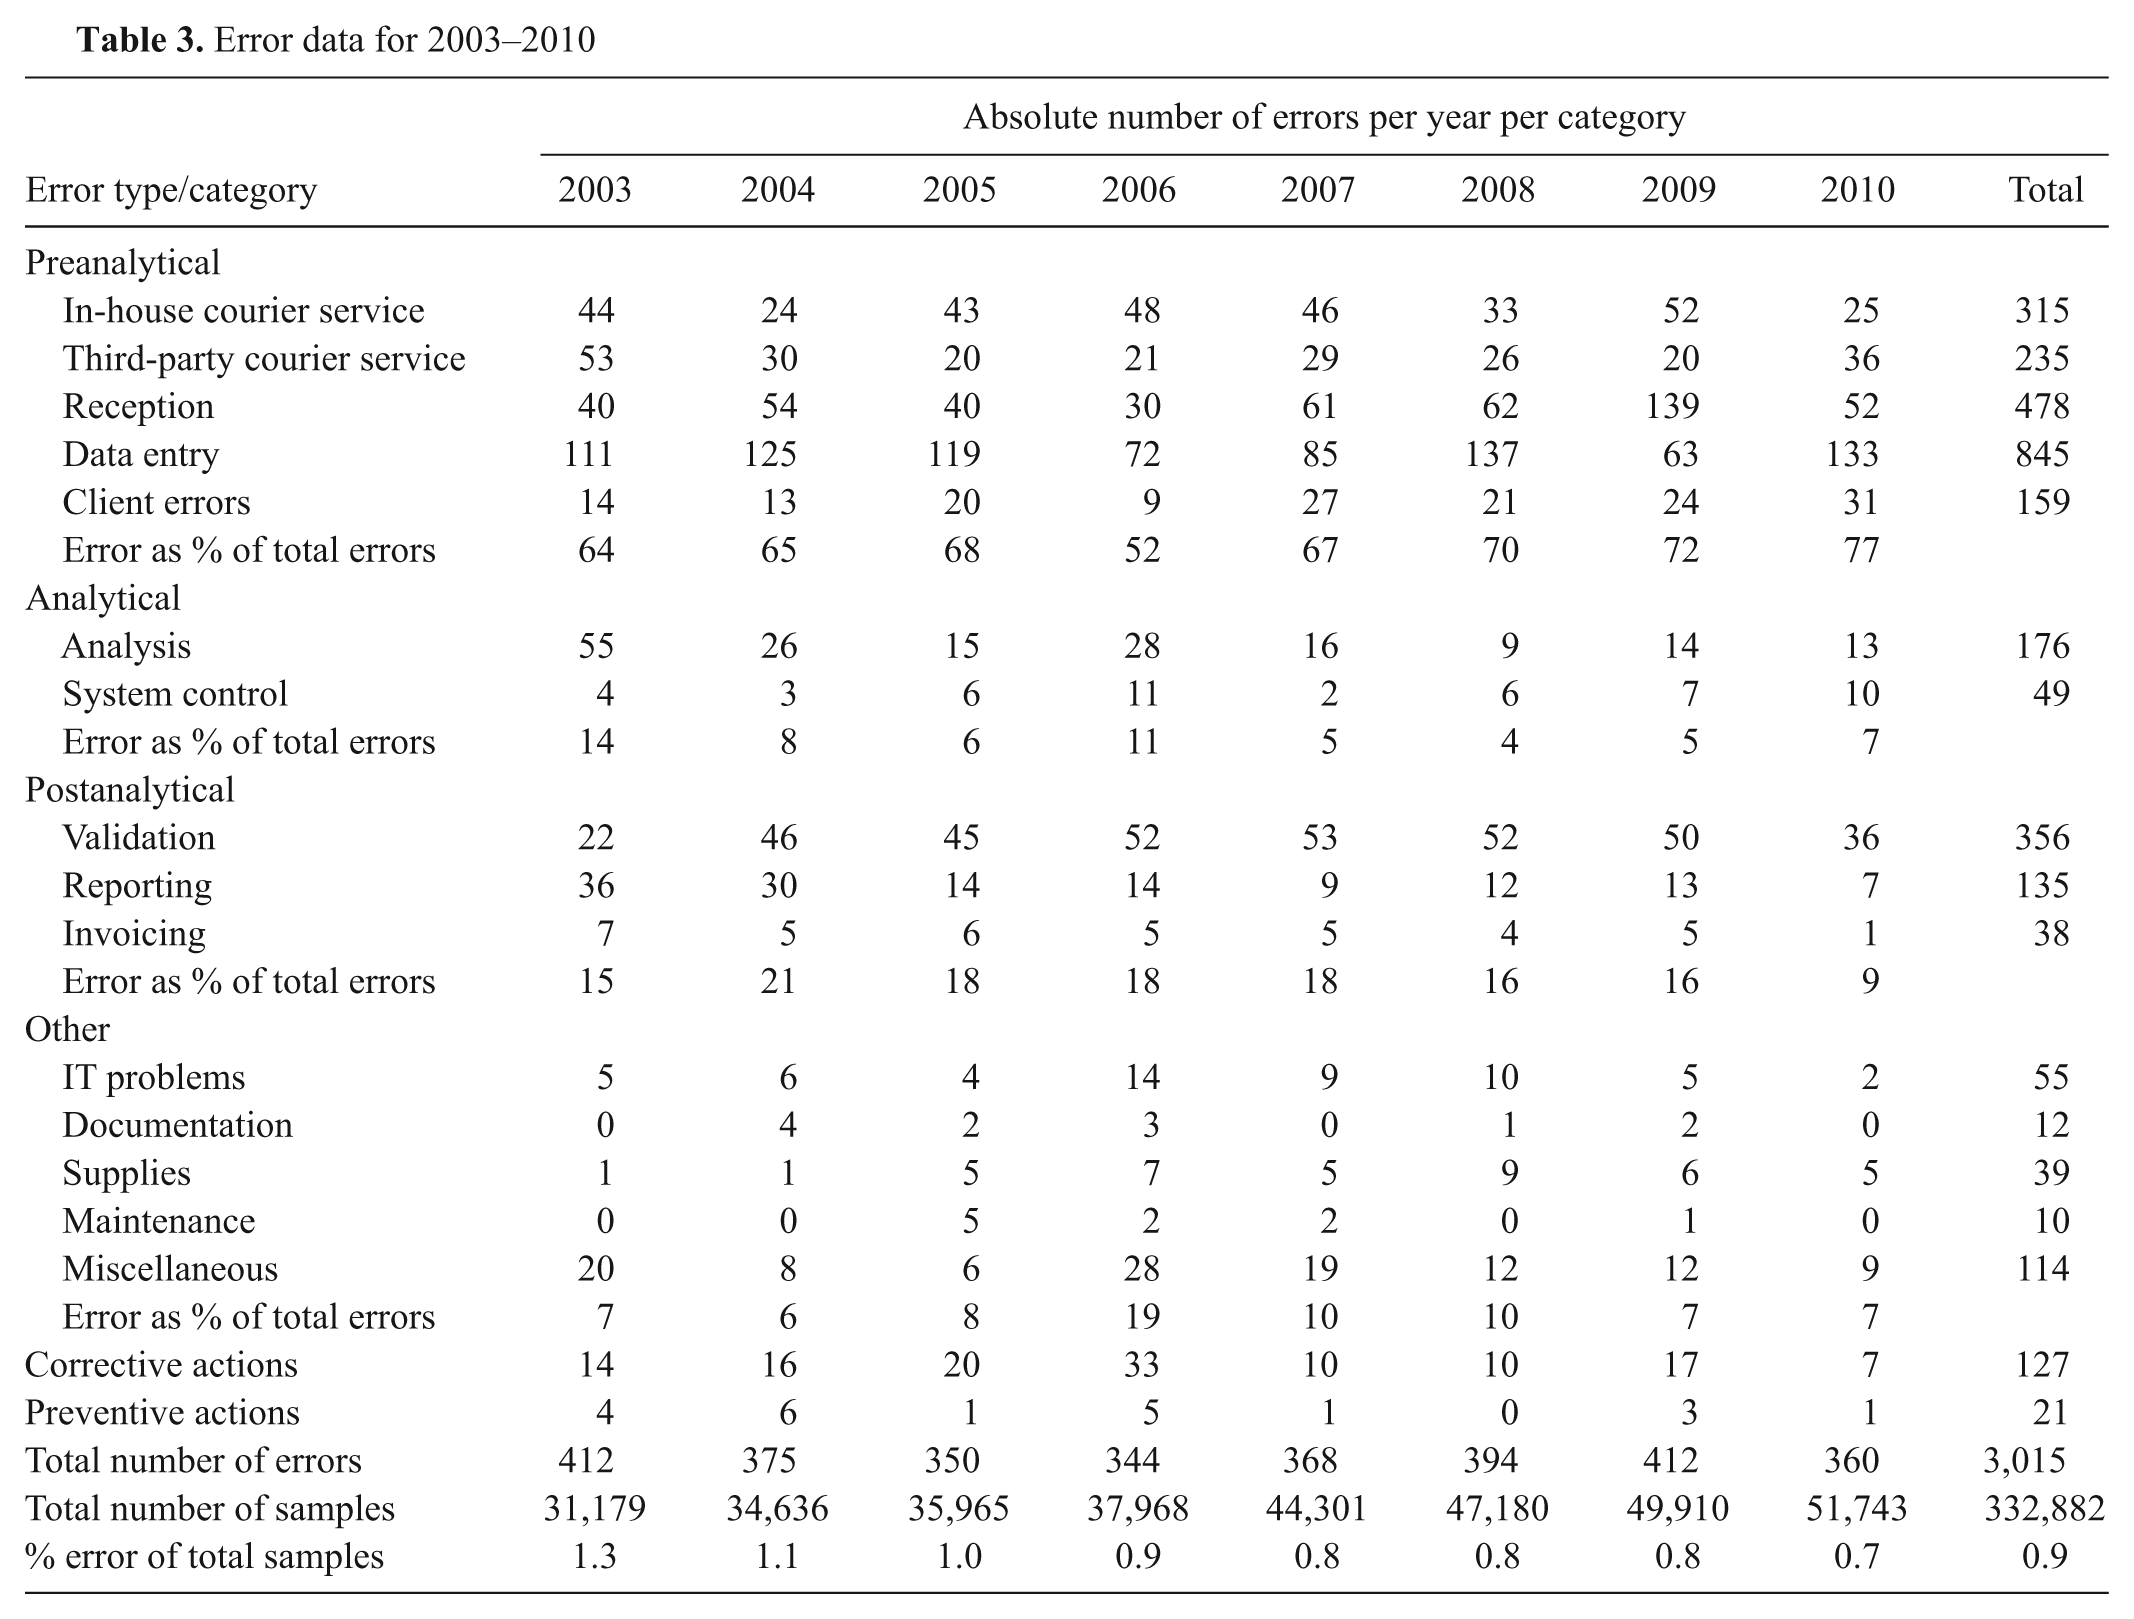
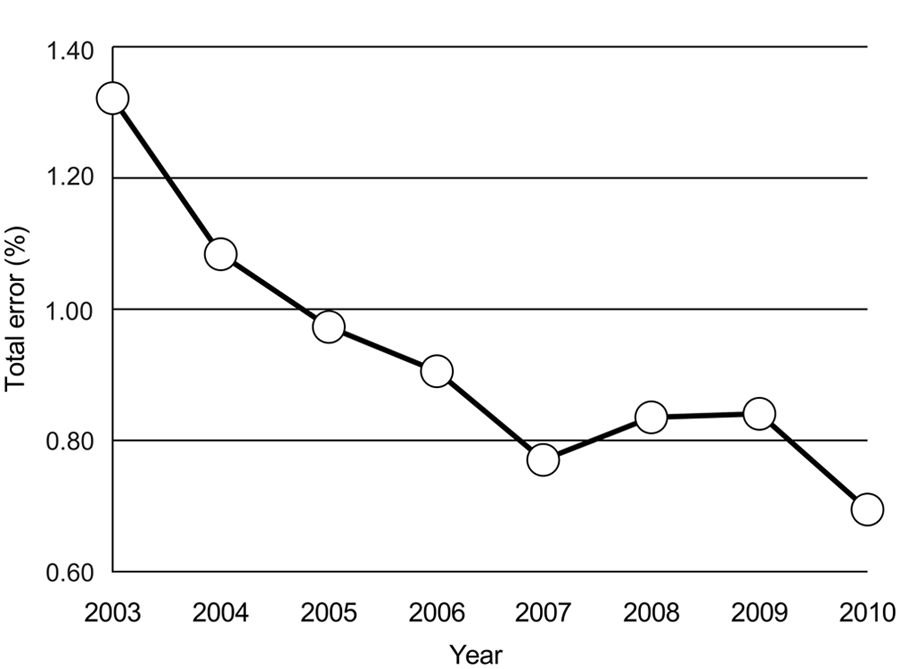
The raw error data recorded in the spreadsheet taken from the annual reports from 2003 to 2010 are shown in Table 3. The total number of samples submitted to the laboratory from 2003 to 2010 was 332,882. Sample reception, data input, validation, and in-house courier errors were the most commonly recorded errors over the 8-year period. The total error number fluctuated while the total number of samples processed by the laboratory increased every year from 2003 to 2010, resulting in a decrease in total error rates over the time period examined. The error rates, based on error per sample number, ranged from 1.3% to 0.7% over the 8 years of data collection (Fig. 4). There was a significant decrease in the error rate for the 8-year period between 2003 (1.3%, 95% CI: 1.19%, 1.45%) and 2010 (0.7%, 95% CI: 0.62%, 0.77%).
Error data for 2003–2010
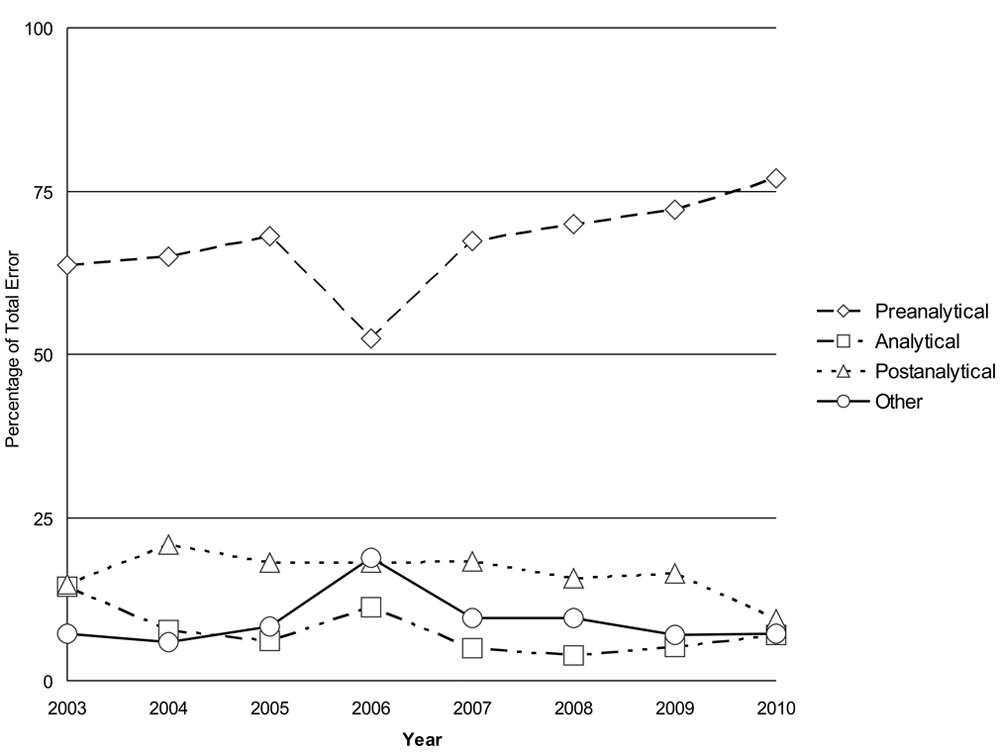
Frequencies of preanalytical, analytical, postanalytical, and other error types as a percentage of total error from 2003 to 2010.
The frequencies of the different types of error are presented in Table 3 and Figure 5. Errors in the preanalytical phase can occur during the blood sampling procedure, completion of the sample submission form, transport of the sample, unpacking and labeling of the sample, entering information into the LIS, and preparation of the sample for analysis. Analytical errors include QC results outside of preset limits, pipetting errors, photometer and analyzer lamp failures, analyzer water contamination problems, air bubbles in the sample, calibration errors, and interferents. In the postanalytical phase, errors can occur during the review of results, interpretation of results, and reporting and transmitting of reports, among others. Most errors occurred during the preanalytical phase, with preanalytical errors ranging from 52% to 77% of annual errors. Postanalytical errors ranged from 9% to 21% and were the second highest group. Analytical errors were the lowest, ranging from 4% to 14%. The category “other errors” showed error frequencies of 6–19% and contained errors that potentially affected all 3 phases and were mostly associated with aspects of the QMS. In other words, most errors occurred at the client-laboratory (preanalytical) and laboratory-client (postanalytical) interfaces.
Percentage of total error recorded per total number of samples per year from 2003 to 2010.
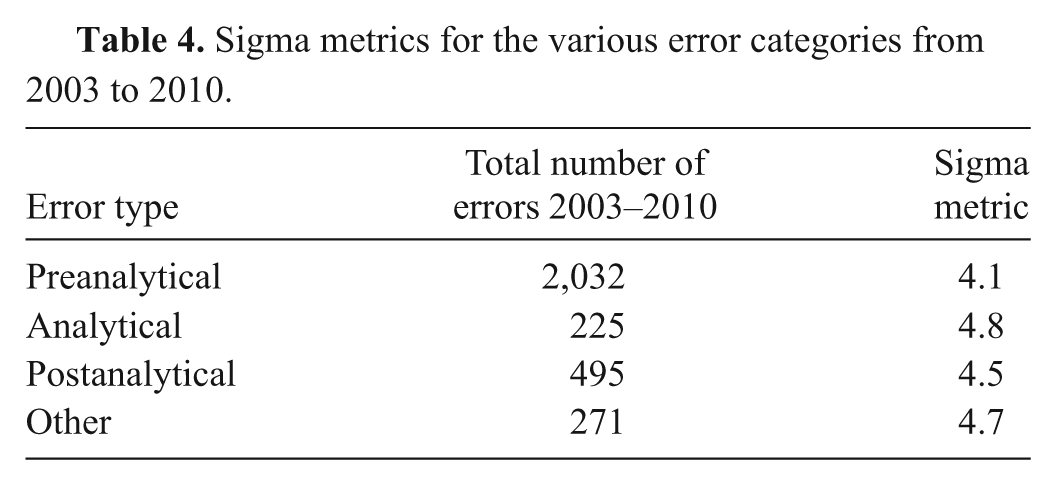
The results of the sigma metric analysis are presented in Table 4. The preanalytical error category had the lowest metric of 4.1, with a total of 2,032 errors from 2003 to 2010. The highest sigma metric (4.8) was associated with the analytical errors (225 over the 8-year data collection period).
Sigma metrics for the various error categories from 2003 to 2010.
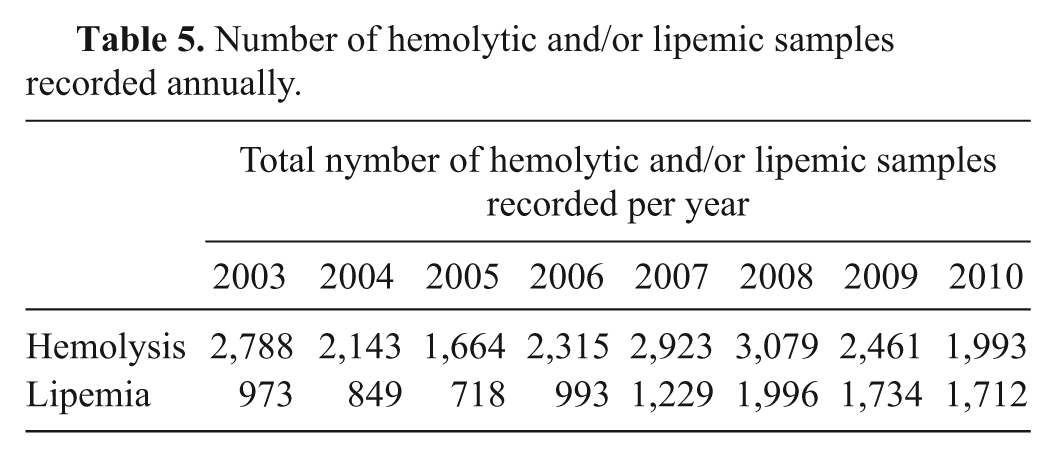
The total number of hemolytic and/or lipemic samples is presented in Table 5. The number of recorded hemolytic samples ranged from 1,664 to 3,079 over the 8-year period. The number of lipemic samples showed an increasing trend, with a minimum of 718 recorded in 2005 and a maximum of 1,996 recorded in 2008. The data were not further examined due to the difficulties in calculation explained in the data analysis section. However, it should be noted that the annual number of hemolytic samples was approximately 5 to 8 times higher than the total number of errors recorded per year, and the number of lipemic samples approximately 2–5 times higher than the total number of annual errors. Including these data in the error rates would have led to an inflation of the reported error frequencies (Table 3).
Number of hemolytic and/or lipemic samples recorded annually.
Discussion
Total error rates of 0.7–1.3% were reported for a veterinary clinical diagnostic laboratory over an 8-year period. These figures are similar to, but slightly higher than, those reported in the human literature, although direct comparisons are not always possible due to different study designs and reporting techniques. Such data support the first hypothesis that error rates in a veterinary clinical diagnostic laboratory would be similar to those reported for human laboratories. Error rates reported in human laboratories ranged from 0.05% per patient to 2.3% per event (events are not defined).3,15 It must be stressed that the figures presented herein are only of errors that were identified and entered into the error management system and does not include those errors that may have gone unnoticed. In addition, many errors were likely self-corrected and remained unreported. There may also have been a bias in error reporting over the different categories depending on the diligence of staff involved in different steps of the testing process. However, due to the variety of staff who entered data into the system over 8 years, it is likely that the available data were consistent and biases negligible. In the human laboratory studies, data were collected by means of special notebooks, audits, and questionnaires and collection of complaints.3,4,16 Two reports describe the use of a computerized database to record and manage errors.12,17 An automated reporting system like the system used in the veterinary laboratory described offers greater ease of use and convenience than a manual system and may also explain the higher error rates reported using this system.
The slightly higher error rates reported for the veterinary laboratory compared to some human laboratories may be related to lack of automation in many phases of the TTP compared to human laboratories as well as the fact that samples were processed on an outpatient basis. This is in contrast to many human laboratories that are based in hospitals and receive samples on site. On-site sampling has the advantage that patient data are entered into a single computer system, barcodes are more frequently used, sampling procedures are uniform, and sample transport time is short. It would be interesting to compare the results presented herein to other veterinary laboratories in order to determine whether the error frequencies for this laboratory are usual for veterinary clinical laboratories and if differences exist between commercial labs and those affiliated with university animal hospitals.
Most laboratory errors occur during the preanalytical and postanalytical phases. Preanalytical errors in a human stat lab ranged from 68.2% to 61.9%, analytical errors from 13.3% to 15%, and postanalytical errors from 18.5% to 23.1% of total errors over 10 years.4,16 Other sources report preanalytical errors in the range of 46–68.2%, analytical errors from 7% to 13%, and postanalytical error rates from 18.5% to 47%. 14 The breakdown of error in the current study is similar to that reported for human laboratories. There was a general trend toward an increase in the proportion of preanalytical errors, with the exception of a decrease in 2006. This is likely a decrease relative to an increase in analytical and other errors. A direct review of the error management database revealed repeated reporting of pipette problems (“system control”), refrigerator temperature control issues (“maintenance”), and errors of communication among staff members (“miscellaneous”), which resulted in a relative decrease in preanalytical errors being recorded.
That the majority of reported errors occurred in the preanalytical and postanalytical phases is mostly due to the fact that these are processes that are manual rather than automated and may not all be well standardized. In addition, in the veterinary laboratory in the present study, the preanalytical phase involved a chain of staff members working together. This is different from the analytical and postanalytical phases, in which only 1 or 2 people were involved in the analysis and postanalytical processing of a sample. Having many people involved in a single process means that the chance of human error is higher than if a single person is involved. In addition, standardization is more difficult. On the other hand, more people involved in a process means more people looking out for errors and thus a higher detection and recording rate compared to a single person who may not detect his or her error or simply self-correct it and not record it. Therefore, a bias may exist toward better error detection and recording in the preanalytical phase.
Analytical error rates in human laboratories have decreased over the past few decades; reports indicate an improvement from 16% to 0.04% analytical error per laboratory test over the last 60 years. 15 This has been attributed to increased use of automation, the application of analytical quality goals and statistical QC, external quality schemes, improvement of testing systems, and improved training of personnel. However, analytical errors can be less obvious and therefore more difficult to detect than other errors. For example, it has been observed that up to 75% of analytical laboratory errors still produce results that fall within the reference intervals and therefore may not be identified. 6 Routine analysis of internal QC results and comparison with analytical goals, such as total allowable error, are vital in order to detect systematic and random errors that may affect the validity of test results.
Many processes in the postanalytical phase are now also automated, at least in the veterinary laboratory discussed herein. Hematology and clinical chemistry results were transferred automatically from the analyzer to the LIS, reducing transcription errors. Reports were sent to clients using an automatic e-mail and fax system. Errors with transcription did occur when results were entered manually, for example with serology and occasionally hormone results. Manual and automated plausibility checks and validation of results were conducted. The use of automated validation systems has been shown to improve error rates in human laboratories when compared with manual validation. 13
Measures to improve error rates in the pre- and postanalytical phases of laboratory testing depend on the standardization of manual processes. Vital to this is the production of well-written, clearly understandable standard operating procedures for each process. Human errors are to be expected in manual systems but can be reduced by ensuring a comfortable working environment with appropriate staffing levels and breaks.
The sigma-metric scale is a well-established benchmark used in many industries. Further information as to how it can be applied to laboratory medicine can be found elsewhere. 19 A sigma metric ≥6 is the goal, reflecting “world class performance,” and 3.0 sigma is considered the minimum acceptable performance. As shown in Table 4, the different error types in the laboratory in the current study achieved sigma metrics of between 4.0 and 5.0, which indicate a need for further improvement in order to achieve world class performance. A study carried out in human laboratories looking at error rates and sigma metrics for a range of quality indicators found that some processes had a sigma metric as low as 2.8 (reports from referred tests that exceeded delivery time; Westgard S: 2011, Error rates in the total testing process. Available at: http://www.westgard.com/testing-error-rates.htm. Accessed February 8, 2012).
The presence of hemolysis and lipemia was not recorded in the error reporting software and not included in the error frequency and breakdown reported, but was considered separately. Lipemia occurs postprandium or as a result of metabolic or endocrine diseases and is not caused by incorrect sample handling. It is therefore a physiological change and was not regarded as a preanalytical error in terms of the recording system described. Hemolysis may also occur as a pathophysiological process, for example in conditions like immune-mediated anemia or associated with microvascular trauma. However, most of the hemolytic samples received in the veterinary laboratory were not due to a pathological hemolysis but rather due to problems with sampling and sample storage. The presence of hemolysis in these samples could therefore be a preanalytical error that was not recorded in the error management system. Because of the difficulty in separating preanalytical error from pathophysiologic hemolysis associated with disease conditions by nonveterinarian laboratory personnel, the importance of these specimen conditions as potential interferents with some types of analyses, the concurrent presence of hemolysis and lipemia in some samples, and the relatively high numbers of hemolyzed and/or lipemic samples received, these were considered as a separate category. Including the high numbers of hemolytic and/or lipemic samples would have skewed the error data and markedly increased the frequency of preanalytical errors. Important information concerning other types of preanalytical errors would have become lost in the increased amount of data. In a previous study of preanalytical errors in a human hospital, hemolytic samples accounted for 50% of preanalytical errors. 3 In most of the studies in human laboratories, the inclusion of hemolysis and lipemia in the error data was either not mentioned or not included at all. In the veterinary laboratory studied herein, the presence of hemolysis and/or lipemia was recorded on the laboratory report, with a cautionary comment regarding results that may have been affected by hemolysis and/or lipemia.
One of the aims of using an error management system as part of a QMS is to assist in quality improvement. There was a trend toward a reduction in error frequency in the veterinary laboratory over the years 2003–2010, as documented by the error management system (Fig. 4). There was a significant decrease in error rates from 2003 to 2010, which supports the hypothesis that efficient error management using a system similar to the system illustrated in the current study should lead to a decrease in errors and an increase in quality.
Reports from human laboratories indicate that the risk of patient harm, adverse events, and problems with patient care from laboratory errors is relatively low, with figures ranging from 2.7% to 30% reported. 15 Most of these adverse events were associated with further unnecessary examinations and thus higher costs and discomfort for the patient, rather than patient harm. However, although the majority of errors may not have a direct impact on patient care, the errors indicate possible weaknesses in the QMS, which should not go unaddressed.
Once an error has been detected, a corrective action should take place in order to rectify the problem. For example, if a client reported not receiving results because the incorrect veterinarian name was entered under the sample number, the name was changed to the correct one, the results re-sent to the correct veterinarian, and the veterinarian who incorrectly received the results contacted to explain the error. In the veterinary laboratory studied in the present study, this was a fairly commonly recorded preanalytical error and occurred mainly when more than 1 veterinarian had the same or similar surnames and the incorrect one was selected from an alphabetical drop-down list. A long-term corrective action was therefore initiated in 2010 whereby every veterinarian name was matched with a unique identifier or key, related in most cases to the surname and first name of the veterinarian. This resulted in a decrease in the number of these recorded errors from 14 over a 3-month period (January–March 2010) to only 7 over the same 3 months 1 year later (January–March 2011).
Preventive actions are put into place after a potential error or nonconformity has been identified in order to prevent its occurrence. Identification of potential errors should take place using a risk management strategy and review of laboratory processes. Preventive actions were entered into the error management system in the same way a detected error would have been recorded, except that the “preventive action” tab was selected. An example of a preventive action carried out in 2010 concerned the introduction by the manufacturer of an altered total thyroxin reagent. A method comparison was carried out between the old and new method to determine whether significant differences existed before using the new method for patient sample analysis.
An error management system is an important part of quality management in veterinary laboratories. Recording laboratory errors enables further classification and enumeration of various types of errors and leads to the implementation of corrective actions and introduction of preventive actions. Error rates in the commercial veterinary laboratory described in the current study were similar but slightly higher compared to those reported for human laboratories. Preanalytical errors are the most common errors found in human medicine and this was also the case in the present study. The use of an error management system led to a significant decrease in the number of recorded errors from 2003 to 2010. Further studies and reviews of error rates at other veterinary clinical pathology facilities would make for interesting comparison.
Footnotes
Acknowledgements
The authors would like to thank Herwig Reichl from Hämosan, Austria, and Alexander Tichy from the Biostatistics Working Group at the University of Veterinary Medicine in Vienna for their advice on the manuscript.
a.
Omnis® 7.3, Raining Data, Hamburg, Germany.
b.
MS Excel® 2003, Microsoft Corp., Redmond, WA.
The author(s) declared no potential conflicts of interest with respect to the research, authorship, and/or publication of this article.
The author(s) received no financial support for the research, authorship, and/or publication of this article.