
Abstract
Beef cattle in the United States are often found to be deficient in essential trace minerals such as copper and zinc. Established reference ranges for mineral concentrations exist and usually designate a concentration as adequate, marginal, deficient, or excessive. This research investigates a new method of interpreting detected elemental concentrations in bovine liver that will add confidence to the final diagnosis. This is based on the hypothesis that a correlation exists between potassium concentration and moisture in a bovine liver sample. This relationship between potassium and moisture content enables the diagnostician to more accurately predict mineral concentrations and wet weight regardless of sample moisture loss. Correlations were found between potassium content and percentage of moisture in experimental samples, clinical biopsies, and a validation study, to a statistical significance of P < 0.001. Experimental samples had a correlation coefficient of R 2 = 0.95 and the mathematical relationship y = 2513.2x −1.0662. Clinical biopsies had a correlation of R 3 = 0.83 and the mathematical relationship y = 2203.4x −0.991. The validation study had a correlation of R 2 = 0.55 and a mathematical relationship y = 2321.4x −0.952. An exponent of −1 is predicted by conservation of potassium mass. These findings have practical significance in maintaining and improving cattle growth, health, reproduction, and food safety.
Introduction
Ninety-eight percent of potassium (K) is known to exist in the intracellular compartment of mammalian tissues. 7,9,10,22 Based on this, it was hypothesized that K can be used to determine true wet weight of diagnostic liver samples, even in instances where a tissue has dehydrated. This would be a valuable tool for diagnostic interpretation of liver mineral concentration in cattle.
Copper, zinc, and other mineral elements are essential for life in all mammals, and it is, therefore, important to assess mineral status in cattle. Currently, at least 17 elements are known to be essential for proper growth, health, and reproduction of cattle. 14,20 Intake of these essential trace minerals is required within a narrow range and deviations can have pronounced effects on overall animal health (Spears JW: 2002, Overview of mineral nutrition in cattle: the Dairy and Beef National Research Council. In: Proc 13th Annu Fla Ruminant Nutr Symp, pp. 113–126. University of Florida, Gainesville, FL). 11,18 Mineral deficiency in beef cattle is common but is often subclinical and manifested as decreases in performance, increases in disease incidence, or both. If mineral deficiency is diagnosed, treatment by supplementation is recommended and has been shown to produce profound improvement in health. 2
Determining mineral status in cattle provides useful information for the veterinary practitioner and is a critical part of maintaining herd health. Because of its physiologic function, liver is the best sample tissue for monitoring many trace minerals, particularly copper. 1,3,4,6,12,13 Obtaining antemortem liver biopsy samples is safe and minimally invasive. 16 Diagnostic reference ranges for trace minerals have been established on both a dry weight and a wet weight basis in liver 4,5,15 ; thus, wet weight measurement must be as accurate as possible. The amount of moisture in a liver sample at analysis may not be representative of the in situ moisture content of the original liver specimen. This is a potential problem in the laboratory and generally arises from excess fluid in the sample taken, sample handling, or conditions in transit. The result can be artificial changes in the sample, which cause errors in the interpretation of the findings. Given this source of error, diagnoses can be missed if the analytical measurement falls within the reference interval. Because intracellular K is constantly maintained, a correlation between K content and true wet weight of liver samples would make diagnosis of mineral status more accurate, regardless of the percentage of moisture in the tissue specimen submitted for analysis.
Materials and methods
Study design
The total amount of K in bovine liver samples was determined so as to establish a relationship between K and the moisture content of the tissue. Samples were obtained from livers of cattle at necropsy and antemortem from in situ biopsies. The study was divided into 3 separate phases: phase 1 used liver specimens obtained from necropsy, phase 2 used in situ liver biopsies, and phase 3 was an in situ liver biopsy validation study. As part of phase 1, an investigation of moisture content in several liver samples was conducted to establish a tissue drying curve, and element concentrations were determined at several points over the course of drying. The K homogeneity within bovine liver was investigated to ensure that various sampling sites could produce a representative sample.
Sample collection, phase 1
A total of 10 livers were taken postmortem from cattle by pathologists at the California Animal Health and Food Safety Laboratory (CAHFSL). a Seven animals were presented to the laboratory for a California state–imposed tuberculosis screening investigation; all were negative for tuberculosis and had no disease problems on examination. Three were animals that presented for routine necropsy examination and had no hepatic pathology as determined by pathologists at CAHFSL. a Livers obtained at necropsy were sampled in arbitrary areas of the 5 liver lobes and care was taken to avoid nonhepatocyte-containing tissue, including fat, connective tissue, bile ducts, and vasculature. Specimens were taken from at least 2 cm below the liver surface to avoid the capsule. A total of 291 subsamples were analyzed for percentage of moisture and K concentration. Of the 291 subsamples, 190 (dry weight [n = 102] and wet weight [n = 88]) were also analyzed for other elements, such as phosphorus, sulfur, magnesium, calcium, sodium, manganese, iron, zinc, and copper to determine differences in concentration between lobes.
Biopsy collection, phase 2
A total of 288 liver biopsy samples were taken from 104 cows belonging either to private livestock producers in California or to the University of California, Davis, Animal Science Department Beef Unit at the campus feedlot and the Sierra Foothill Research and Extension Center. e Biopsies were obtained according to a slightly modified version of a published method 16 with a minimum sample weight of 150 mg. Procaine penicillin G was administered prophylactically (15,000 IU/kg) to prevent bacillary hemoglobinuria (Clostridium hemolyticum). 8 To prevent the possibility of trace element contamination of samples, 19 several precautions were taken including the use of acid-washed glassware, stainless steel instruments, and sterile surgical gloves.
Sample analysis
Laboratory procedures were the same for all 3 phases. Samples were either immediately prepped when obtained or frozen and stored at −22°C. Postmortem (phase 1) liver samples were weighed to 1.00 ± 0.03 g in 10-ml test tubes. Phase 2 and 3 liver biopsy samples had an average mass of 180 mg. The tubes were placed in a temperature-controlled digestion block located in a fume hood to dry. To each tube was added a Teflon boiling chip, a drop of Antifoam-A (15% aqueous emulsion), and 3 ml of concentrated trace element grade HNO3 for digestion. Once digested and cool, 2 ml of concentrated trace element grade HCl was added to each tube, and then the resulting solution was diluted to 10 ml with Type 1 reagent grade water (18.3 M Ω-cm). Elemental analysis was conducted by inductively coupled plasma–atomic emission spectrometry (ICP-AES) based on a method modified from the U.S. Environmental Protection Agency. 21
Correlation validation, phase 3
Once a mathematical correlation was established in phase 1 and 2 samples between moisture content and K content, a study was conducted to assess the applicability of the correlation to diagnostic samples. Liver biopsies were obtained from 16 crossbred beef cows e for this phase (validation biopsies). Three biopsy samples were taken from each animal; 1 sample was placed in 18.3 M Ω-cm water to ensure no moisture loss, representing true weight wet, and the other 2 samples were added to clean vials. Two samples were then left to dry in the vials at room temperature for varying time periods ranging from 24 to 96 hr to simulate a clinical scenario; initial and final masses were determined. The entire contents of the vials that contained nanopure water and liver tissue, or liver tissue alone, were transferred to glass digestion tubes, and each vial was washed 2–3 times to ensure transfer of all material. All 3 biopsies from each cow were analyzed as described above.
Instrument validation and quality control
Acceptability of elemental analysis data was based on results from analysis of certified Standard Reference Material (SRM) samples, liver sample overspikes, drift correction, and individual standard deviation and relative standard deviation (% RSD) for each sample. Analysis was accepted if the spike recovery and certified sample recovery rates for all elements were in the range of 80–120%. Sample overspikes were performed as needed and the concentrations were selected based on the expected amount in the analyte matrix.
Statistical procedure
Statistical analysis included 1-way analysis of variance, regression analysis, and post hoc tests, specifically a Bonferroni correction. All statistics were performed using SPSS v. 14.0 for Windows, d BestFit 4.5, c and Microsoft Excel 2000. b Diagnostic parameters that were calculated for the correlation validation included diagnostic sensitivity (probability that the test is positive in animals with the condition of interest), diagnostic specificity (probability that the test is negative in animals that do not have the condition of interest), diagnostic accuracy (probability that the test correctly classifies the animal as either having or not having the condition of interest), the predictive value of a positive test (probability that a positive test result indicates that the animal has the condition of interest), and the predictive value of a negative test (probability that a negative test result indicates that the animal does not have the condition of interest). 17
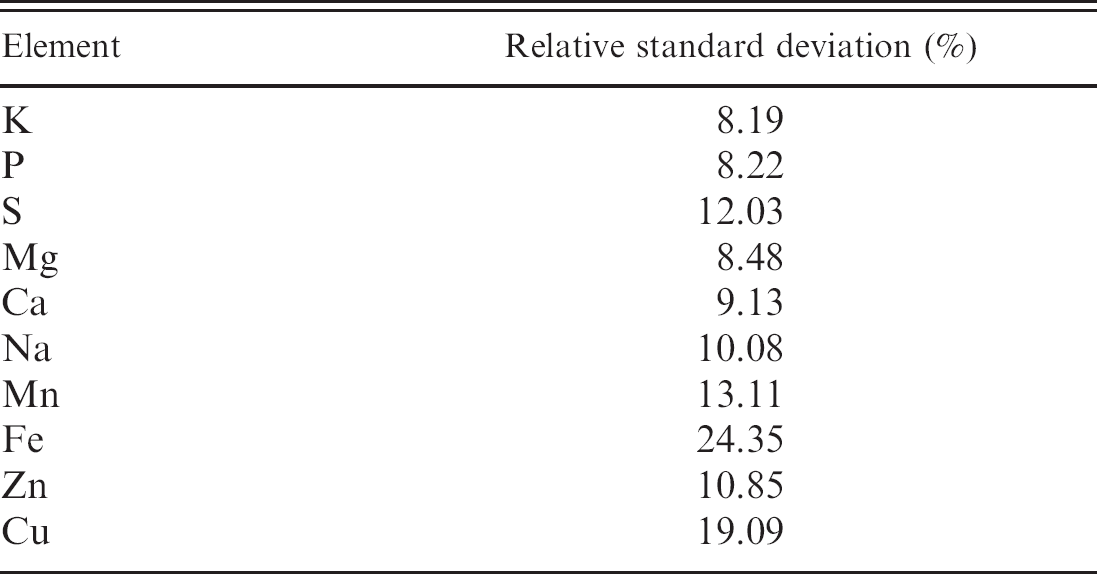
Comparison of elemental homogeneity between lobes of bovine liver on a dry weight basis from each lobe of liver (n = 102).
Results
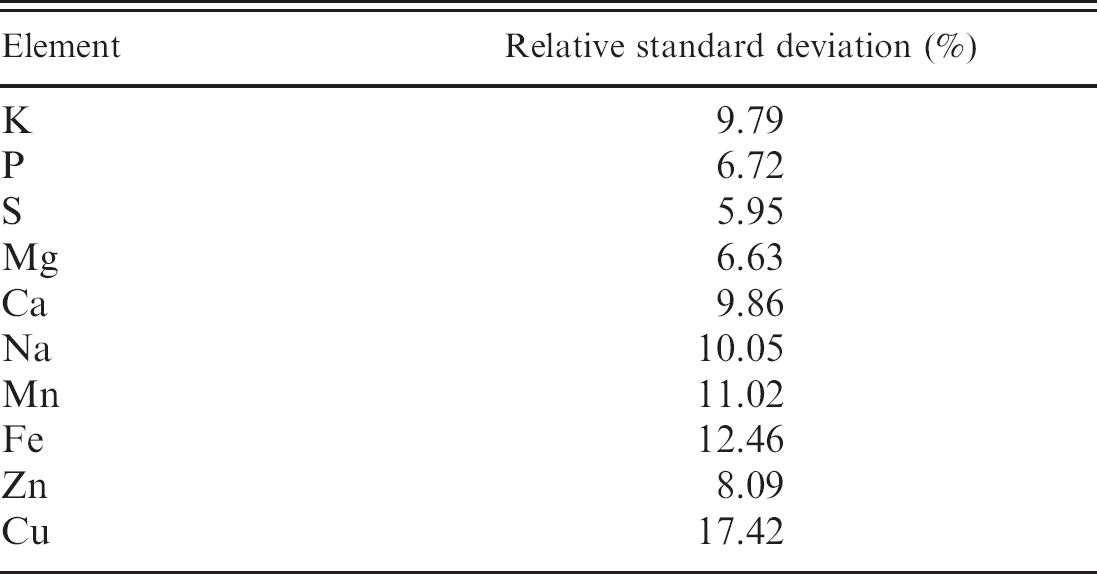
The mass of liver samples obtained from necropsy specimens (phase 1) dried to constant wet was found to be 26.7 ± 0.018% of wet weight (n = 102). The study of dry weight element distribution within the left, right, caudate, quadrate, and papillary lobes of bovine liver (n = 102) found that K has the least overall variation among the 10 elements measured with a relative SD of 8.19% (Table 1). The study of wet weight element distribution within the left, right, caudate, quadrate, and papillary lobes of bovine liver (n = 88) found that K has a similarly low variation among the lobes with a relative SD of 9.79% (Table 2). The mean K concentration on a dry weight basis was 11,308 ± 1,116 ppm (n = 102). Potassium concentration was found to be significantly lower (P < 0.05) in the caudate lobe (Fig. 1) of the phase 1 dry weight specimens (n = 102). Copper concentrations were significantly different (P < 0.01) in the caudate lobe (n = 102; Fig. 2). The relationship between moisture content and K concentration was established with a total of 291 phase 1 liver subsamples taken in the laboratory from whole, fresh bovine liver lobes. This correlation was found to be highly significant (P < 0.001) with a correlation coefficient of 0.95. The best-fit equation of the trend was y = 2513.2x −1.0662 (Fig. 3).
Comparison of elemental homogeneity between lobes of bovine liver on wet weight basis from each lobe of liver (n = 88).
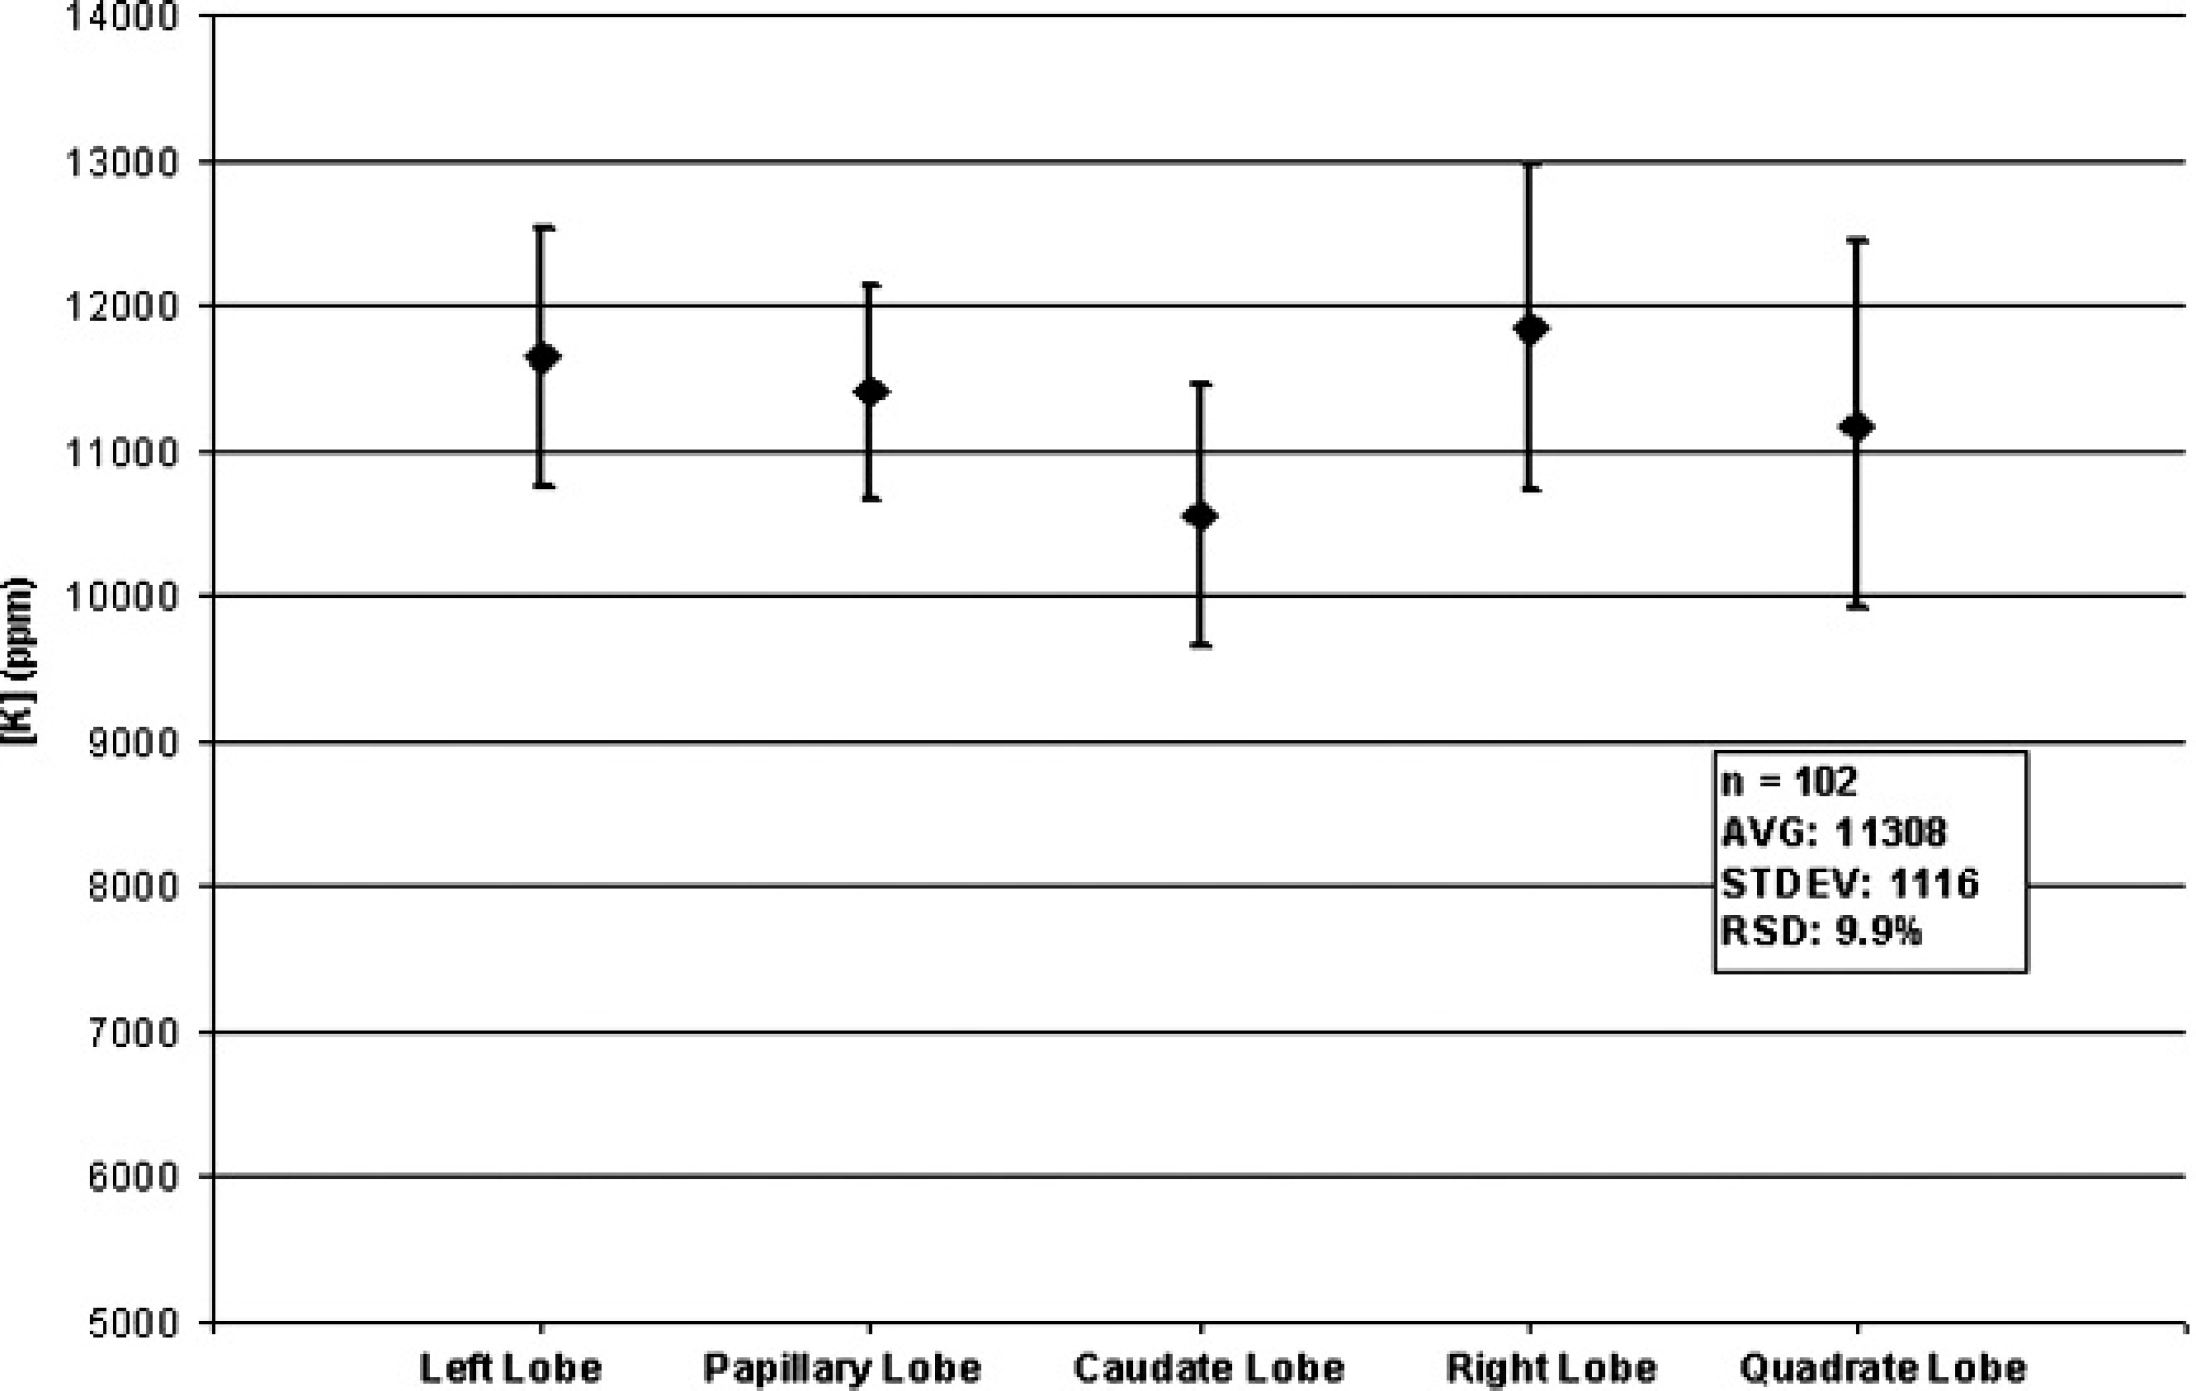
Comparison of potassium concentration among the 5 lobes of bovine liver (n = 102) on a dry weight basis.
The second phase was conducted with 288 clinical biopsy samples and showed a highly significant (P < 0.001) correlation and a very similar best-fit equation of y = 2203.4x −0.991 (R 2 = 0.83; Fig. 4). A graph of both the experimental samples and the clinical biopsy samples shows the similarity of the 2 correlations (Fig. 5). A graph of micrograms of K versus liver dry weight intercepted slightly above the origin and had a correlation coefficient of 0.69 in 86 samples (Fig. 6). The intercept is not statistically distinguishable (P = 0.4) from the origin.
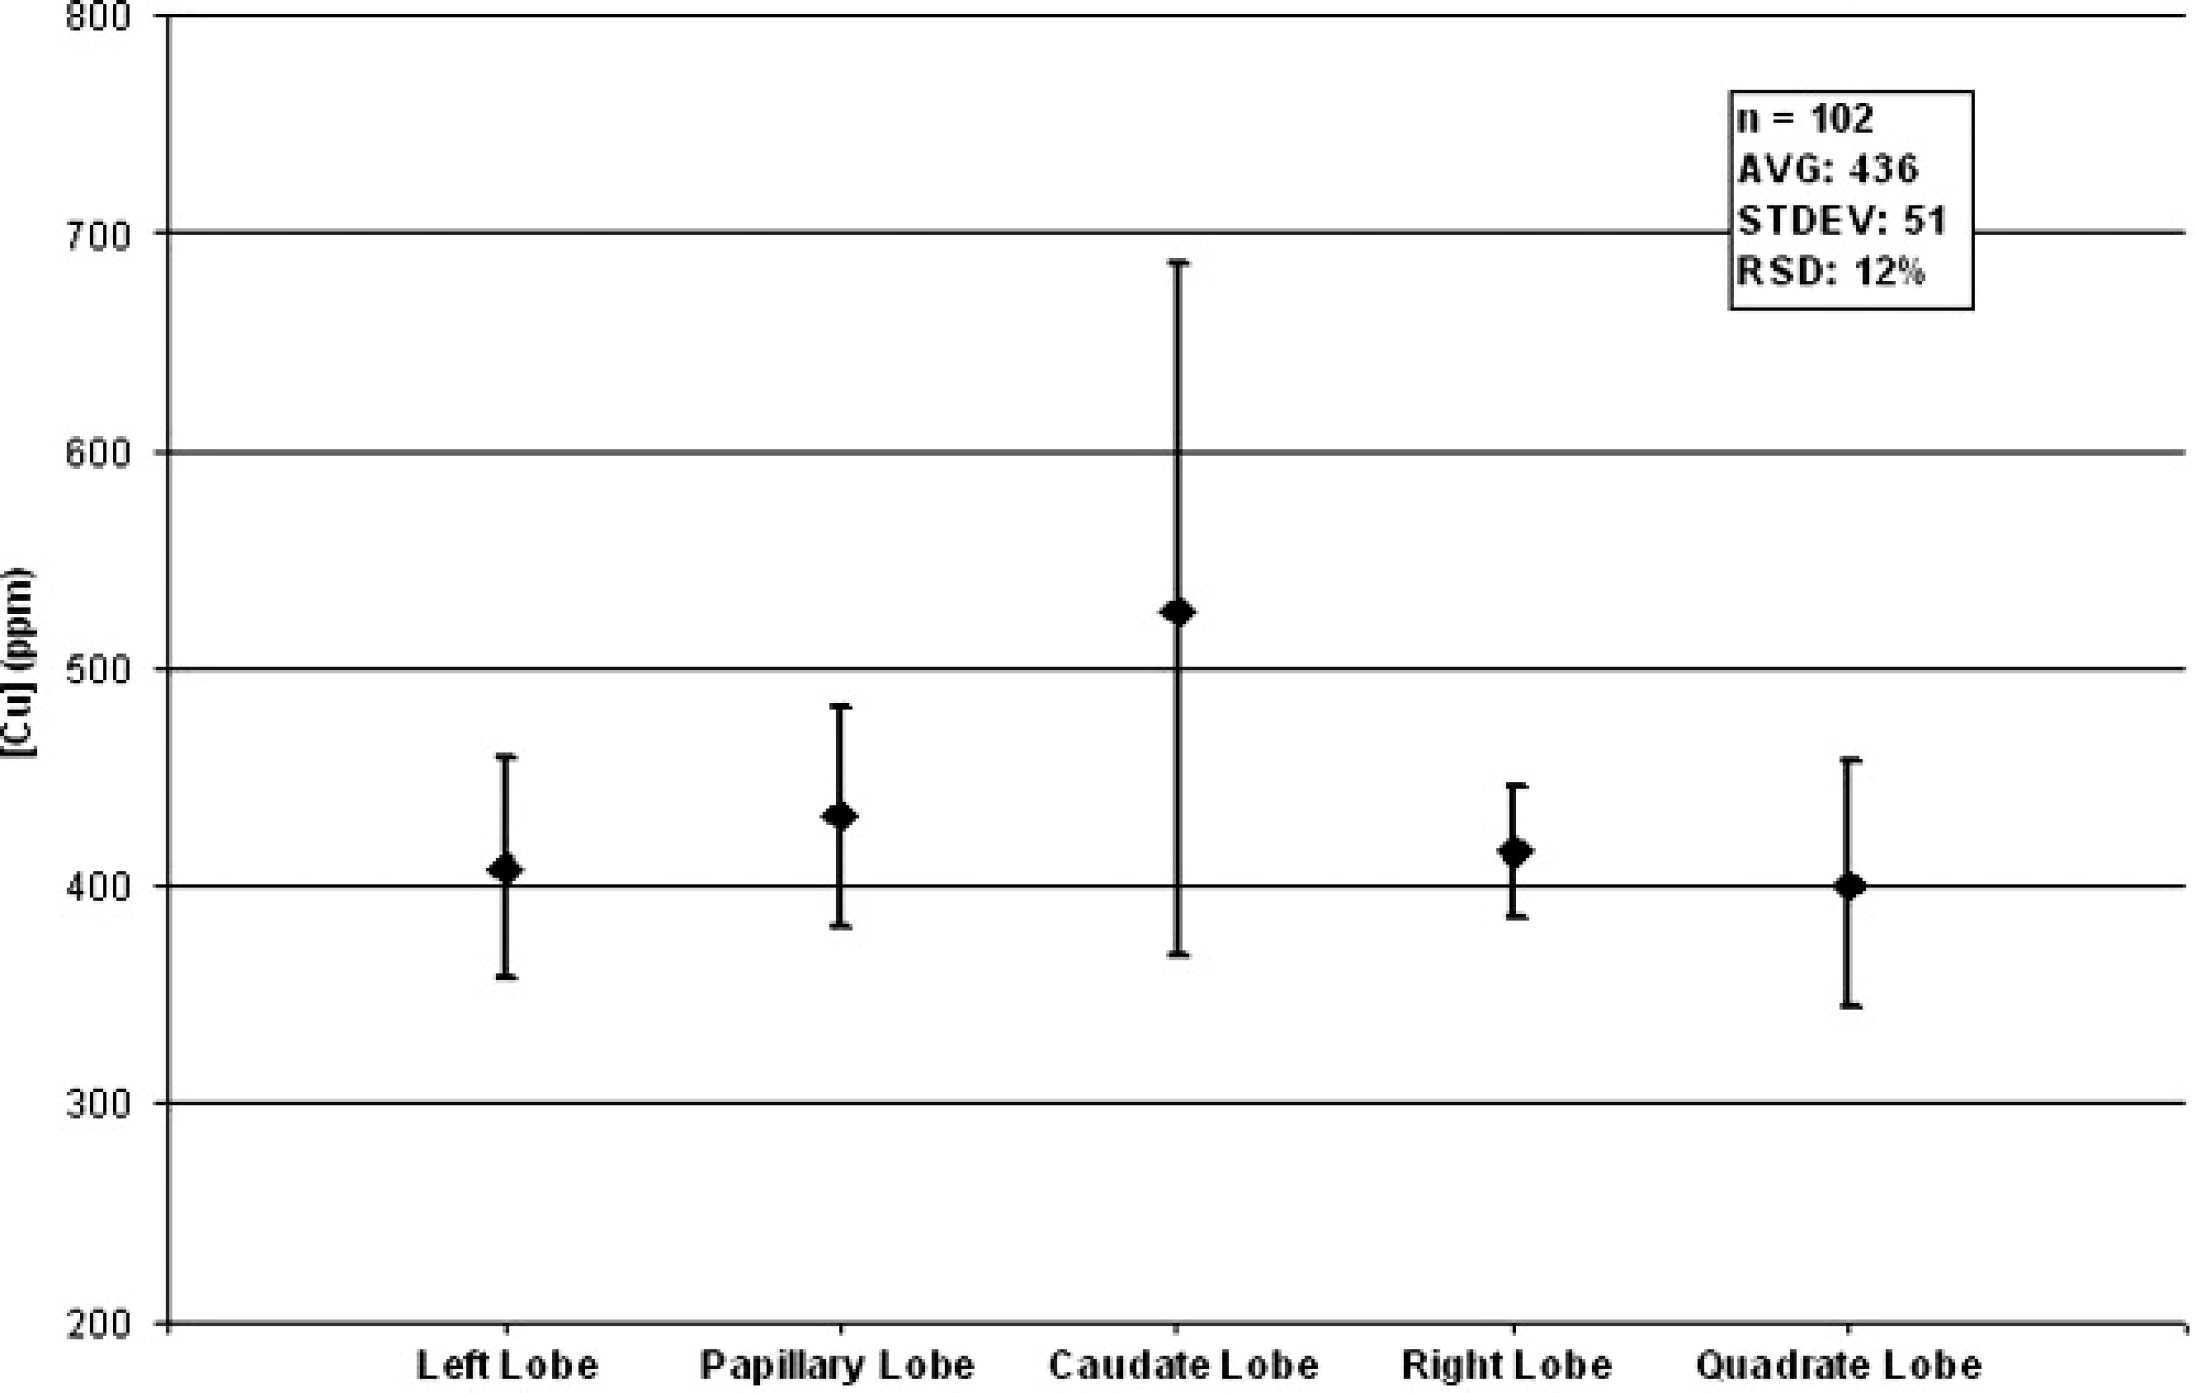
Comparison of copper concentration among the 5 lobes of bovine liver (n = 102) on a dry weight basis.
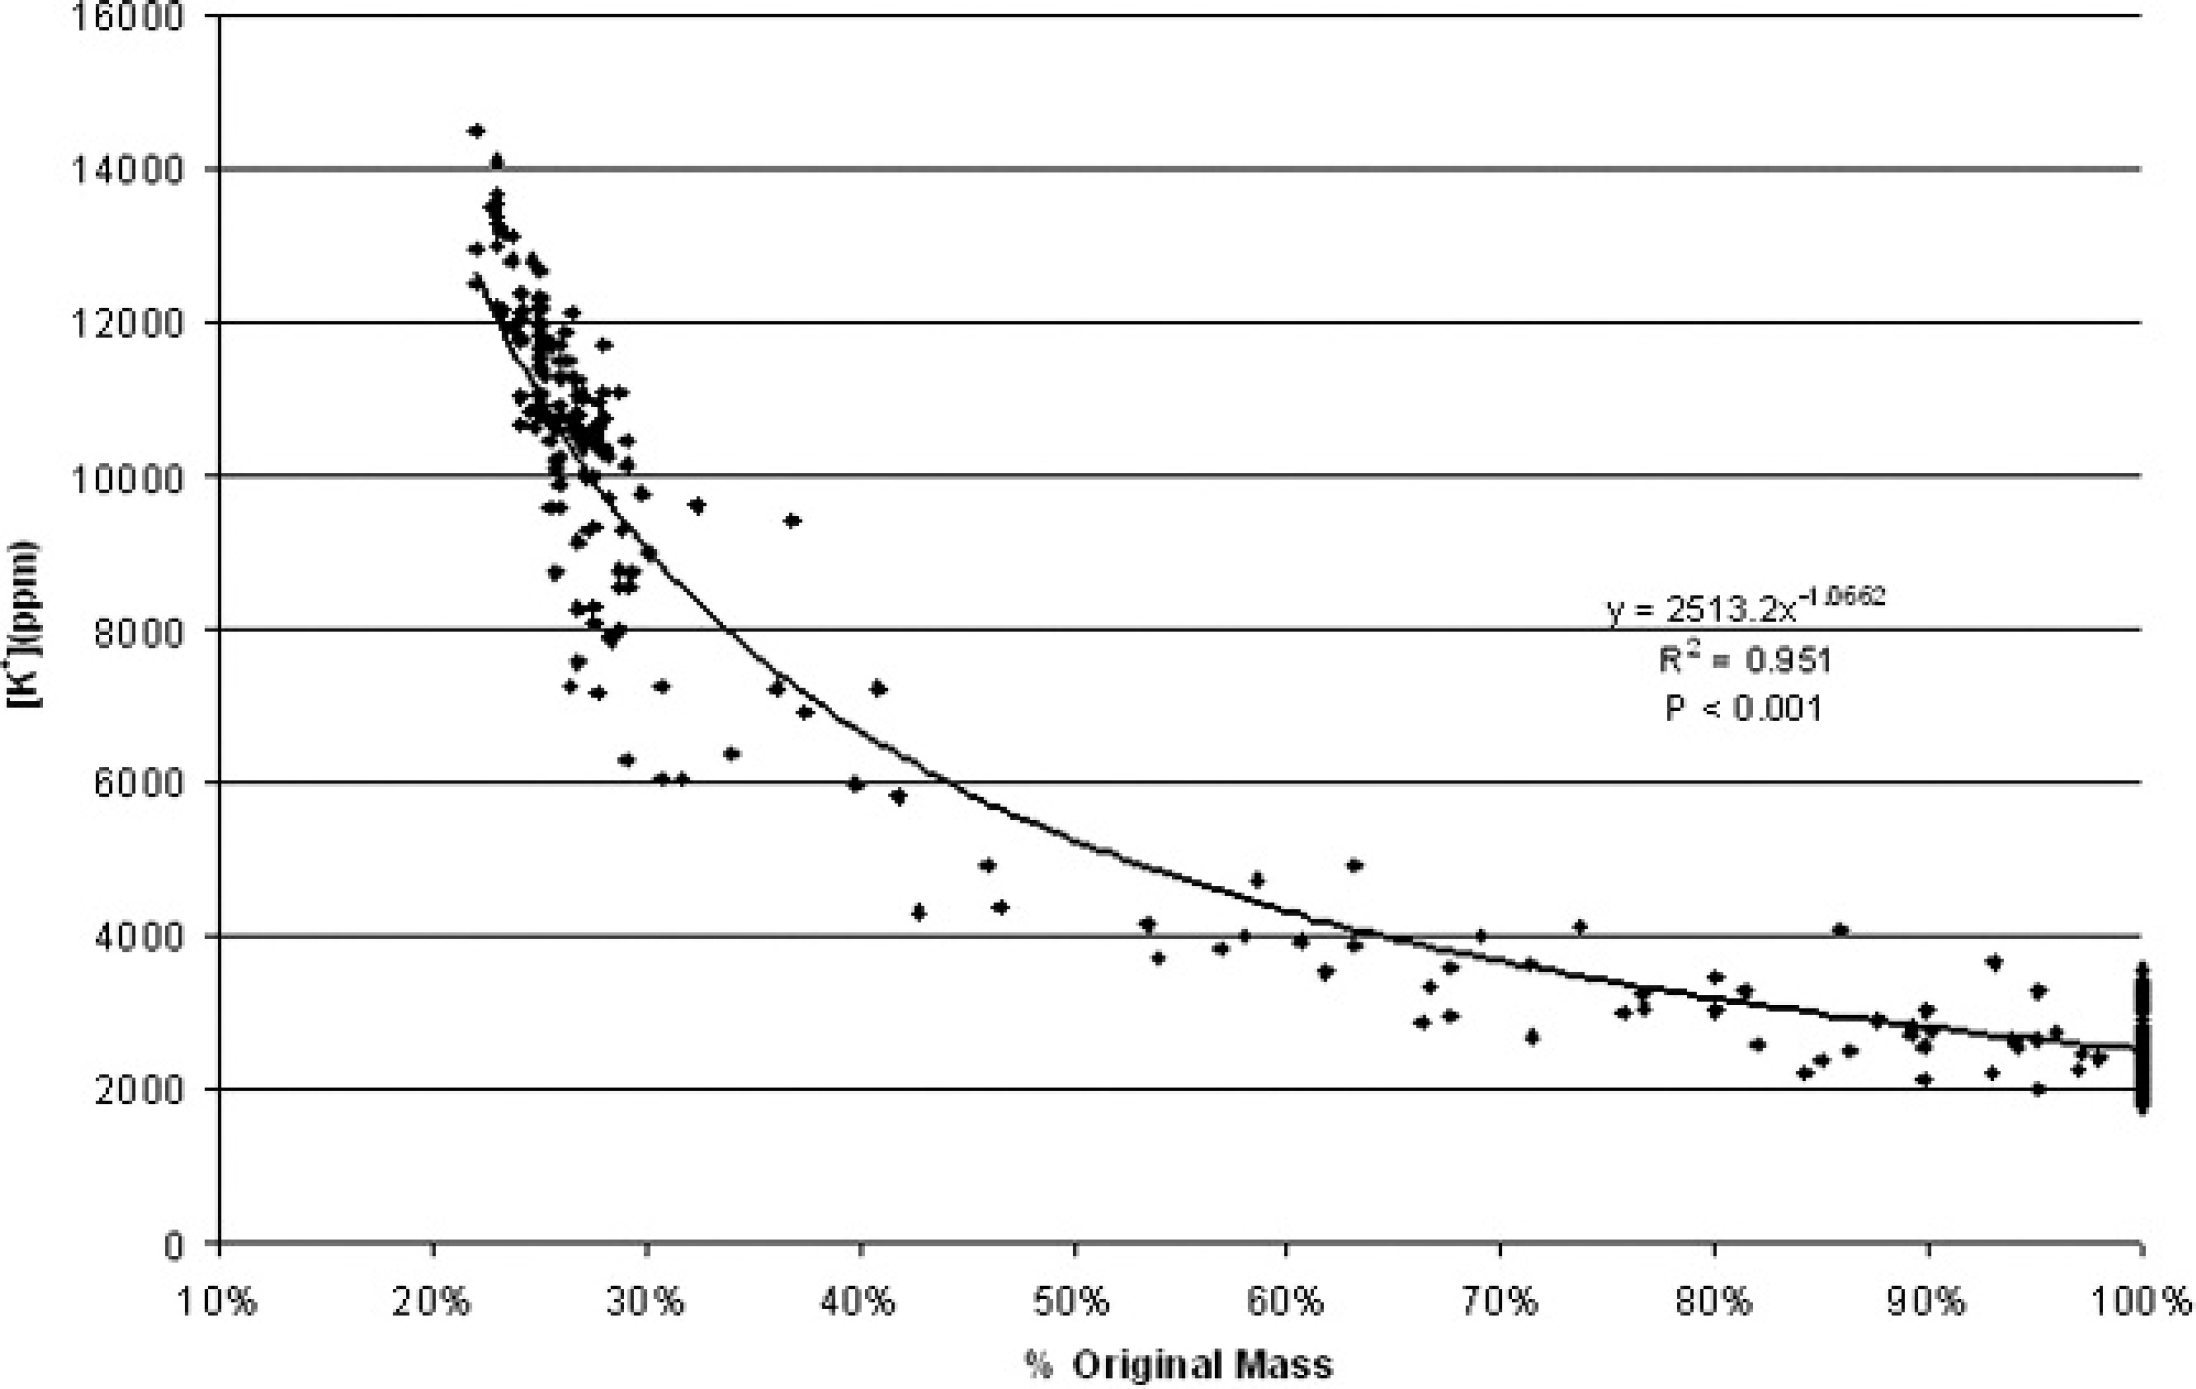
Potassium concentration (ppm) versus percentage of dry matter in liver samples (n = 291).
The results of phase 1 and 2 were validated by analyzing 48 clinical biopsies from 16 animals that produced a highly significant (P < 0.001) correlation with a similar best-fit equation of y = 2321.4x −0.952 and a correlation coefficient of 0.55 (Fig. 7). An overlay graph of both the validation data and the clinical biopsy data compares the 2 correlations (Fig. 8). None of the exponents is statistically distinguishable from −1, the expected value. The best-fit line in all 3 data sets was of power-law form, where the exponent was just slightly different from x −1. This x −1 is consistent with a theoretical model relating K concentration, sample mass, and the true wet mass of the sample. To justify that −1 is the predicted exponent, the following relationship was used: % moisture (x) = sample mass (m)/true wet mass (TWM), and thus m = x × TWM. Therefore, since [K+] = mass K+ (mK)/sample mass (m), then [K+] = mK/(x × TWM) or [K+] = (mK/TWM) × x −1. The coefficient of (mK/TWM) is a constant ratio representing the concentration of K+ at 100% of the original mass (no moisture loss).
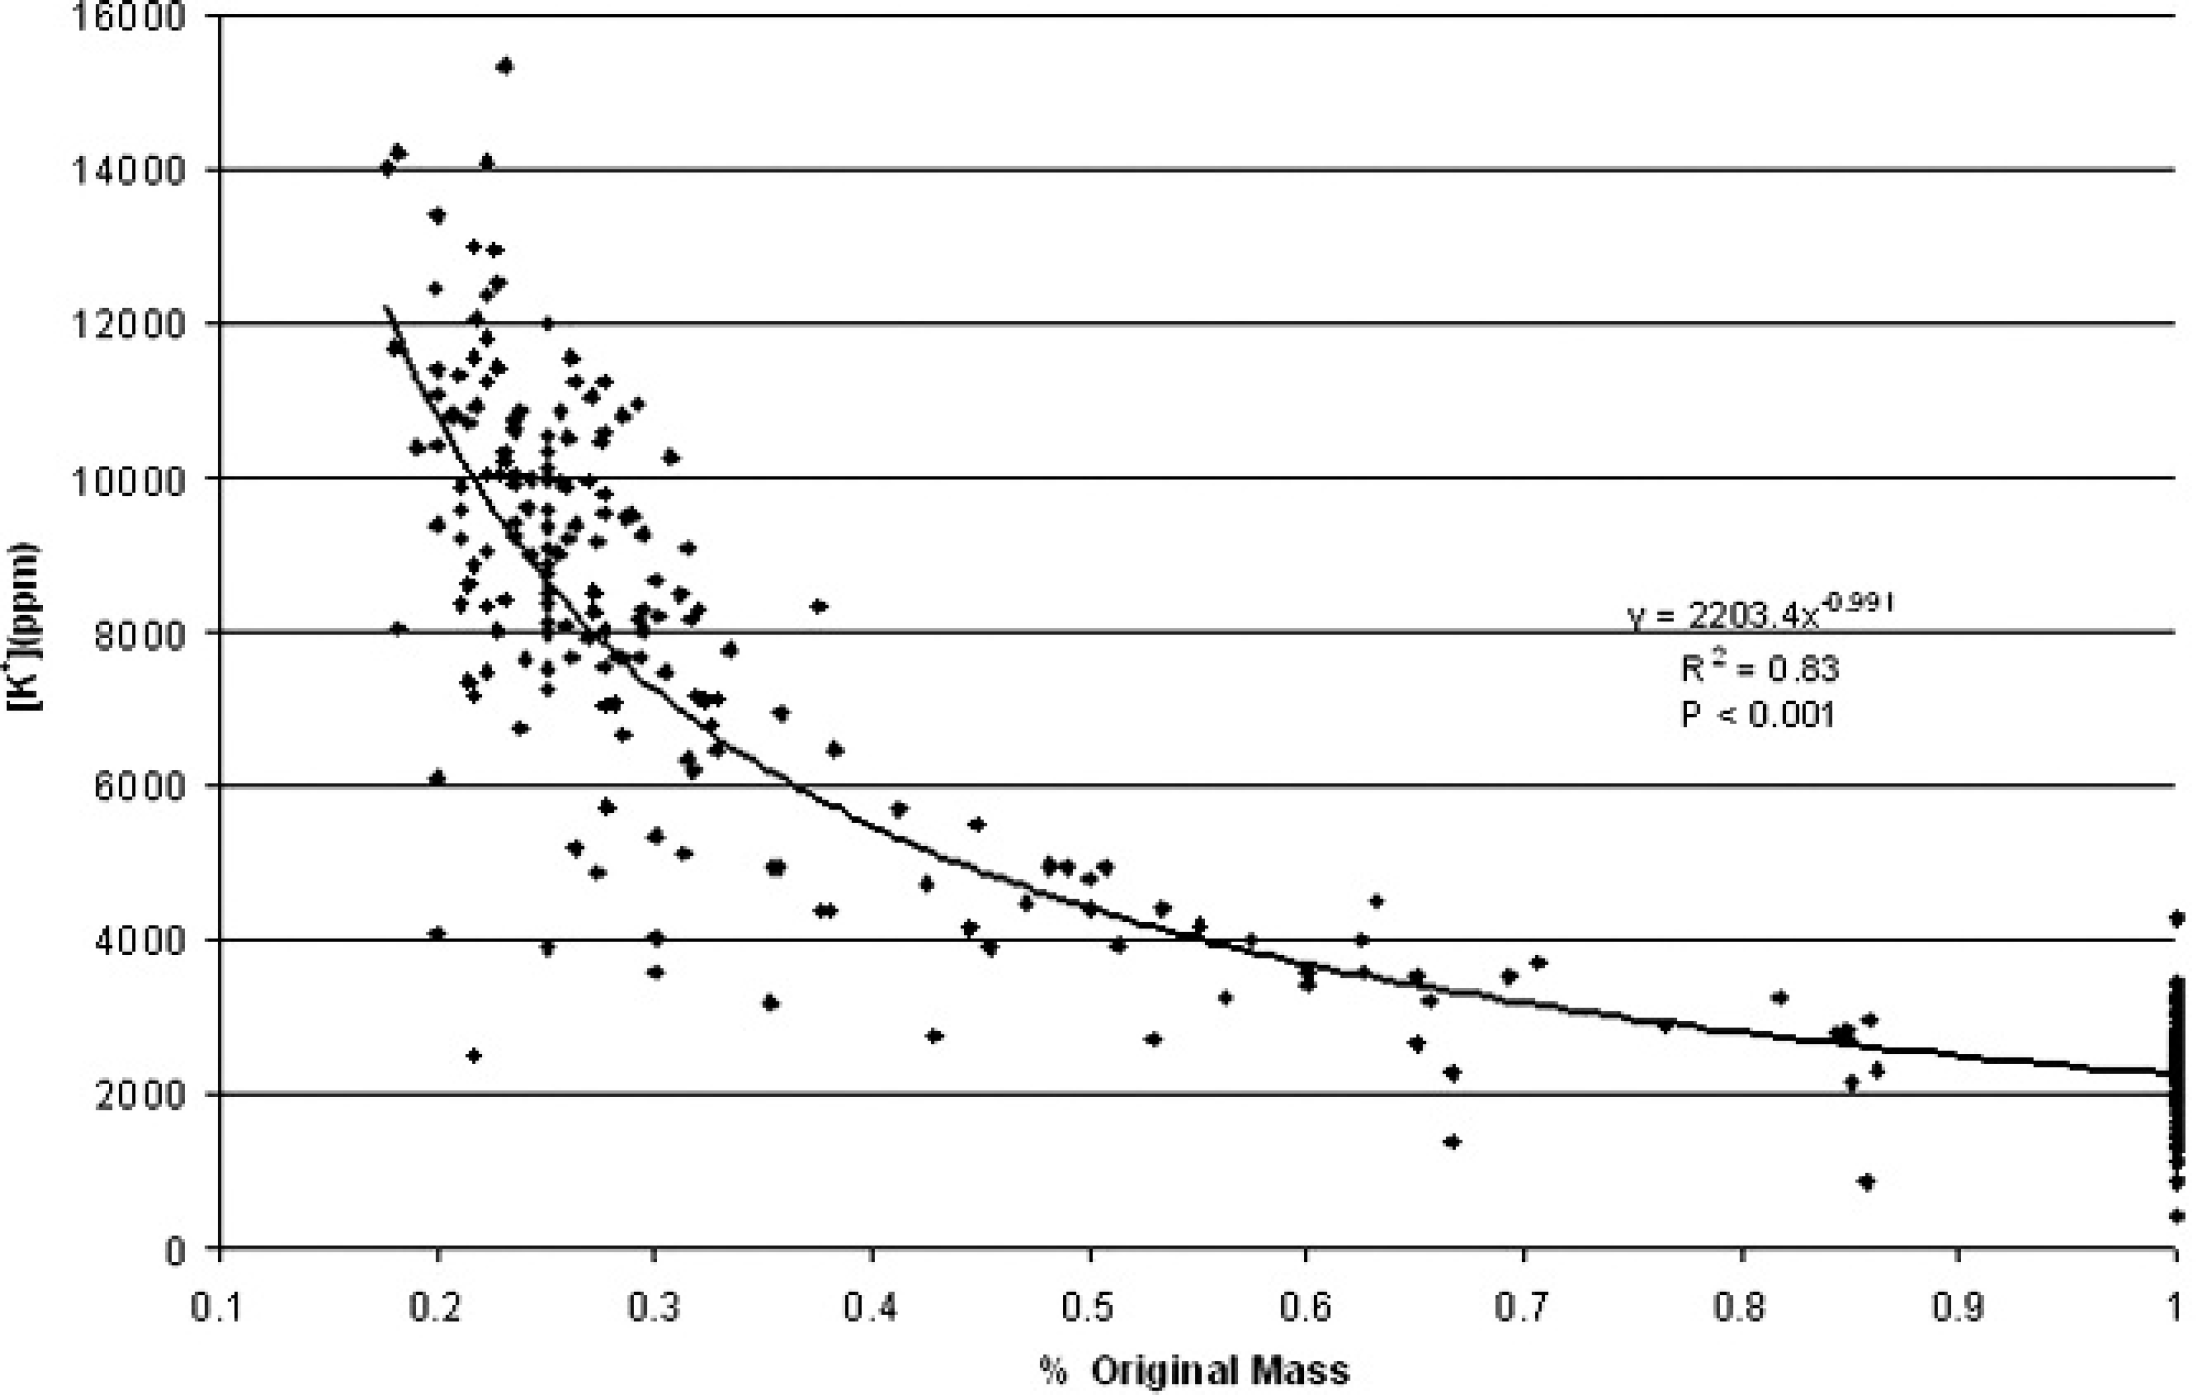
Potassium concentration (ppm) versus percentage of moisture in liver clinical biopsy samples (n = 288).
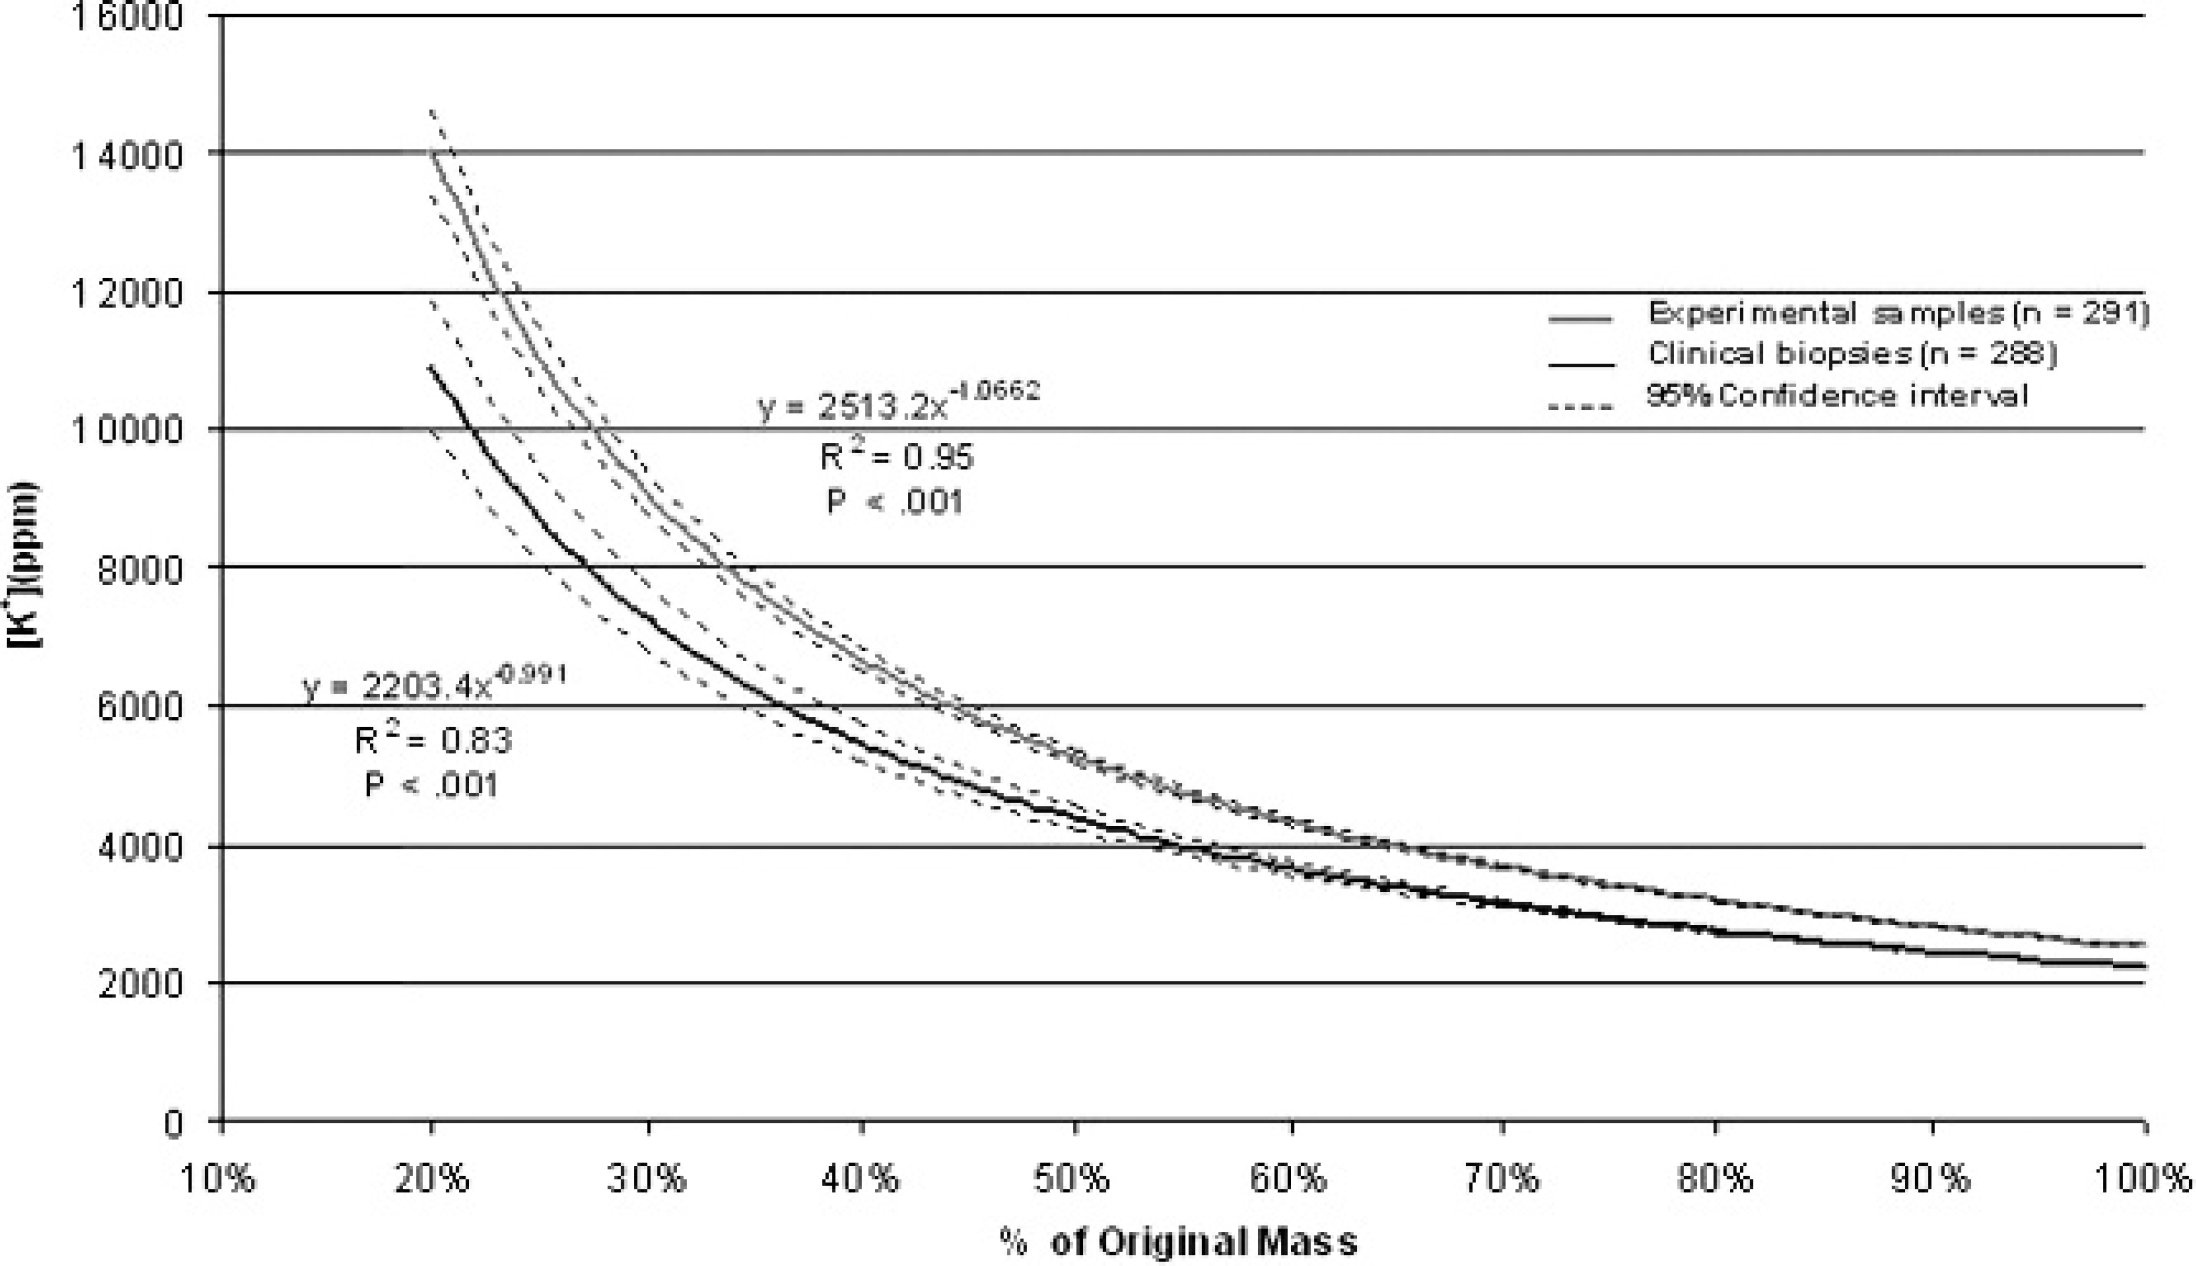
Comparison of potassium concentration (ppm) versus percentage of dry matter in liver (n = 291) and liver biopsies (n = 288).
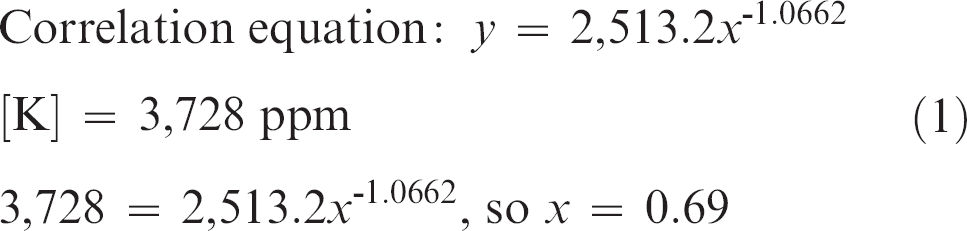
The experimentally established correlation equation was used to calculate original moisture content on the biopsies from the validation study. The calculated moisture contents were then used to predict original wet weight copper concentrations, which were then compared with the actual copper concentrations as demonstrated in Equations (1) and (2). Potassium concentration is the dependent variable y in ppm, and the moisture content is the independent variable x in the established correlation equation. As an example, using the analytically determined y, x can be predicted for the given sample:
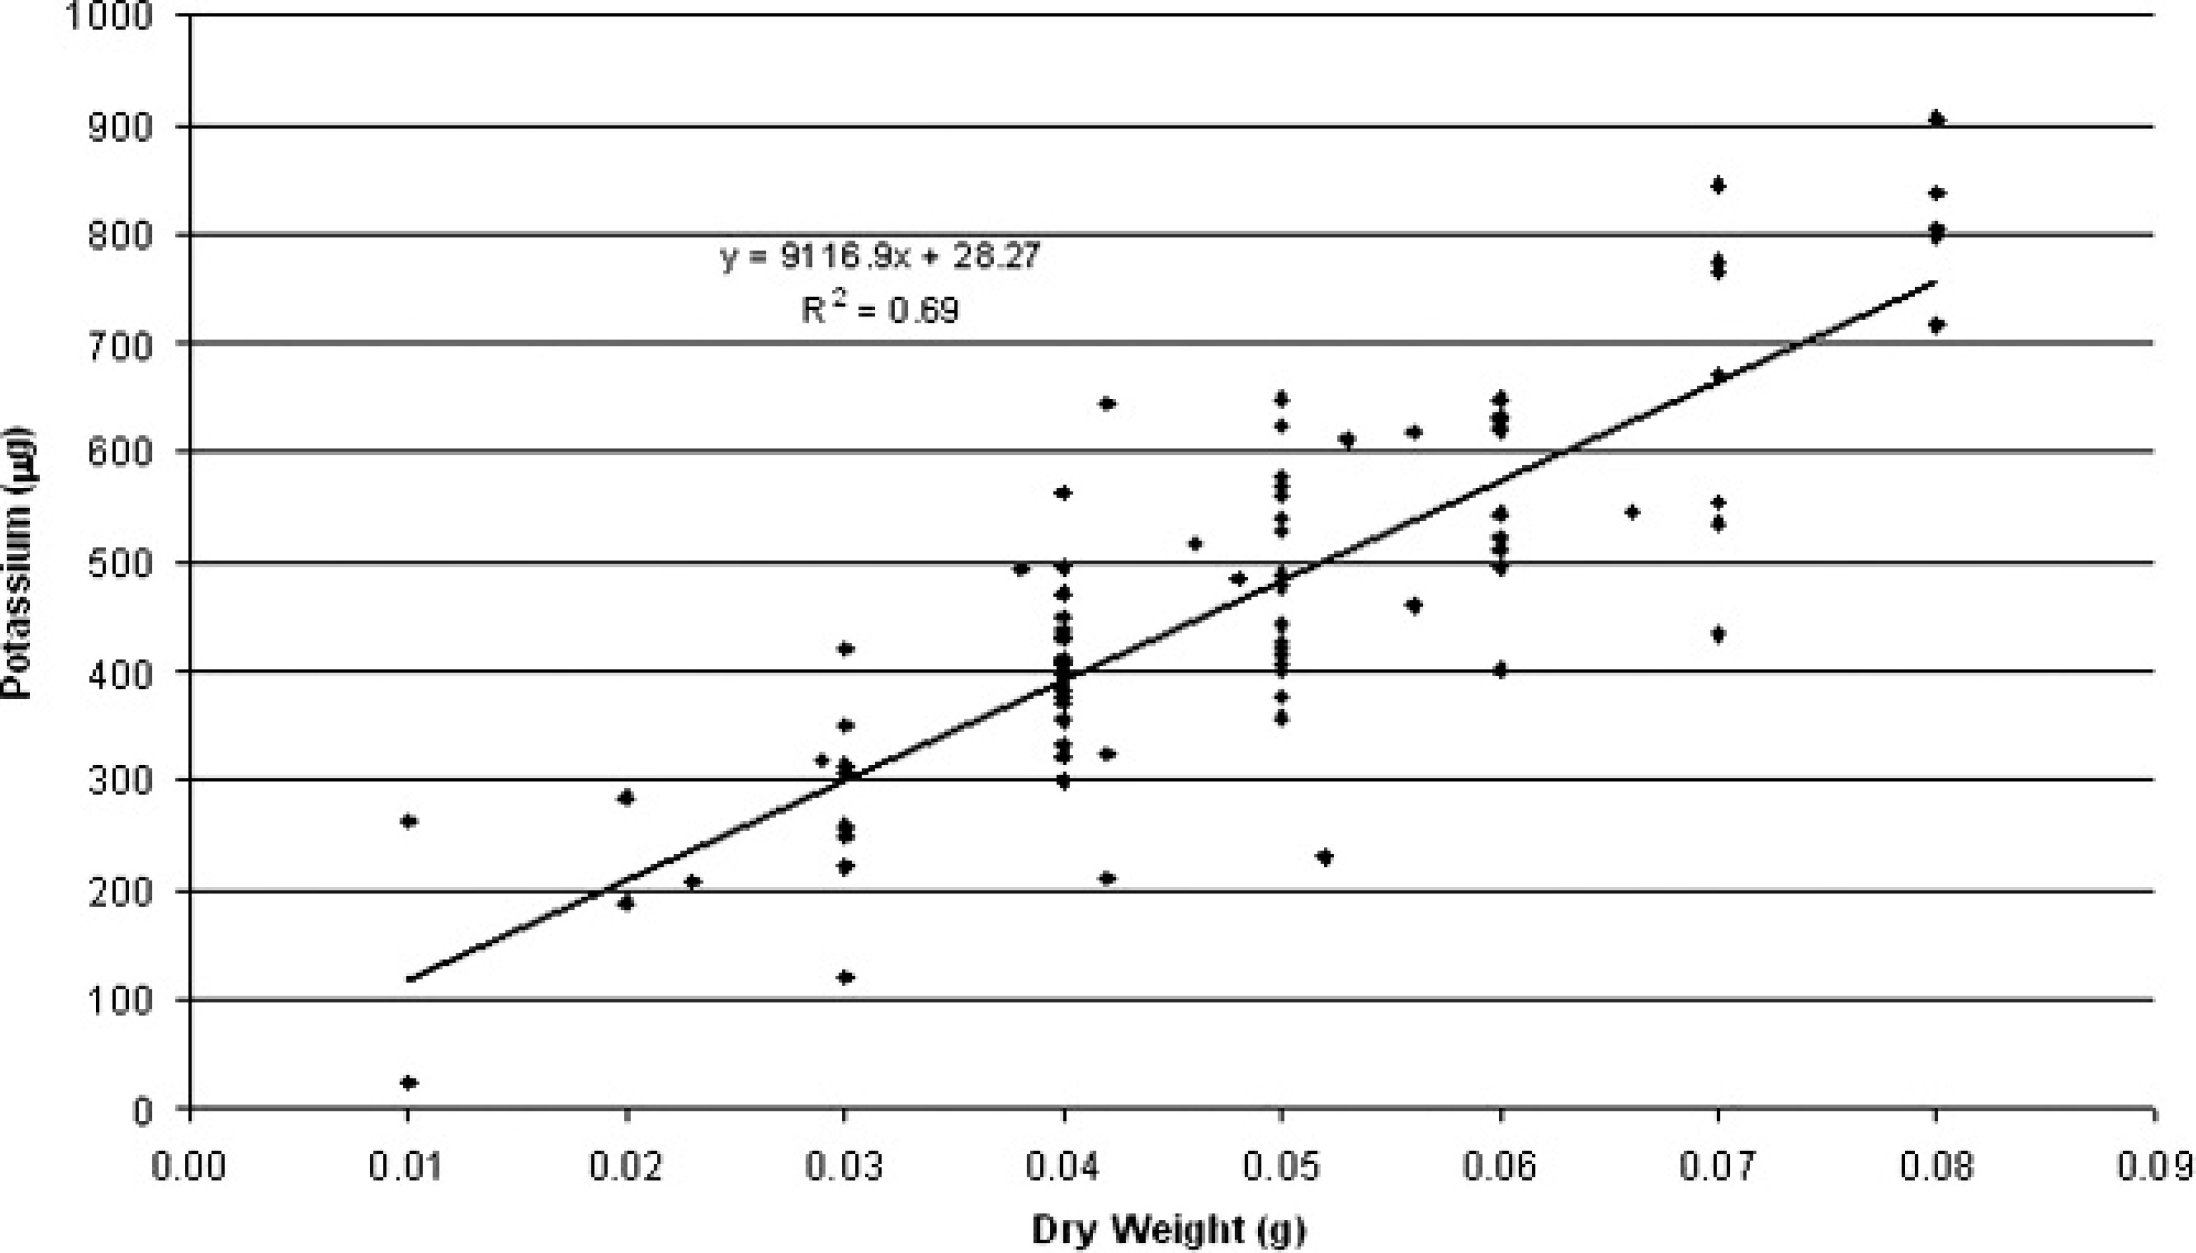
Correlation of total potassium (μg) versus liver biopsy dry weight (n = 86).
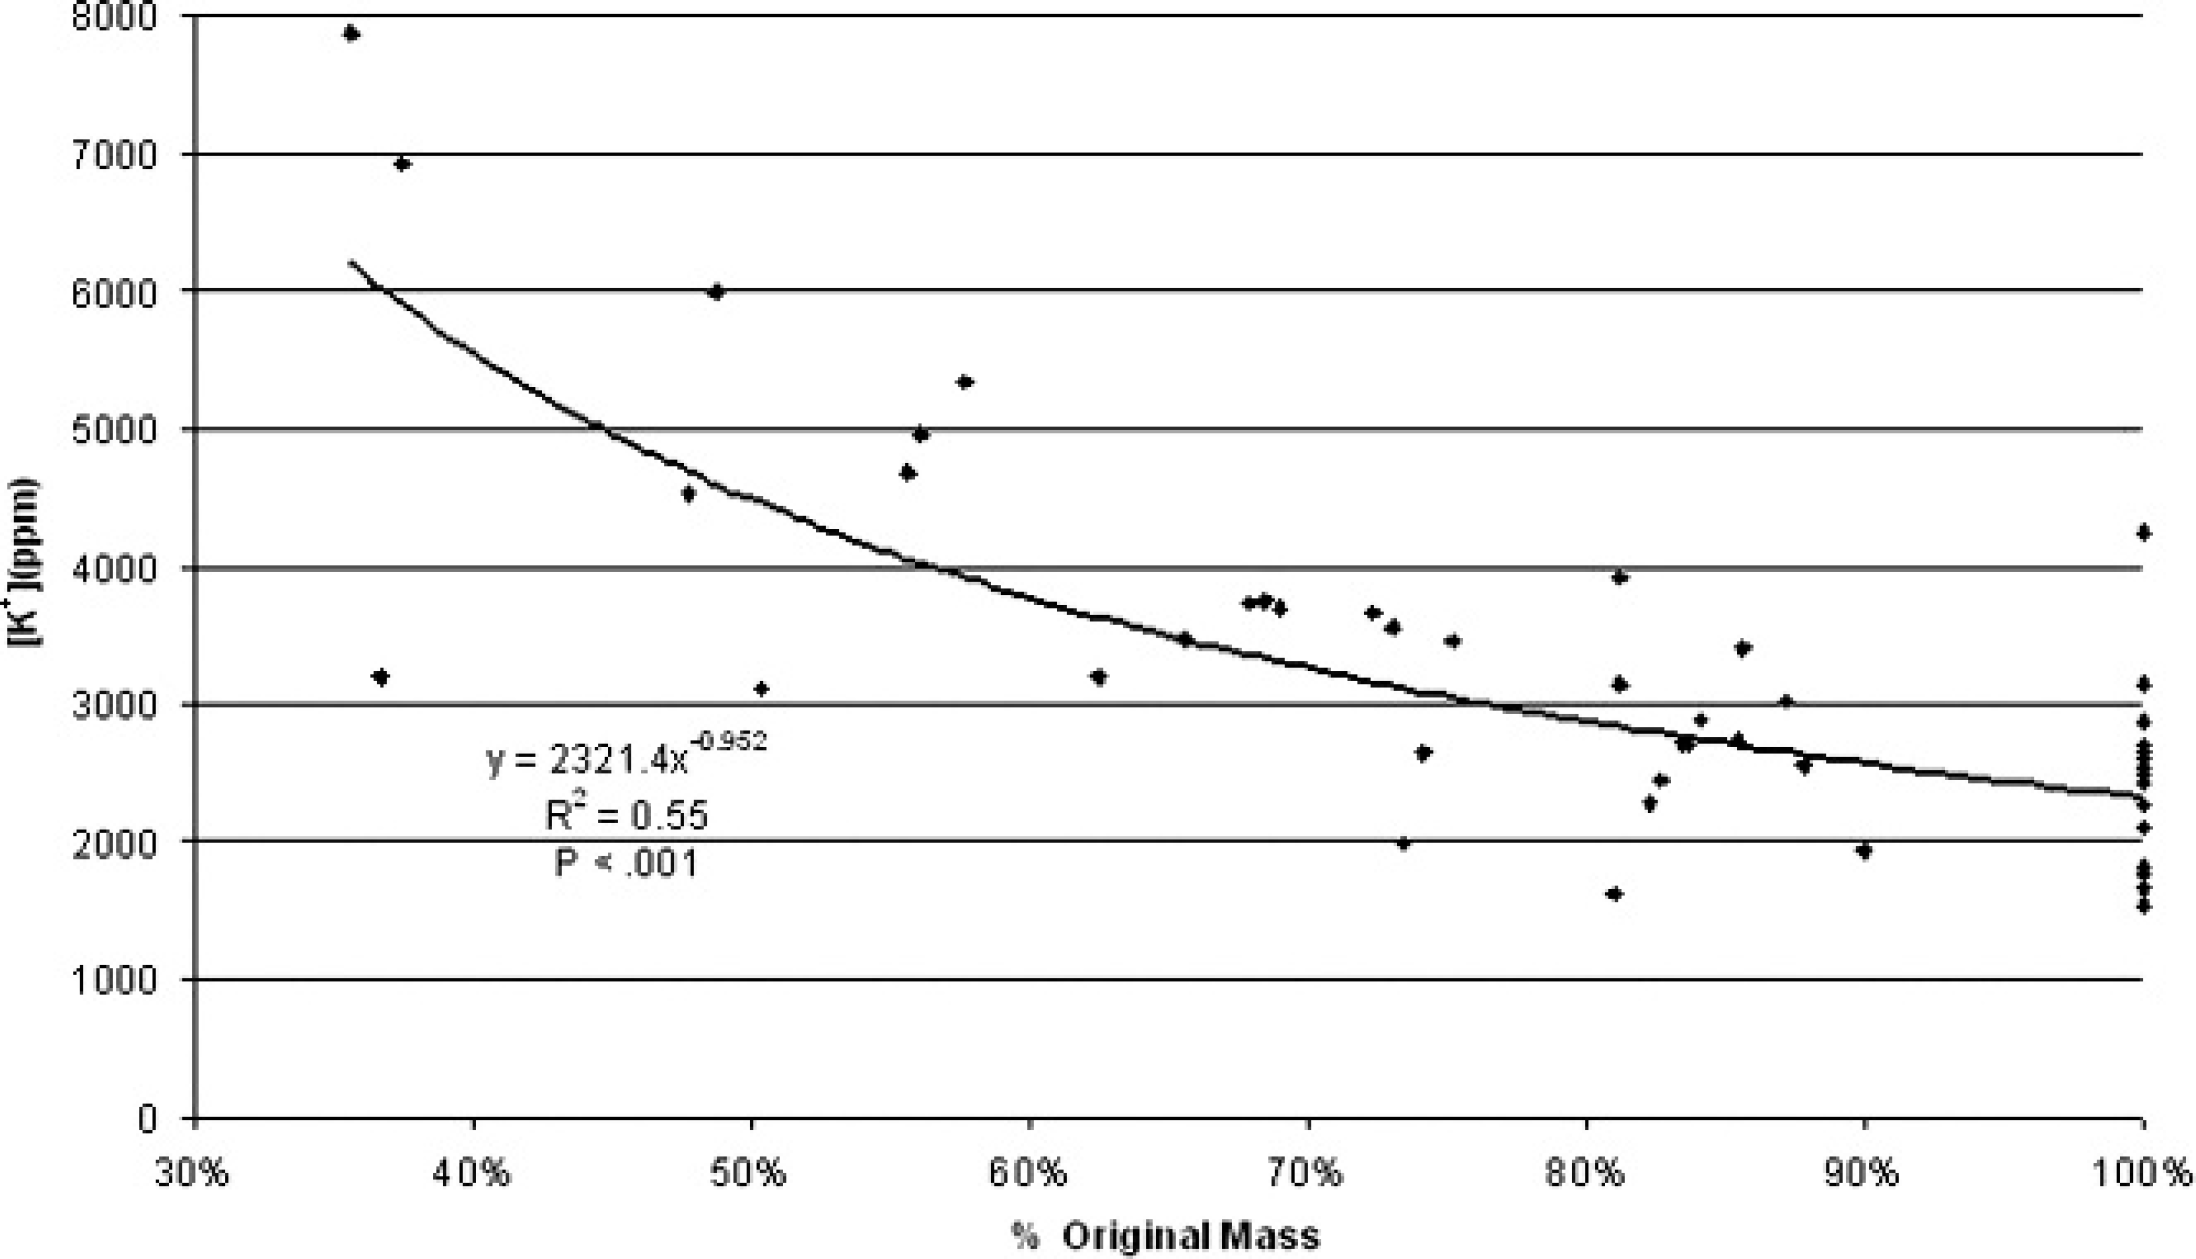
Potassium concentration (ppm) versus percentage of dry matter in validation study liver biopsies (n = 48).
Therefore, the original, fresh liver sample was 69% moisture and 31% dry matter.
This calculated percentage of moisture was then used to adjust the concentration of other minerals, such as copper:
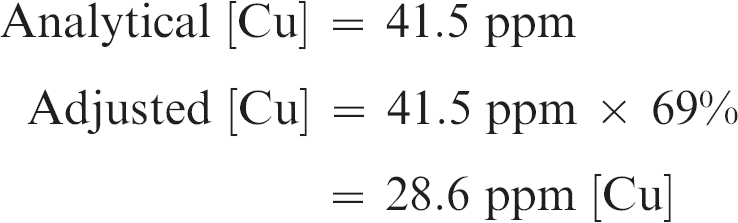
For validation, the adjusted [Cu] was then compared with the true wet weight [Cu], which was the concentration that was obtained from the liver sample placed in water to preserve all moisture.
The diagnostic properties of the predicted copper concentrations were calculated according to the reference, 17 using the assumption that a wet weight copper concentration of 25 ppm or less is deficient. Of the samples of wet weight copper concentration of 25 ppm or less, 75% had predicted copper concentration less than 25 ppm (diagnostic sensitivity = 75%). All the samples that had wet weight copper concentration of 25 ppm or greater had predicted copper concentration greater than 25 ppm (diagnostic specificity = 100%). This resulted in 94% of predicted copper classification (deficient or adequate) matching the wet weight copper classification (diagnostic accuracy = 94%). All samples that had predicted copper concentration less than 25 ppm had wet weight copper concentrations less than 25 ppm (predictive value of a positive test = 100%), whereas 92% of samples with predicted copper concentrations greater than 25 ppm had wet weight copper concentrations greater than 25 ppm (predictive value of a negative test = 92%).
Discussion
A necropsy specimen or a biopsy that is submitted to the diagnostic lab is a relatively small, localized sample of the liver and an assumption is made that this accurately represents the entire organ with respect to homogeneity of mineral element concentrations. This study found that variation in mineral concentration does exist to a small degree between the 5 lobes of bovine liver. Potassium and copper are the most relevant elements in the current study, and it was found that K concentration is significantly lower in the caudate lobe than the rest of the lobes. To the authors' knowledge, this has not been reported previously in the literature. Copper was found to be significantly higher in the caudate lobe compared with the other lobes, and this was consistent with the literature. 1 The reason for lobe variation in K and copper concentrations is unknown.
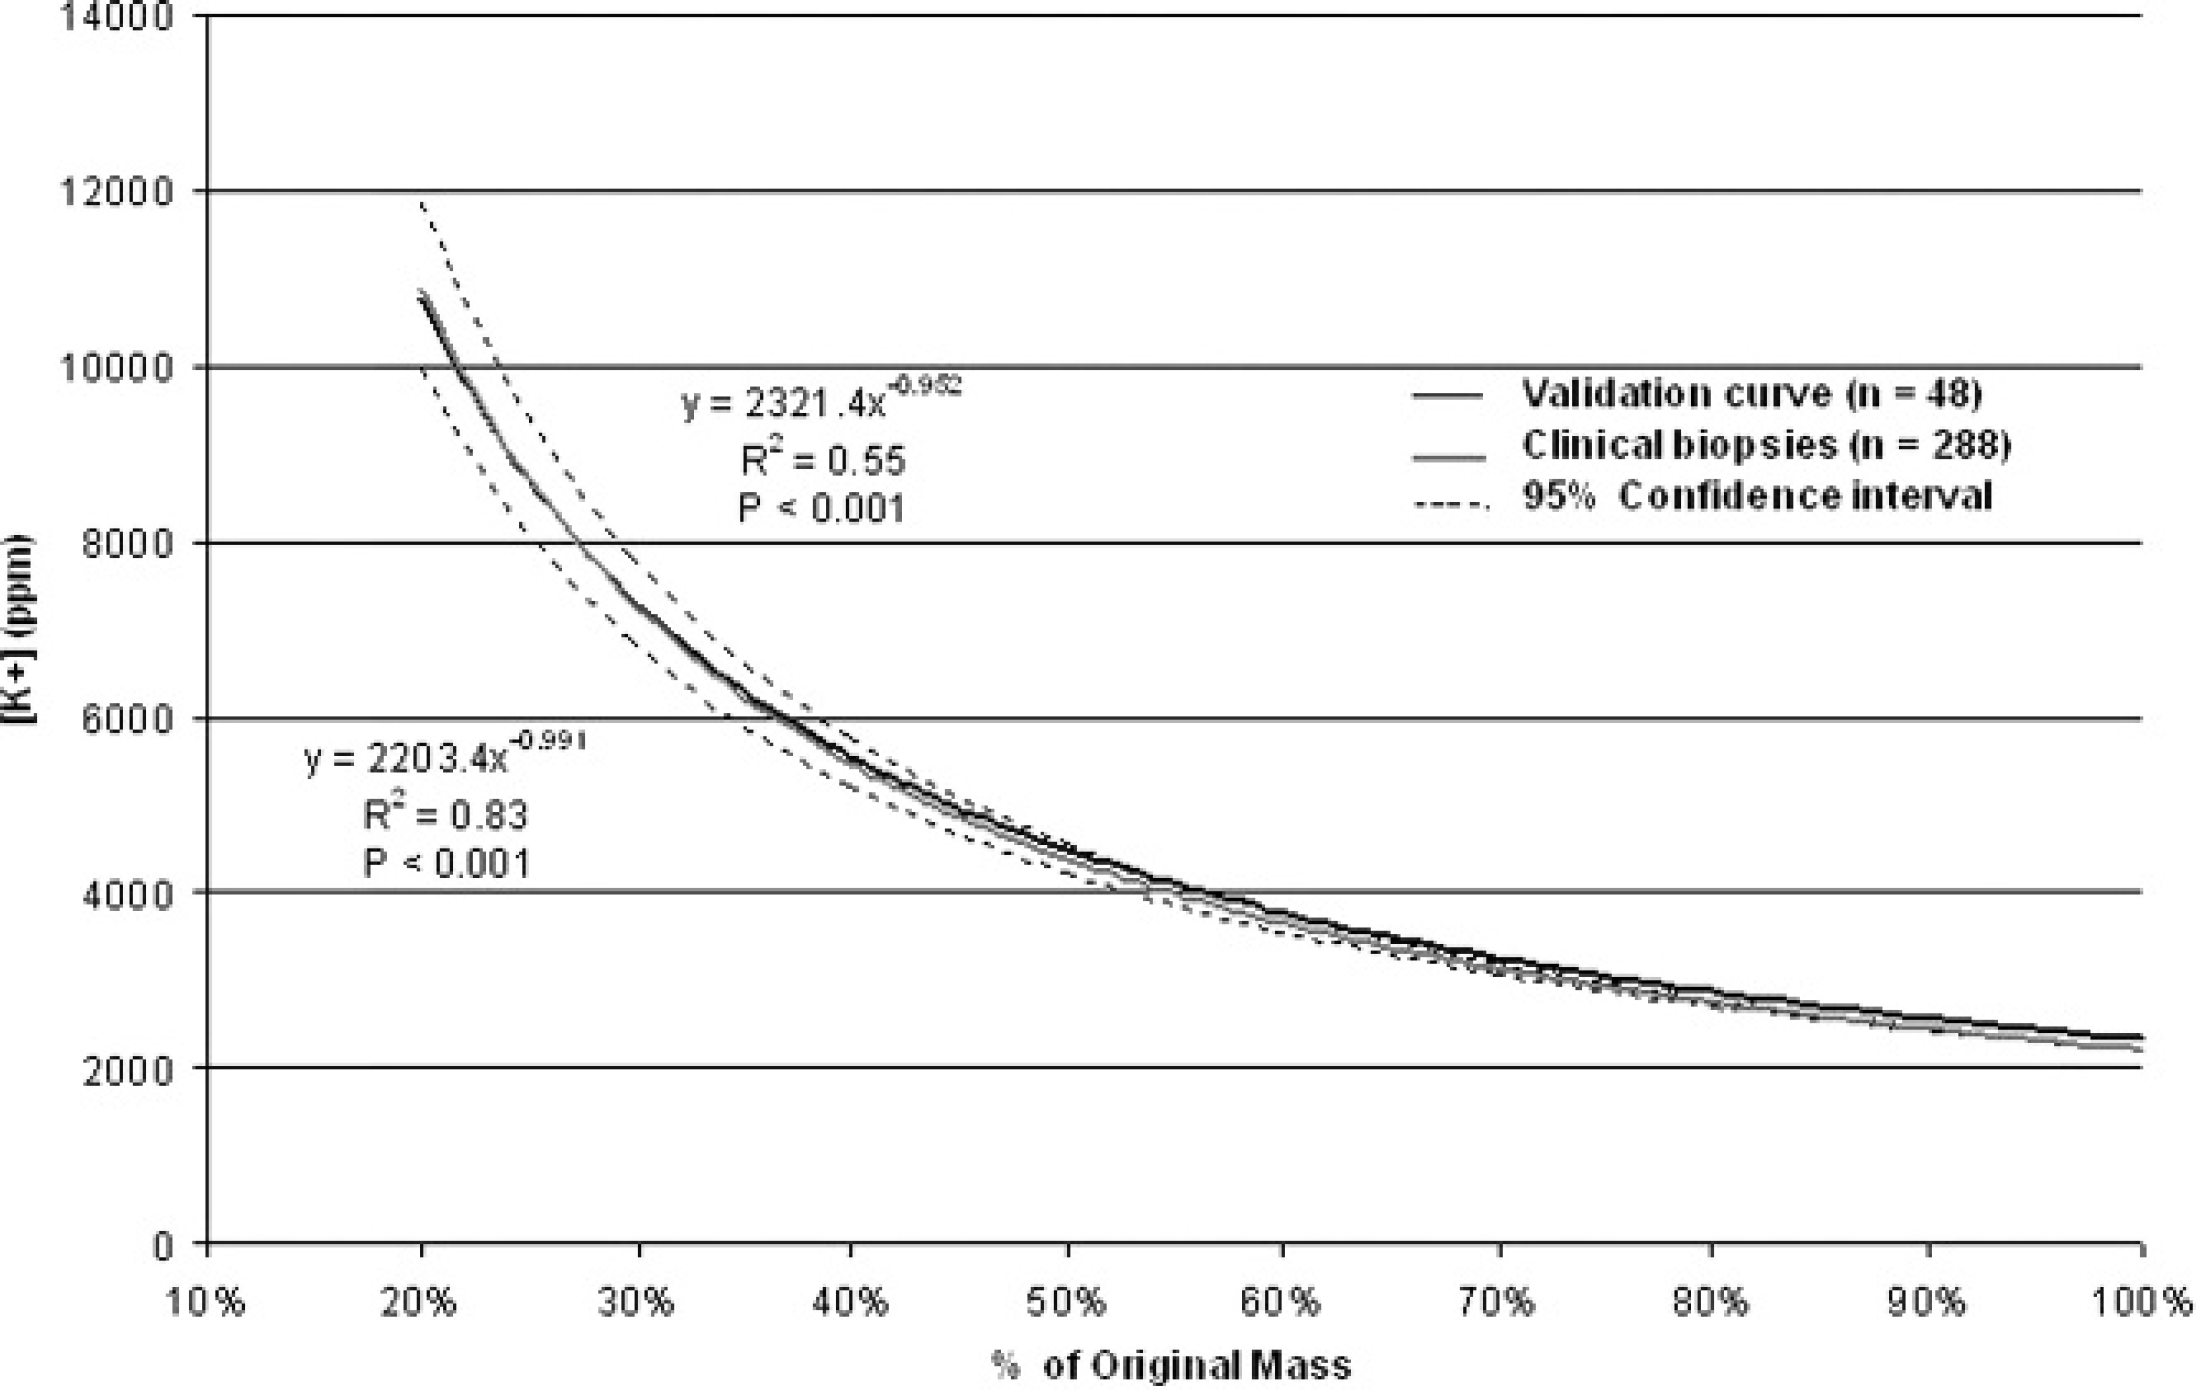
Comparison curves of potassium concentration (ppm) versus percentage of dry matter in biopsies (n = 288) and validation biopsies (n = 48).
Sampling error may occur because a sample of liver tissue cannot be visually distinguished as originating from 1 specific lobe, nor can histological examination be conclusive. Caudate lobe is easily identifiable when the entire liver is intact, which it would be in a gross necropsy. Therefore, a theoretically simple solution to this problem is to request that in-house pathologists and outside clientele avoid sampling the caudate lobe for submission to the toxicology laboratory.
Similarly, the technique of in situ liver biopsy does not guarantee a specific lobe of liver. Anatomically, the right lobe of liver is the most prominent and most likely to be sampled using the referenced procedure, 16 which uses the 10th intercostal space as the landmark. Typically the caudate lobe is positioned dorsally to the right lobe, so care should be taken not to sample too high, but this is not a foolproof method. Ultrasound can be used to guide the biopsy needle into the liver, but there again is no way to distinguish between lobes.
The goal of this study was to determine any correlation between K and percentage of moisture in bovine liver tissue. It was thought that a correlation would exist because of the homeostatic mechanisms enforcing a strong electrolyte gradient that maintains 98% of total K inside the cell. The results obtained confirm a strong correlation between K concentration and moisture content. Each of the 3 sets of data (phases 1, 2, and 3) demonstrated a significant and similar correlation. A 10–20% difference in K concentration between the graphs of experimental samples (Fig. 5) and clinical biopsies (Fig. 8) was observed. Although the equations of the 2 lines are almost identical, they are not the same and do not fall within the 95% confidence intervals of the other. A probable explanation is that the experimental samples originated in the diagnostic laboratory from a fresh, exsanguinated necropsy liver, whereas the biopsy samples were sometimes visibly mixed with blood and extracellular fluid (ECF). It is likely that variable amounts of blood or ECF can surround a liver sample taken via biopsy. The blood volume of the body and liver accounts for 8% of total mass, 9 and additional blood or ECF could become part of the biopsy specimen. This additional material can contribute to the overall sample weight and may account for the 10–20% difference in the 2 curves. Thus, it is reasonable to assume that these curves are the same.
The purpose of the validation study (phase 3) was to see how closely the predicted copper concentrations in liver (based upon the moisture content corrections) compared with actual copper concentrations in the liver under a simulated clinical scenario in which samples are submitted to diagnostic laboratories in differing states of dehydration. Diagnostic parameters of the test using just 48 samples were very good. Seventy-five percent of the truly deficient samples were correctly classified as deficient, whereas 100% of the truly adequate samples were correctly classified. This resulted in more than 90% of all samples being correctly classified as either deficient or adequate in copper, for example. Only 3 samples with wet weight copper concentrations less than 25 ppm were incorrectly classified as adequate using the predicted concentration of copper. These results demonstrate a strong correlation between liver K concentration and liver moisture content in beef cattle. This finding may serve in the diagnostic assessment of mineral status by correcting for true wet weight. Examples of this were seen in several of the validation biopsies. One biopsy sample was analyzed, and copper reported at 41.5 ppm, which is within the reference range. 4 However, when the K concentration was used to find the true wet weight, it was determined that the sample was only 69% of original wet weight. Using this correction, the actual copper concentration was calculated to be 28.7 ppm. Although still within the reference range, this value is very close to being classified as deficient. This clearly demonstrates that the moisture level of the sample is an important variable in diagnostic assessment, and unknown percentages of moisture can potentially lead to false diagnoses.
The results of this study produced 3 very similar but separate correlations—1 for experimental necropsy samples, 1 for clinical biopsy samples, and 1 for the validation biopsies. Although they may indeed be 1 and the same curve, it is worth considering the usefulness of 2 individual correlations. Some of the sample submissions to a diagnostic lab are liver biopsies from live cows similar to those conducted in this study, so the appropriate curve would be the clinical biopsy correlation. The other common sample received is a small piece of exsanguinated liver harvested from a dead cow taken at necropsy. In this case, the experimental sample (phase 1) correlation would be the most appropriate relationship to use. The third type of sample submission represents the gray area between the 2 curves, and this is a liver sample submitted from an outside source from a dead cow that has not been exsanguinated. In that situation, it is logical that the biopsy correlation would be a more accurate approach, but the true correlation is probably somewhere in between because the animal is dead, but the sample may contain blood or ECF.
This research did confirm some regional (lobe) differences in certain mineral concentrations in bovine liver and perhaps the right lobe might represent a good choice for standardized sampling for elemental analyses. This data will also allow the diagnostic laboratory a method to calculate a corrected wet weight for liver samples and to report elemental concentrations on a corrected wet weight basis. It was also found that adult bovine liver was 26.7% dry weight versus the common assumption of 30% dry weight. 15
Future study possibilities include investigation of K concentration correlations in various other diagnostic tissues of cattle, such as brain and kidney. This could also include investigation of K concentration correlations in other food animal species that are prone to mineral deficiency, such as ovine and caprine species.
Footnotes
a.
California Animal Health and Food Safety, Davis, CA.
b.
Microsoft Corporation, 9.0.3821 SR−1, Redmond, WA.
c.
Palisade Corporation, Newfield, NY.
d.
SPSS Inc., Chicago, IL.
e.
University of California, Davis, Animal Science Beef Unit, Davis, CA.