
Abstract
The emergence of severe porcine circoviral disease in North America is associated with Porcine circovirus-2 genotype b (PCV-2b), which has led to speculation that PCV-2b is more virulent than PCV-2a. The objectives of this study were to 1) correlate the PCV-2 DNA concentration and lesions in wasting (WST) and age-matched healthy (HLTH) pigs from 2 clinically affected farms, and unaffected (UNFCT) pigs from a farm with no prior clinical or diagnostic history of PCVD; and 2) to determine the initial estimates of sensitivity and specificity of PCV-2 quantitative polymerase chain reaction (qPCR). PCV-2b was confirmed in all 3 farms. Compared with HLTH pigs, WST pigs demonstrated significantly more prevalent thymic atrophy, failure of normal pulmonary collapse, and ascites (P < 0.017 for all). The HLTH and UNFCT pigs had significantly more pronounced lymphoid germinal centers and proliferative paracortical T-dependent zones, compared with WST pigs (P < 0.017). Across all tissues, PCV-2 DNA concentrations were significantly higher in WST compared with HLTH and UNFCT pigs (P < 0.017 for all). The PCV-2 DNA concentrations were strongly correlated with PCV-2 nucleocapsid staining intensity in lymph node, spleen, Peyer's patches, lung, liver, and kidney (0.60 ≤ r ≤ 0.84). In the current study, the PCV-2 DNA log10 cutoff concentrations best able to distinguish WST from HLTH and UNFCT pigs were between 7.0 and 8.0 per gram for tissues, and between 4.0 and 5.0 per milliliter for sera. The presence of PCV-2b in UNFCT pigs is evidence that PCV-2b by itself is not sufficient to induce severe disease.
Introduction
After its discovery in Canada in the mid-1990s, 9 postweaning multisystemic wasting syndrome (PMWS) was noted only sporadically in North America for about a decade. Since late 2004, however, the Porcine circovirus diseases (PCVD), including PMWS, have resulted in severe epidemics in various regions throughout North America and now threaten the competitiveness of the North American swine industry. Many, if not most, PCVD herd outbreaks in North America since 2004 coincide with the isolation of a Porcine circovirus-2 (PCV-2) genotype, first identified by restriction fragment length polymorphism (RFLP) analysis as PCV-2–321, 4 and later termed PCV-2b. 7 Based on the near simultaneous emergence of PCV-2b and epidemics causing severe mortality in affected North American herds, some speculate that PCV-2b is of enhanced virulence.
The cause and epidemiology of PCVD have been extensively researched and debated. Although PCV-2 infection is clearly a necessity and is the only virus consistently recovered from PMWS cases, 2,6,11 other cofactors are necessary to induce disease. Virtually all commercially raised pigs, however, are subclinically infected with low concentrations of PCV-2, 1,13 yet they remain clinically healthy and do not develop disease. By contrast, very high concentrations of PCV-2 are present in the tissues of affected animals, and these concentrations are correlated with the severity of clinical signs and histologic lesions. 3,5,10,12,20 Thus, increasing viral load appears to be a critical step in the development of severe PCVD.
The objectives of the current study were to 1) compare the PCV-2 load in the lymphoid and nonlymphoid tissues of wasting and healthy pigs of 2 clinically affected farms infected with PCV-2 but selected on the presence of PCV-2b, and compare to unaffected pigs originating from a clinically unaffected farm in which PCV-2 was circulating but the genogroup was not characterized before onset of the experiment; 2) correlate tissue PCV-2 DNA concentrations with the severity of microscopic lesions and the amount and distribution of PCV-2 nucleocapsid protein in these sections; 3) determine the biologically relevant viral load (DNA copies per gram tissue or milliliter sera) that distinguishes wasting from non-wasting pigs; and 4) determine the most appropriate diagnostic samples to submit for the antemortem diagnosis of PCVD in swine populations.
Materials and methods
All procedures were conducted in accordance with the University of Saskatchewan's Committee for Animal Care and Supply (permit #20060004). The authors conducted a descriptive case control study that compared severely affected wasting (WST) pigs to age-matched healthy (HLTH) cohorts originating from each of 2 farms (A and B), and to unaffected (UNFCT) pigs from a PCV-2–infected farm with no prior clinical or diagnostic history of PCVD (farm C).
Farms
Three western Canadian farms were selected based on their PCVD history. Farms A and B had experienced a recent doubling of postweaning mortality fulfilling the generally accepted PCV-2 case-definition. 21 Farms A and B were both farrow-to-finish farms containing 1,200 sows that had an excellent health status, including freedom from Porcine reproductive and respiratory syndrome virus (PRRSV), Mycoplasma hyopneumoniae, Swine influenza virus (SIV) H1N1, Actinobacillus pleuropneumoniae, and Haemophilus parasuis based on clinical history and/or serologic testing. Farm A had prior diagnostic confirmation of SIV H3N2, and farm B had experienced sporadic clinical disease caused by Actinobacillus suis. Both farms were owned by the same company and were managed in a similar manner, including the routine use of water and feed medications in nursery-aged pigs. Farm C was unrelated to farms A and B, used similar genetic lines, and was of similar high health status, but it was clinically free of A. suis and SIV. Although PCV-2 had never been formally isolated from farm C, past serologic results (data not shown) indicated that the herd was infected with PCV-2, and therefore PCV-2 was assumed to be actively circulating in nursery and/or grower pigs.
Assessment of Porcine circovirus-2 genotypes
Before the onset of the experiment, necropsy examinations were performed on 3–5 representative wasting pigs from farms A and B (March and May 2006, respectively). Nucleocapsid genes (open reading frame 2 [ORF2], nucleotides 905–1745 of PCV-2 GenBank accession DQ220739) detected in the lymph nodes of 2 representative pigs from each farm were polymerase chain reaction (PCR) amplified (primer sequences: PCV-2-F (905) 5′-GAATGCTACAGAACAATCCACGG-3′; PCV-2-R (1745) 5′-CGTTTTCAGATATGACGTATCCA-3′) and purified (collaboratively by Prairie Diagnostic Services and Western College of Veterinary Medicine, Saskatoon, Saskatchewan, Canada) using a commercial kit, a according to the manufacturer's instructions. The PCR fragments were sequenced at the National Research Council–Plant Biotechnology Institute (Saskatoon, Canada) to identify the PCV-2 genotypes present on each farm. The lymph nodes from 2 farm-C pigs necropsied during the experiment (October 2006) were also ORF2 PCR amplified (Prairie Diagnostic Services, Saskatoon) and sequenced. Raw PCR product sequence data received were analyzed using the Staden Package (version 1.6.0). 22 Alignments were done using ClustalW software. 23 Identification of 2a and 2b genotypes was based on phylogenetic analysis and pairwise sequence comparisons of amplified ORF2 sequences with published representatives of the genotypes. 7
Pigs
From farms A and B, 10 pigs demonstrating severe WST, with or without enlarged superficial inguinal lymph nodes, dyspnea, jaundice, diarrhea, and pallor, were selected from the nursery (8–11 weeks of age; n = 5) and from grower barns (12–14 weeks of age; n = 5), along with an equal number of age-matched cohorts in good health, body condition, and located in the same room (HLTH). From farm C, 10 pigs of similar genetic lines, in good health and body condition, and age-matched to the farm A and B pigs were selected (UNFCT). Unlike farms A and B, incidental lesions were present in 8 of the pigs from farm C: small umbilical hernias (6 pigs), and cryptorchidism (2 pigs), as these animals were preferentially selected based on their decreased economic value. The 3 farms were sampled between March and October 2006. Animal selection occurred on 1 day in farms A and C, and over 2 days in farm B. With the exception of the farm-A HLTH group, all animals were euthanized on the farm and transported within 1.25 hours to Prairie Diagnostic Services where necropsy examinations were performed. HLTH pigs from farm A were transported live and were euthanized at the necropsy laboratory. Before humane euthanasia by way of cranial captive bolt, all pigs were ear tagged, and 10 ml of blood was collected via the jugular vein using sterile vacuum tubes.
Sample collection and processing
Sera were separated from clotted blood and frozen at −80°C pending quantitative (q)PCR analysis. During necropsy, all gross lesions were recorded, and lymphoid (bronchial, mesenteric, and superficial inguinal lymph nodes; thymus, tonsil, ileal Peyer's patches, spleen) and nonlymphoid (liver, lung, kidney, myocardium, gluteal muscle) tissues were collected for further examinations. Additionally, lesional tissues were submitted as appropriate for histopathology and bacteriology. Fresh tissues were frozen at −80°C. For histopathology and immunohistochemistry (IHC), tissues were fixed in 10% buffered formalin, processed routinely, and embedded in paraffin wax. Five-micron sections were cut and stained with hematoxylin and eosin (HE) and for IHC PCV-2 nucleocapsid protein, b as previously described. 16,17
Assessment of microscopic lesions and IHC staining
The severity and distribution of PCV-2–associated microscopic lesions, and the intensity and distribution of PCV-2 nucleocapsid antigen staining, were assessed independently by 2 veterinary pathologists (Krakowka and Ellis) without knowledge of the experimental design or pig group identity. Briefly, HE-stained tissues were scored using a subjective system (0 to 3) modified slightly (omitted score = 4) from that previously described. 10 Scores of 1 to 3, respectively, corresponded to changes identified as minimally, moderately, or severely different from normal tissue (score = 0) on the basis of reticuloendothelial (re) cell (macrophages and histiocytes) infiltration and proliferation, germinal center formation (gc), depletion of paracortical T-cell–dependent areas (Tdepl), proliferation of paracortical T-cell–dependent areas (Tprl), and the presence of syncytial giant cell formation or PCV-2 inclusion bodies (Syn/ICB) in lymph nodes (collective score for mesenteric, superficial inguinal, and bronchial nodes); cortical depletion (Tdepl) and the presence of syncytial giant cell formation (Syn) in the thymus; interstitial pneumonia (Interst), suppurative bronchopneumonia (Sup), and granuloma formation (Gran) in the lung; lymphocytic/plasmacytic inflammatory cell infiltrates (Lypl), and hepatocyte necrosis (Ne) in the liver; and Lypl, Gran in the kidney. The PCV-2 nucleocapsid staining intensity was scored (0 to 3) in lymphoid (bronchial, mesenteric, and superficial inguinal lymph nodes, thymus, tonsil, ileal Peyer's patches, spleen) and nonlymphoid (liver, lung, kidney, myocardium, gluteal muscle) tissues using a subjective scoring system modified slightly (omitted score = 4) from that previously described. 10 Finally, a third histologic examination of all tissues, including other lesional tissues, was performed by a third pathologist (Middleton) with knowledge of the pig identification numbers, farm of origin, and experimental design, in order to determine if other disease processes were present concurrently with PCVD. Additional bacterial cultures and IHC were not performed routinely on all animals but were undertaken if lesions suggestive of other diseases were identified. On the lung tissue from 3 farm-A pigs demonstrating bronchial and bronchiolar hyperplasia, type A influenza IHC was performed by Prairie Diagnostic Services as previously described, 8 with the exception that the primary antibody was goat anti-influenza A ribonucleoprotein c used at a 1:5,000 dilution.
Assessment of viral load by quantitative real-time PCR
All qPCR testing was performed by experienced technicians blind to the experimental design and pig group identity. The PCV-2 DNA concentrations were assessed at Prairie Diagnostic Services using a PCV-2 quantitative SYBR green real-time PCR assay capable of detecting both PCV-2a and b, but not distinguishing the 2 genogroups. The assay was based on amplification of an 83-bp region of the rep gene (ORF1) of PCV-2 corresponding to nucleotides 588–670 (GenBank accession no. DQ220739). Primers PCV-2–83F (5′-AAAAGCAAATGGGCTGCTAA-3′) and PCV-2–83R (5′-TGGTAACCATCCCACCACTT-3′) were used in the PCR reactions involving a 10-min incubation at 94°C, followed by 45 cycles of 30 sec at 94°C, 1 min at 59°C, and 1 min at 72°C, and a final extension of 5 min at 72°C. Real-time PCR reactions were performed in a thermal cycler and fluorescence detection system. d Target quantification was based on a standard curve constructed of a dilution series of plasmid vector containing PCV-2 target sequence. The dilution series consisted of 8 10-fold serial dilutions ranging from 6.6 × 10 6 to 6.6 × 10⁻¹ target DNA copies per milliliter. Template DNA for qPCR was extracted from 20–25 mg of tissue or 200 μl of serum using a commercial DNA extraction kit e according to the manufacturer's instructions. Each tissue sample was precisely weighed, and the sample weight was used to calculate the DNA concentration per gram of tissue. Extracted samples were run in duplicate on 96-well plates and repeated if the threshold value (Ct) of duplicate wells differed by 3 or more. Positive samples with Ct values less than the most concentrated standard (6.6 × 10 6 ) were diluted 1:10,000 in DNase-free water and rerun in duplicate. For all tests, samples were considered negative if the Ct value of the sample was equal to or greater than the average Ct values of both 6.6 × 10 1 target DNA copies/ml standards run on the same plate. All standards were run in duplicate on each plate, and entire plates were rerun if the standard curve's log fit value (r 2 ) was less than 0.95.
Statistical analysis
Differences in the frequency of gross lesions were evaluated between the health status groups (HLTH, WST, UNFCT) using the Fisher's exact test. Differences in the viral load (target DNA copies per gram or milliliter), microscopic lesion severity, and PCV-2 staining intensity were evaluated among barn and health-status group using the Kruskal-Wallis analysis of variance. Where a significant difference between group medians was detected, individual groups with different median scores were compared using a Wilcoxon rank sum test. To control for multiple tests being performed, a Bonferroni correction was applied to adjust the P value at which a significant difference was detected (P is significant where P < 0.05/k comparisons). 18 The correlations between viral load and microscopic lesion severity, and viral load and PCV-2 staining intensity, were computed using the Spearman rank correlation coefficient. Statistical comparisons were performed using Stata v9.0. f Terminology used in describing the strength of correlation is consistent with Hopkins (2000, http://www.sportsci.org/resource/stats/index.html, accessed July 25, 2007). Sensitivity and specificity were determined by comparing PCV-2 qPCR-determined DNA concentration cutoffs in the WST, HLTH, and UNFCT animals. Estimates reported herein represent initial estimates of diagnostic sensitivity and specificity due to the limited farm numbers and small sample size. Evaluation of qPCR cutoff concentrations of PCV-2 DNA in tissues and sera that maximized sensitivity and specificity within this data set was performed using receiver operating characteristic (ROC) curves. The logarithms (base 10) of qPCR-measured PCV-2 DNA concentrations in sera, pooled lymph nodes (bronchial, superficial inguinal, mesenteric), and other individual tissue were evaluated with wasting used as the classification variable. The ROC analysis was performed using MedCalc for Windows, version 9.3.0. g Exact binomial confidence intervals (95%) were calculated for sensitivity and specificity at specific cutoff concentrations of PCV-2 DNA for individual samples using Stata v9.0. f
Frequency of gross lesions in wasting (WST), age-matched healthy (HLTH), and unaffected (UNFCT) groups.
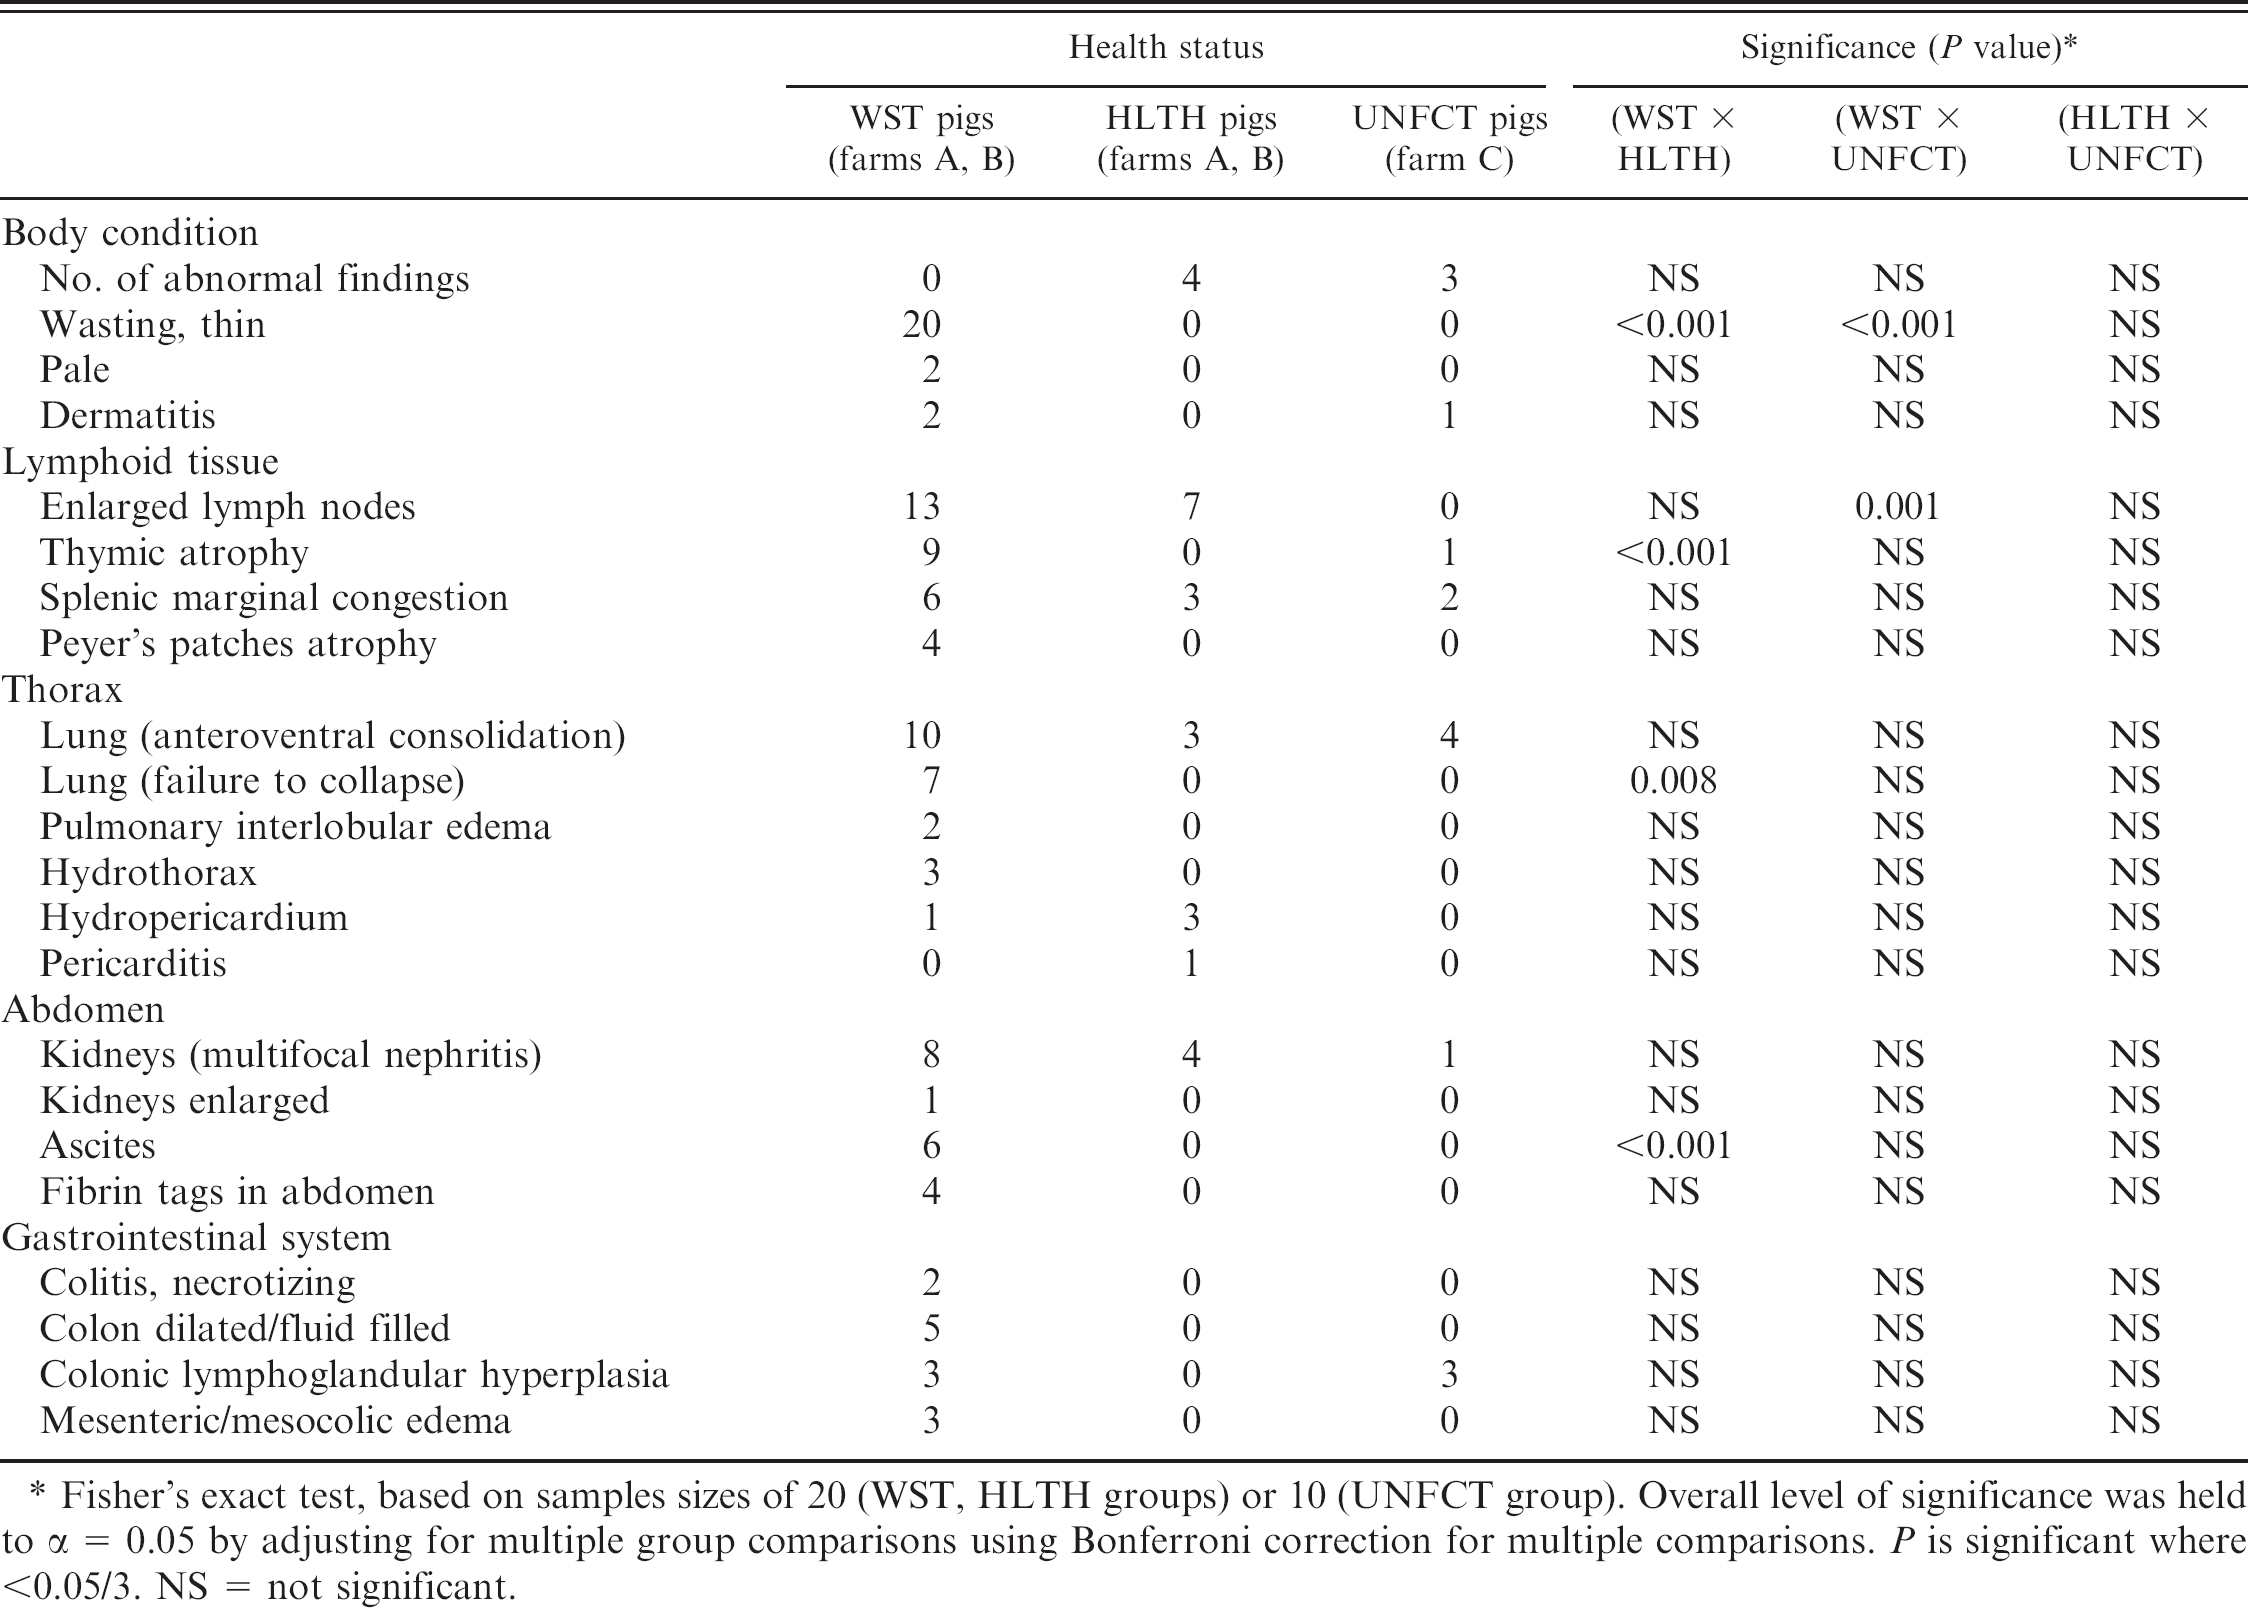
Fisher's exact test, based on samples sizes of 20 (WST, HLTH groups) or 10 (UNFCT group). Overall level of significance was held to α = 0.05 by adjusting for multiple group comparisons using Bonferroni correction for multiple comparisons. P is significant where <0.05/3. NS = not significant.
Results
Assessment of PCV-2 genotypes
The genotype of PCV-2 detected in the lymph nodes of 2 WST pigs from farm A and 4 WST pigs from farm B was PCV-2b. In none was there evidence of PCV-2a. By contrast, concurrent PCV-2a and b infections were identified in the lymph nodes of 2 UNFCT pigs from farm C.
Assessment of gross and microscopic lesions
Compared with HLTH pigs, WST pigs demonstrated a higher frequency of thymic atrophy, failure of normal pulmonary collapse, and ascites (P < 0.017 for all; Table 1). Compared with UNFCT pigs, WST pigs demonstrated a higher frequency of lymph node enlargement (P = 0.001; Table 1). Other observed differences were not statistically significant (Table 1). Lesions in WST and some HLTH pigs were consistent with PCVD and the nonblinded gross and histologic examination of tissues did not suggest the involvement of any other infectious concurrent diseases, although a number of other lesions were identified (Table 1). Mild bronchiolar epithelial hyperplasia compatible with resolving swine influenza was seen in 1 nursery and 2 grower pigs from the WST group from farm A, which had a prior clinical history of SIV H3N2 (data not shown). Immunohistochemistry for type A influenza was negative. In addition, a heavy infestation of Isospora suis was noted in 1 WST nursery pig from farm B. There were no statistically significant differences in the PCVD microscopic lesion severity between HLTH and UNFCT pigs. However, HLTH and UNFCT pigs had statistically significant higher median scores for lymphoid germinal center formation (LN_gc), and T-cell proliferation in the paracortical T-dependent zones (Tprl), compared with WST pigs (P < 0.017 for both). Similarly, the median scores of systemic lymphoid depletion (LN_Tdepl, Thy_Tdepl), reticuloendothelial infiltration/proliferation (LN_re), and interstitial pneumonia were greater in WST pigs compared with pigs in both other groups (P < 0.017 for all; Table 2). There were no significant group differences in the severity of microscopic lesions in kidney, liver, heart, or skeletal muscle.
Median scores of selected histologic lesions and Porcine circovirus-2 (PCV-2) nucleocapsid staining intensity, by health status based on subjective scoring (0–3).*
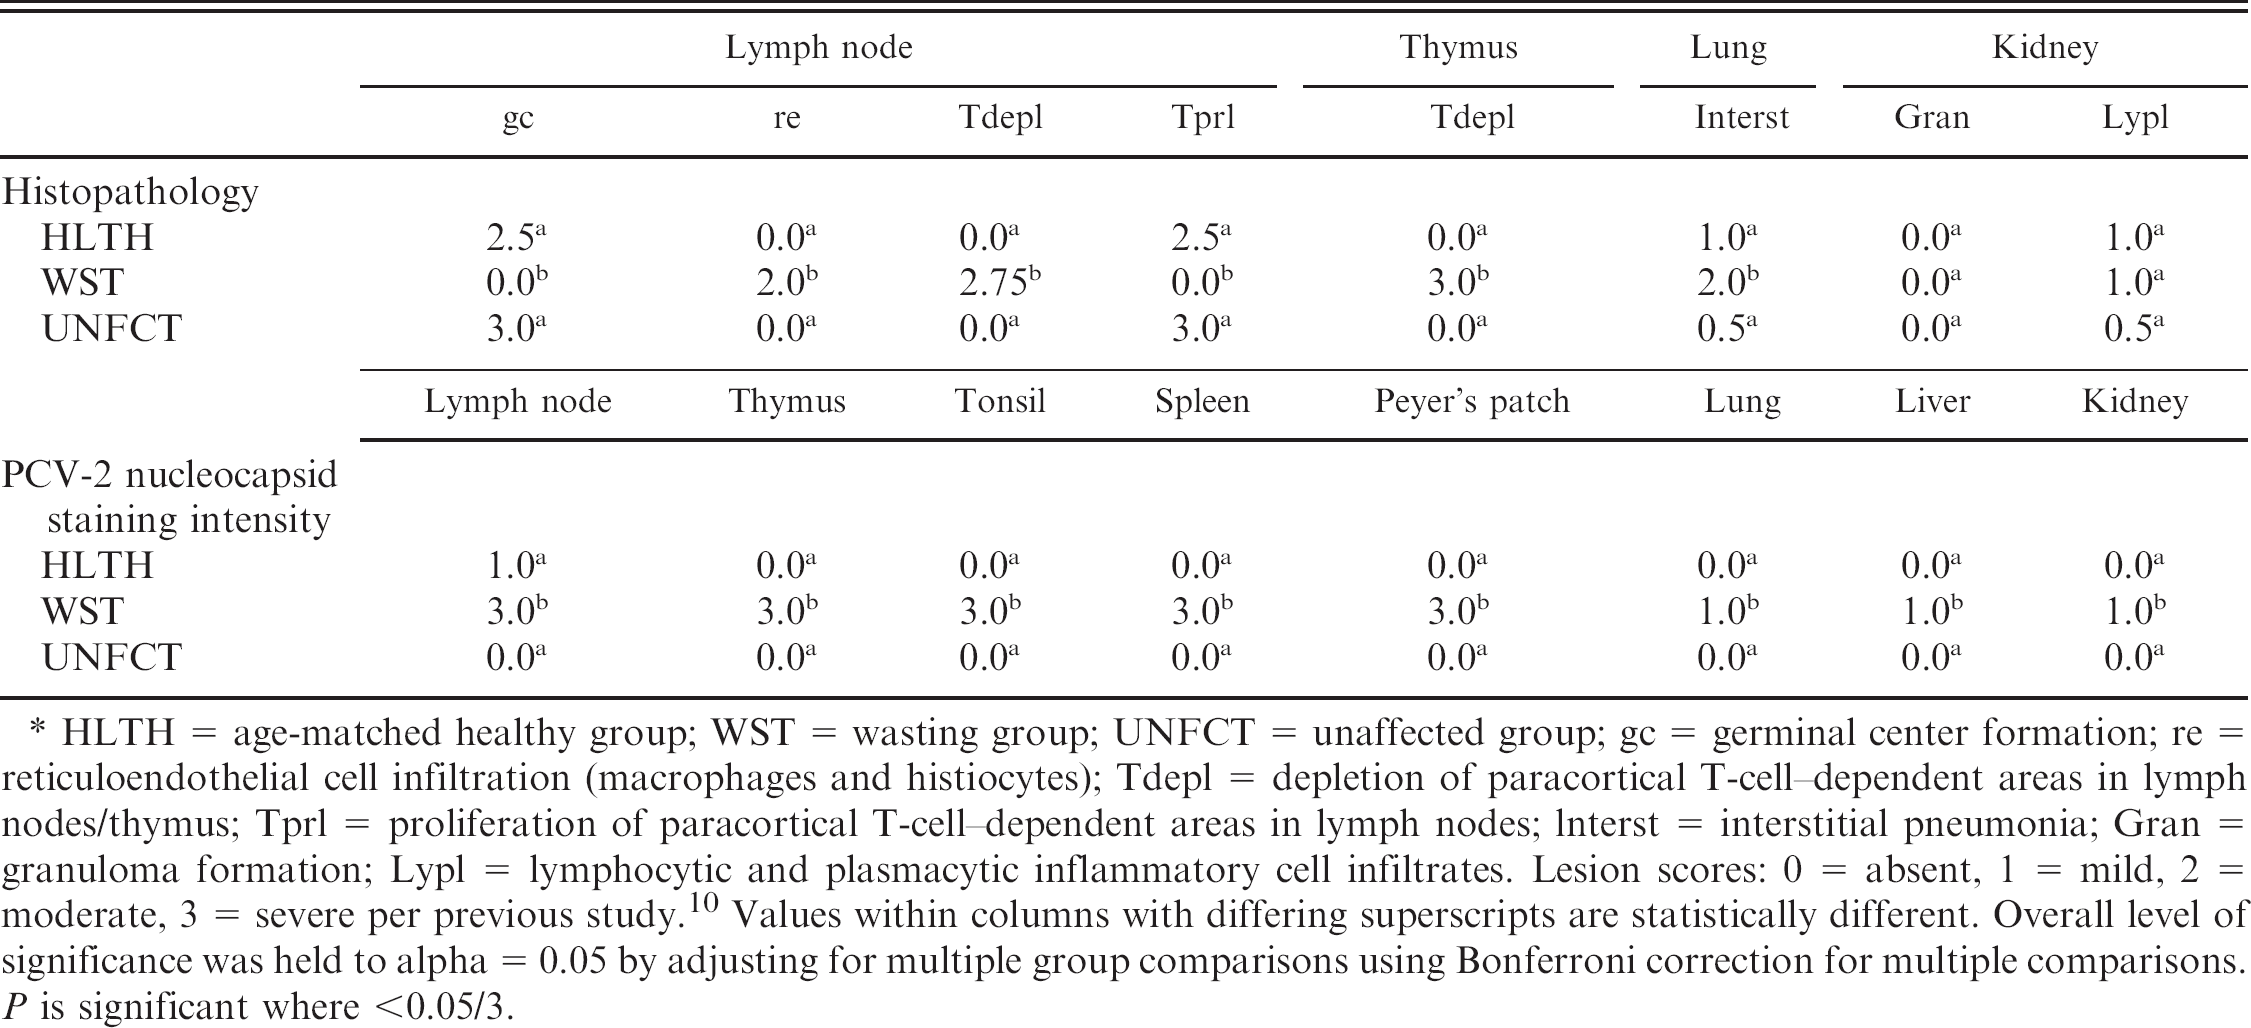
HLTH = age-matched healthy group; WST = wasting group; UNFCT = unaffected group; gc = germinal center formation; re = reticuloendothelial cell infiltration (macrophages and histiocytes); Tdepl = depletion of paracortical T-cell–dependent areas in lymph nodes/thymus; Tprl = proliferation of paracortical T-cell–dependent areas in lymph nodes; lnterst = interstitial pneumonia; Gran = granuloma formation; Lypl = lymphocytic and plasmacytic inflammatory cell infiltrates. Lesion scores: 0 = absent, 1 = mild, 2 = moderate, 3 = severe per previous study. 10 Values within columns with differing superscripts are statistically different. Overall level of significance was held to alpha = 0.05 by adjusting for multiple group comparisons using Bonferroni correction for multiple comparisons. P is significant where <0.05/3.
Assessment of viral load
Across all lymphoid and nonlymphoid tissues and sera, concentrations of PCV-2 DNA were significantly higher in WST compared with HLTH and UNFCT pigs (P < 0.017 for all; Fig. 1). Moreover, PCV-2 DNA concentrations detected by qPCR were significantly higher in the kidney, liver, heart, and pooled lymph nodes (mesenteric, bronchial, inguinal) of HLTH compared with UNFCT pigs (P < 0.017 for all; Fig. 1). The PCV-2 nucleocapsid staining intensity was significantly greater in all tissues of WST compared with both HLTH and UNFCT pigs (P < 0.017 for all; Table 2). No statistically significant differences were noted in PCV-2 staining intensity between the HLTH and UNFCT groups.
Correlation of PCV-2 DNA concentration to lesion severity and nucleocapsid staining intensity
The qPCR results for each tissue were compared with the microscopic lesion severity scores (Fig. 2) and PCV-2 nucleocapsid staining scores (Fig. 3) for the same tissue. There was a strong negative correlation between PCV-2 DNA concentrations in lymph nodes and both germinal center formation (LN_gc; r = −0.67, P = 0.0) and proliferation of paracortical T-cell–dependent zones (LN_Tprl; r = −0.61, P = 0.0). By contrast, there was a strong positive correlation between PCV-2 DNA concentrations and the severity of lymphoid depletion (LN_Tdepl) of the paracortical T-cell–dependent zones (r = 0.68, P = 0.0), as well as reticuloendothelial cell infiltration (LN_re) in lymph nodes (r = 0.60, P = 0.0), and T-depl in thymus (r = 0.54, P = 0.0002). The PCV-2 DNA concentrations were moderately correlated with histologic lesion severity in kidney (r = 0.34, P = 0.02 for Kdn_gran; r = 0.43, P = 0.003 for Kdn_lypl), lung (r = 0.38, P = 0.09 for Lng_inter), and liver (r = 0.32, P = 0.03 for Lvr_nec). Because of the general absence of microscopic lesions in gluteal muscle and myocardium, correlations with PCV-2 DNA concentrations were not performed. The PCV-2 DNA concentrations were very strongly correlated with PCV-2 nucleocapsid staining scores in lymph node, spleen, Peyer's patches, and lung (0.75 ≤ r ≤ 0.84; P = 0.0 for all; Fig. 3), and were strongly correlated in liver and kidney (0.60 ≤ r ≤ 0.69; P = 0.0 for all; Fig. 3).
Assessment of cutoff PCV-2 DNA concentrations
In the comparison of all tissues, and with “wasting” as a classification variable, the ROC analysis of the qPCR from lung tissue yielded the lowest area under the curve (AUC) and was lower than that for gluteal muscle, which yielded the highest AUC (P = 0.03; Table 3). Thus, under the conditions of this experiment, the optimized PCV-2 DNA cutoff concentration for lung yielded a low combined sensitivity and specificity, indicating that it may be the least desirable tissue to submit for diagnostic qPCR. Estimated 95% confidence intervals for the AUC for all tissues show considerable overlap indicating that observed differences in the estimate of AUC for each tissue were not different. Although not statistically different from other tissues, excluding lung, the AUC for gluteal muscle was 1.0 indicating that, at the optimum PCV-2 DNA cutoff concentration, the estimated sensitivity and specificity were 100%. For all tissues and sera, sensitivity and specificity were estimated over a range of cutoff values that contained the optimal concentration. For lymphoid and nonlymphoid tissues, high sensitivities and specificities were estimated at qPCR log10 cutoff concentrations of 7.0, 7.5, and 8.0. For sera, high sensitivities and specificities were estimated at qPCR log10 cutoff concentrations of 4.0, 4.5, and 5.0.
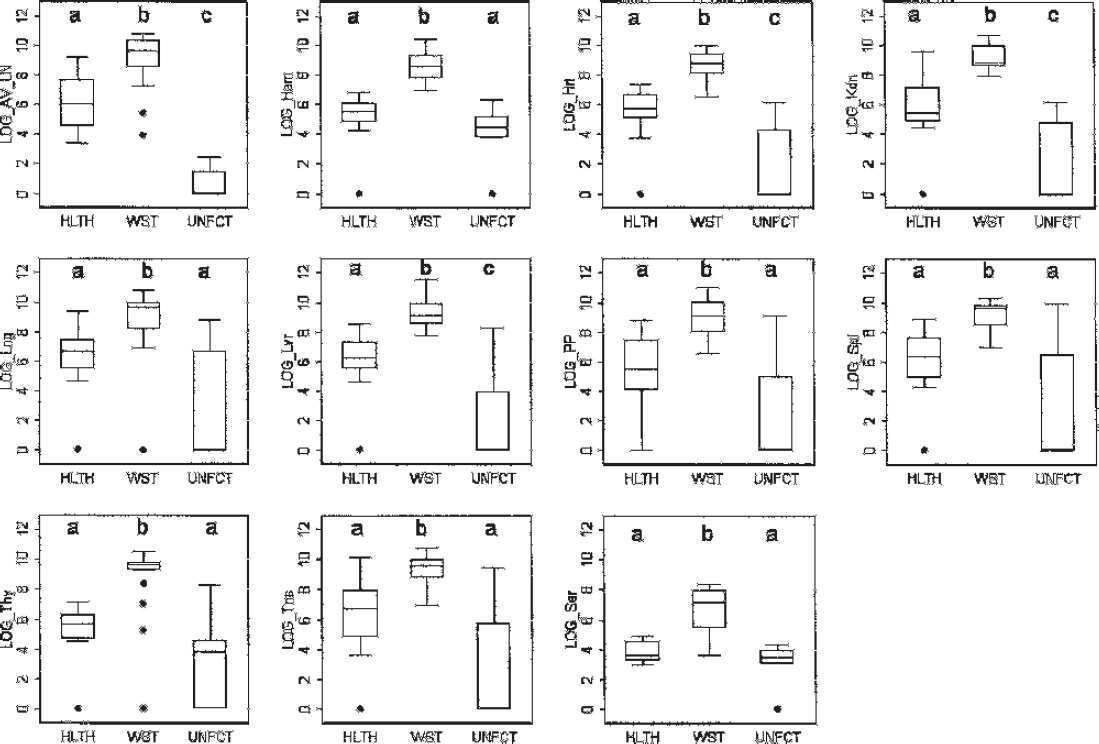
Box and whisker plots of Porcine circovirus-2 (PCV-2)-load in tissues and sera estimated by quantitative polymerase chain reaction (qPCR) of wasting (WST), healthy (HLTH), and unaffected (UNFCT) pigs. Boxes represent the middle 50%; whiskers represent the upper and lower 25% percentile; solid dots represent outlier values; horizontal lines represent the median value. Y-axis: viral load (log10 DNA concentration copies per gram [tissues] or per milliliter [sera]). AV_LN = equal pool of bronchial, mesenteric, and inguinal lymph node; Ham = gluteal muscle; Hrt = heart; Kdn = kidney; Lng = lung; Lvr = liver; PP = Peyer's patches; Spl = spleen; Thy = thymus; Tns = tonsil; Ser = serum. Within a plot, boxes with different superscripts are statistically different. Overall level of significance was held to α = 0.05 by adjusting for multiple group comparisons using Bonferroni correction for multiple comparisons. P is significant where <.05/3.
Discussion
The primary objectives of this experiment were to measure the PCV-2 load in WST and HLTH pigs of PCVD-affected and unaffected farms and to correlate tissue PCV-2 DNA concentrations with the severity of microscopic lesions and the amount and distribution of PCV-2 nucleocapsid protein. All 3 farms participating in this experiment were intensive swine operations representative of farrow-to-finish farms in Canada. The 2 affected farms were suffering excessive postweaning mortality, typical of many North American farms affected by severe PCVD since 2004, whereas in the unaffected farm the postweaning mortality was typical of high health status Canadian farms before 2004 when PCVD was less common.
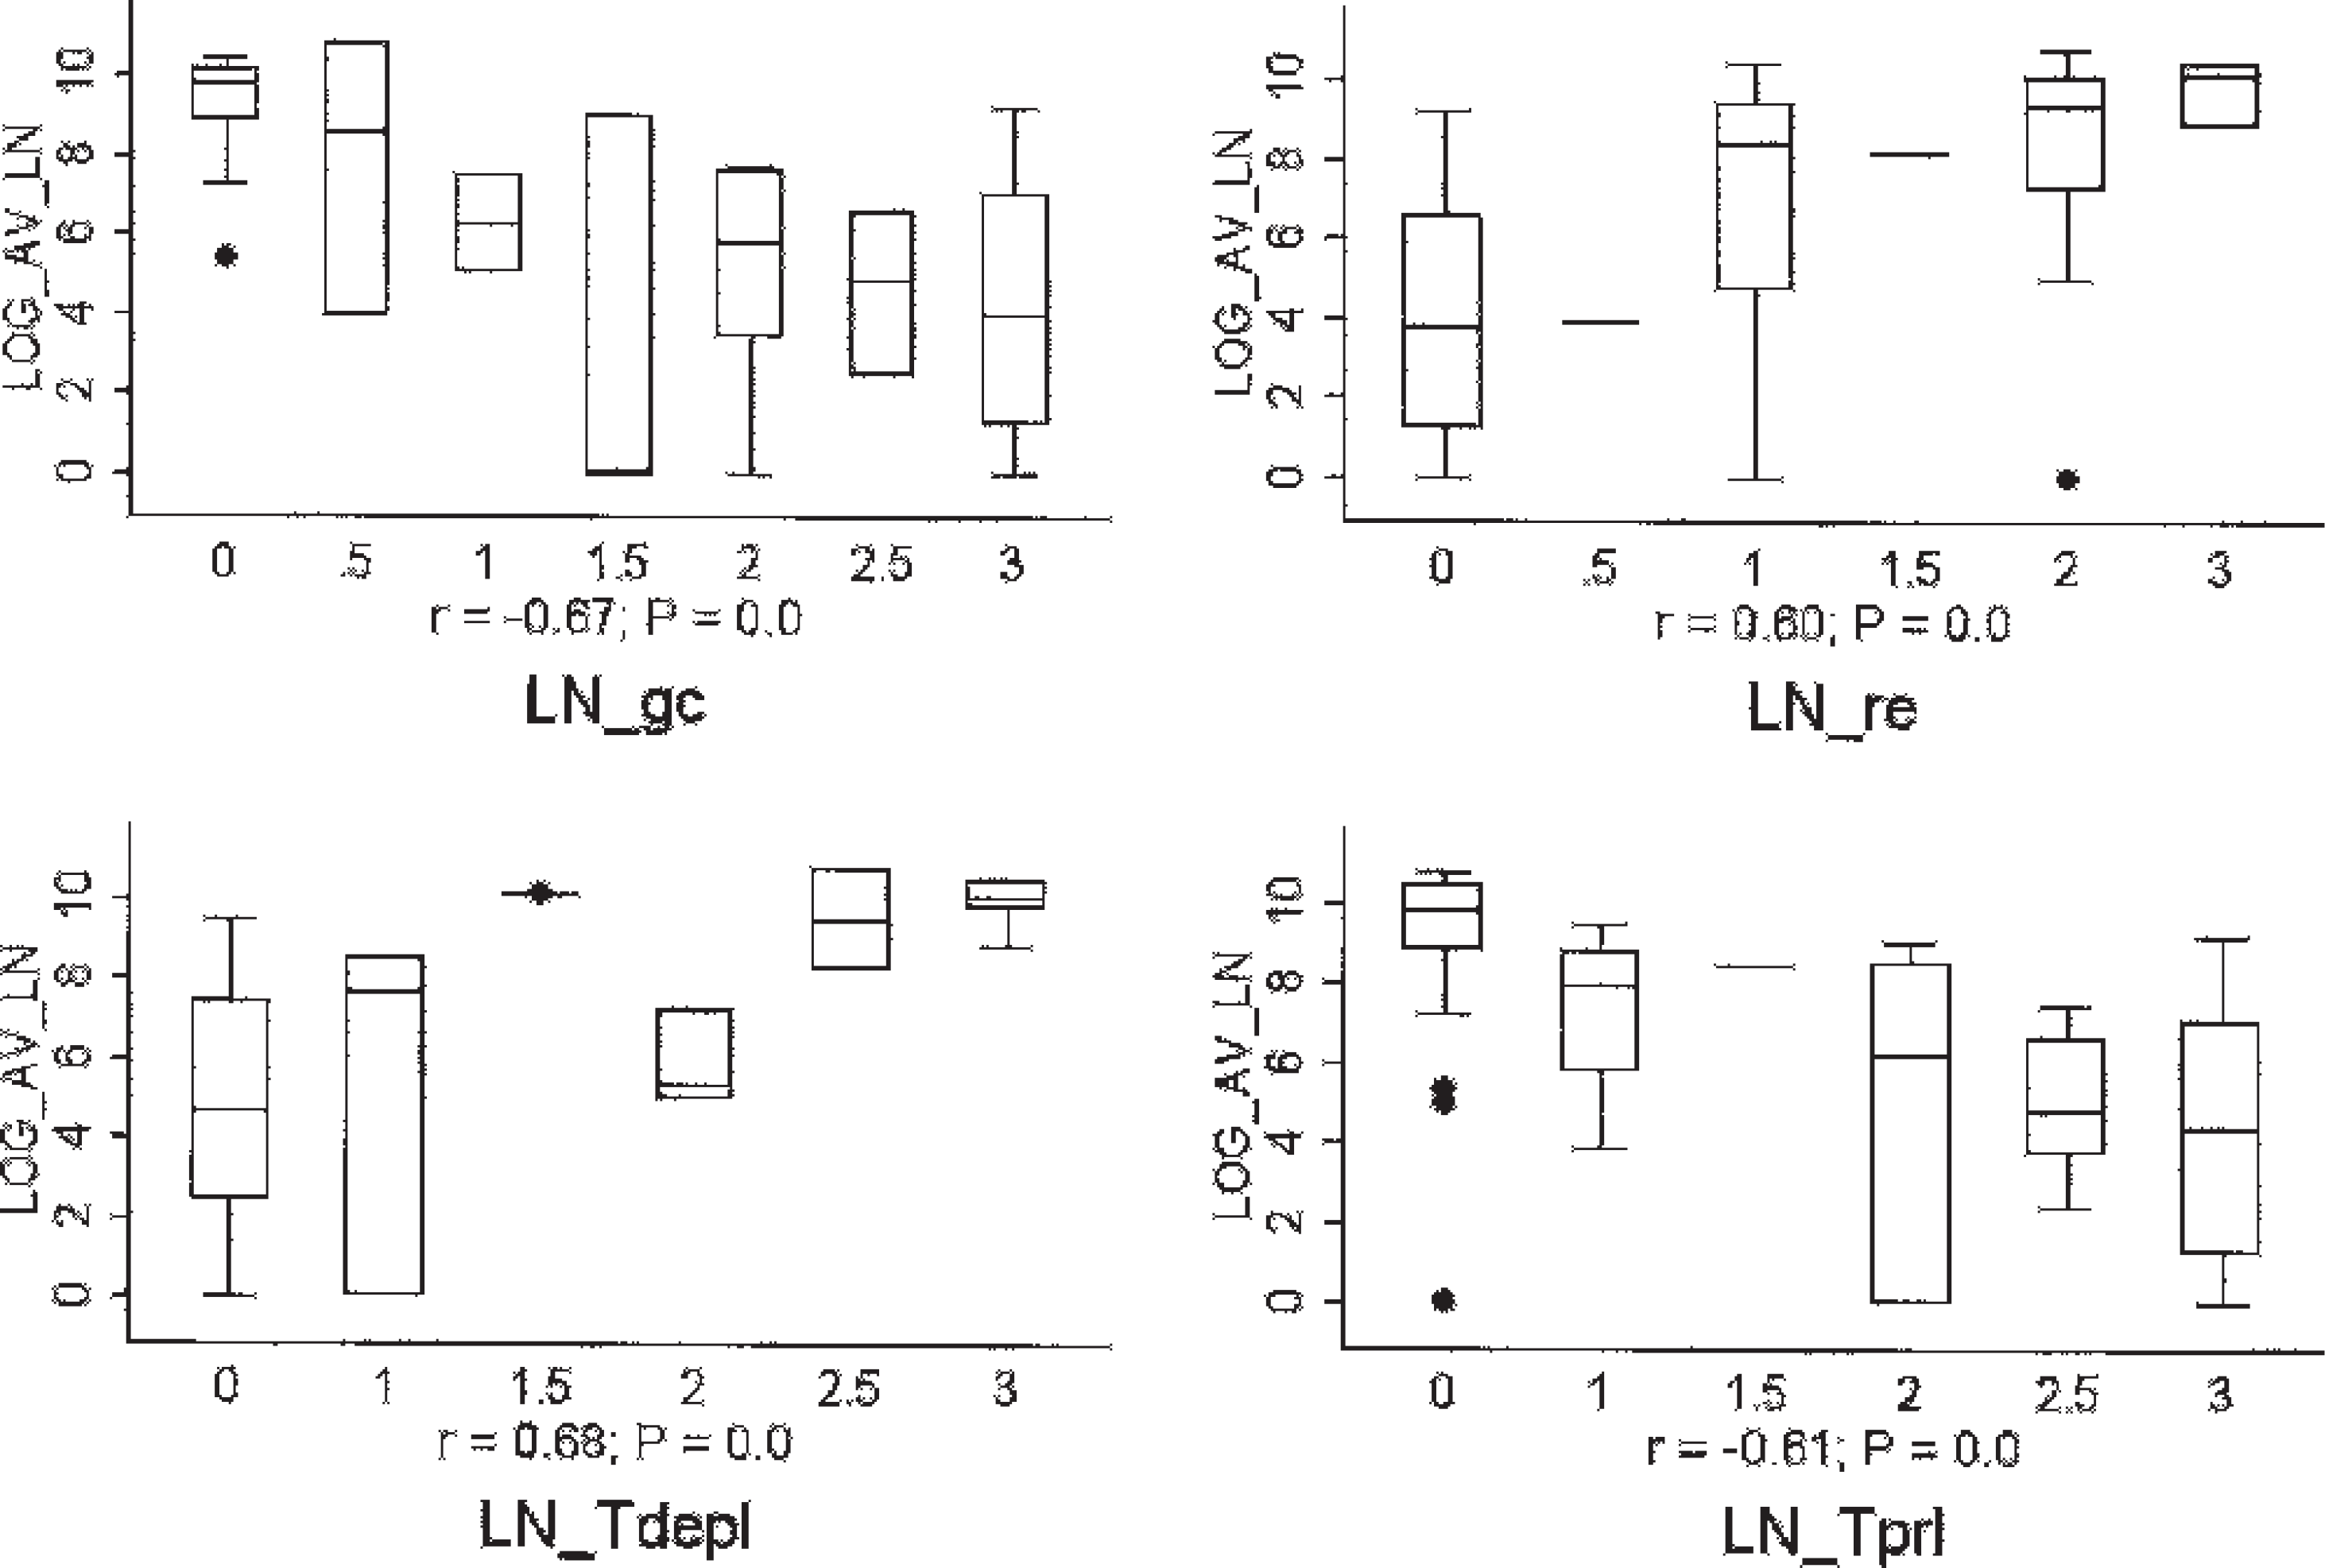
Box and whisker plots demonstrating the correlation between tissue Porcine circovirus-2 (PCV-2) DNA concentrations and the severity of histologic lesions within lymph nodes. Y-axis: viral load (log10 DNA concentration copies per gram); X-axis: histologic score (0–3) for tissue lesion or attribute. LN = lymph node; gc = germinal center formation; re = reticuloendothelial cell infiltration (macrophages and histiocytes); Tdepl = depletion of paracortical T-cell–dependent areas in lymph nodes; Tprl = proliferation of paracortical T-cell–dependent areas in lymph nodes. Lesion scores: 0 = normal, 1 = mild, 2 = moderate, 3 = severe.
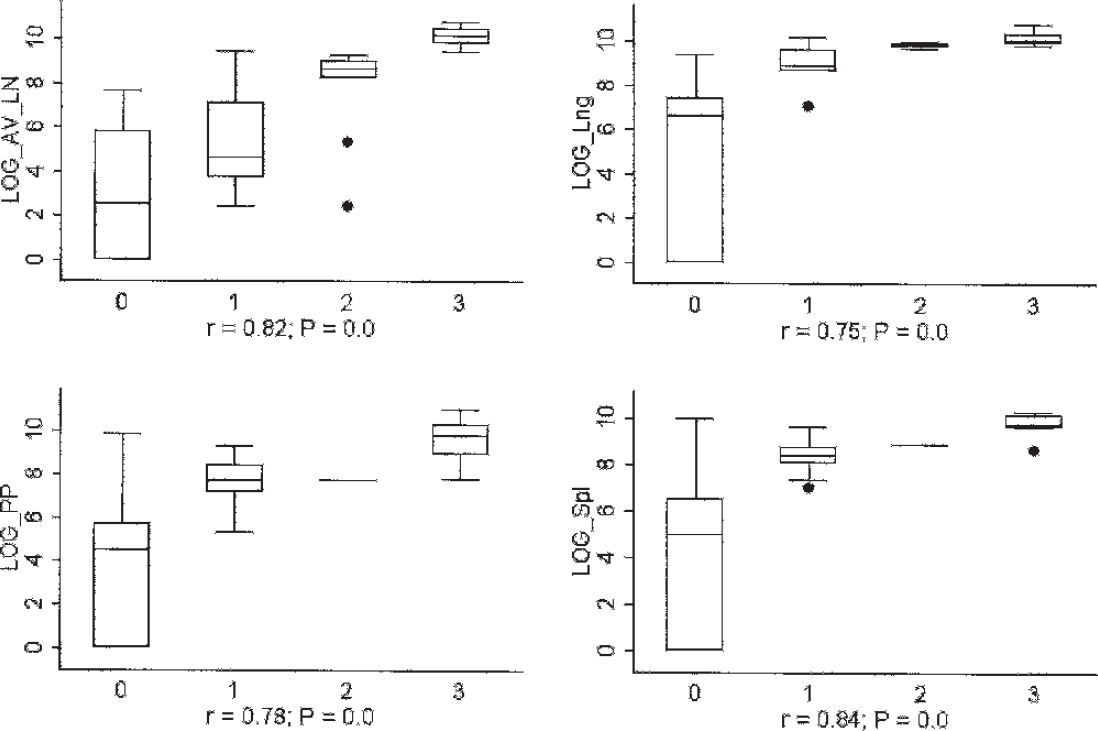
Box and whisker plots demonstrating the correlation between tissue Porcine circovirus-2 (PCV-2) DNA concentrations and the intensity of PCV-2 immunoperoxidase staining in lymphoid and nonlymphoid tissues. Y-axis: viral load (log10 DNA concentration copies per gram [tissues]); X-axis: PCV-2 (immunohistochemistry) staining intensity score (0–3) in the tissue characterized. LN = lymph node; Spl = spleen, PP = Peyer's patches, Lng = lung. Staining intensity scores: 0 = absent, 1 = mild, 2 = moderate, 3 = severe.
Optimal Porcine circovirus-2 (PCV-2) DNA cutoff concentrations to maximize sensitivity and specificity of quantitative polymerase chain reaction on tissues and sera.
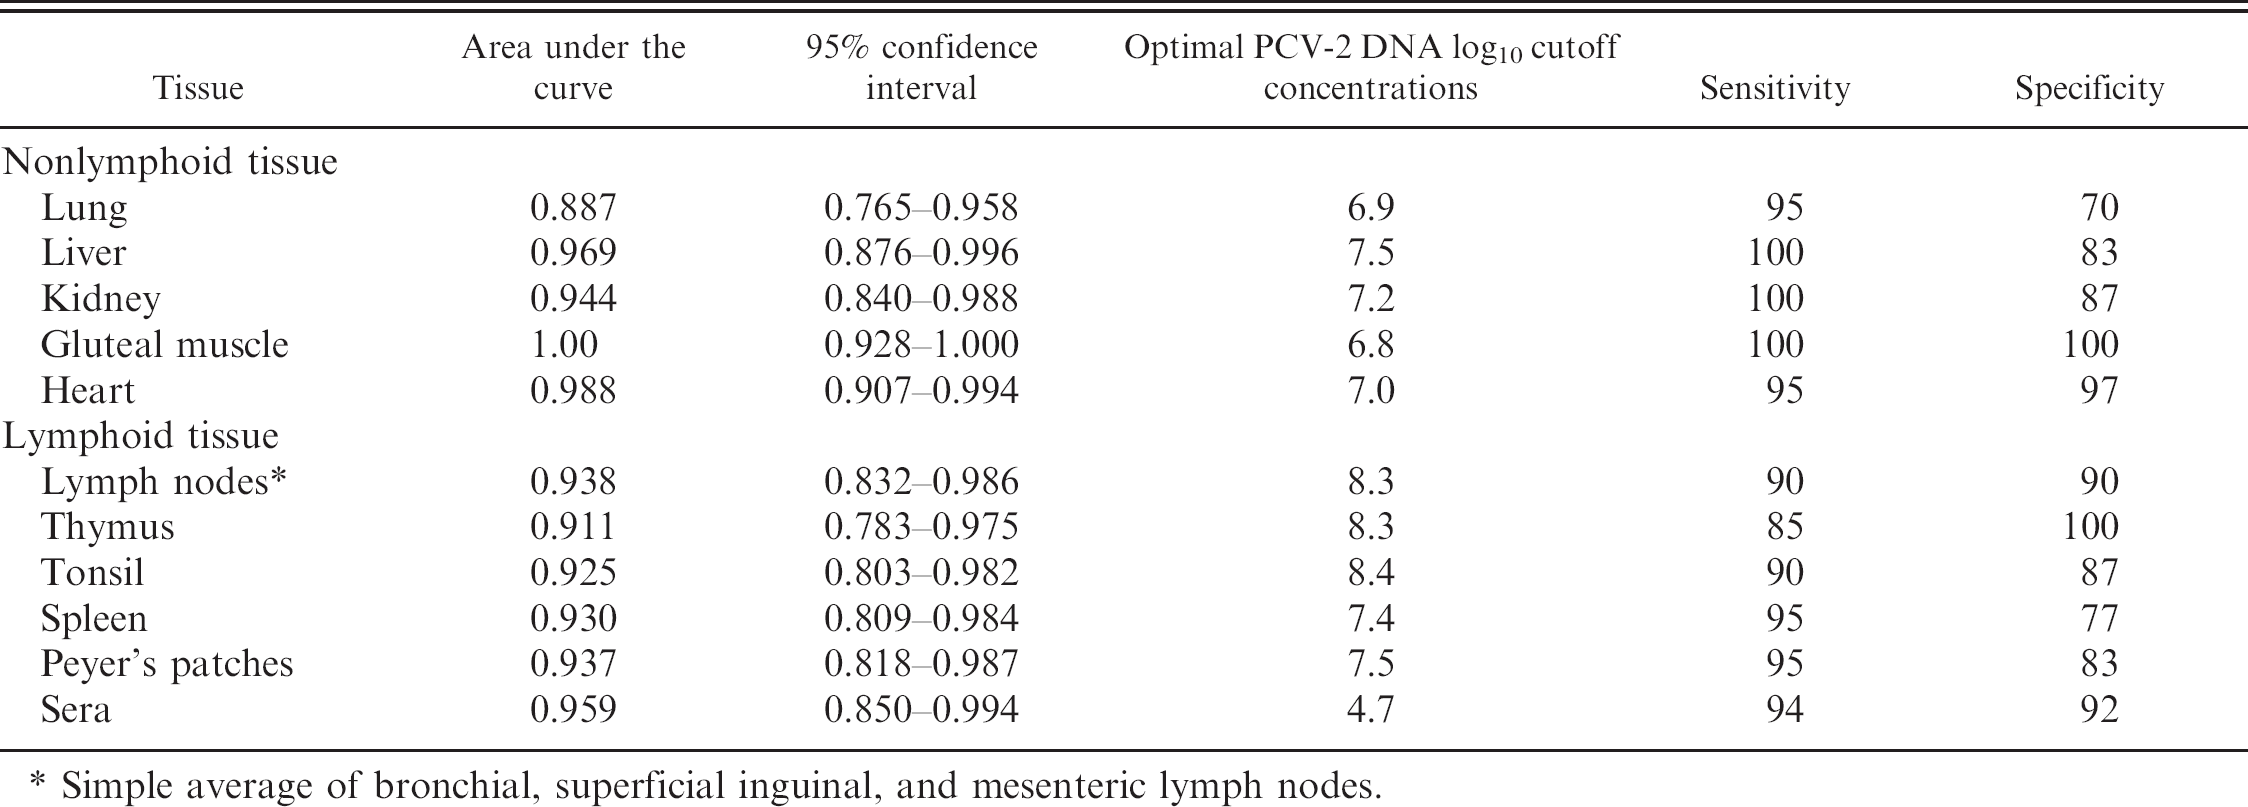
Simple average of bronchial, superficial inguinal, and mesenteric lymph nodes.
An additional objective of the current experiment was to determine the initial estimates of sensitivity and specificity of a recently validated SYBR green quantitative PCV-2 PCR assay, to assess if PCV-2 DNA concentrations measured in lymphoid and nonlymphoid tissues and in sera could distinguish between wasting and nonwasting pigs. The ROC analysis was undertaken to determine the optimum PCV-2 DNA cutoff concentrations where high sensitivity and specificity were yielded simultaneously. Clearly observable clinical signs (wasting, nonwasting) were used to determine sensitivity and specificity. The methods in the current study are potentially biased however, because nonwasting pigs were removed from the population when sampled. Thus, it is possible that at least some of those animals might have developed clinical signs had they not been removed. Nevertheless, the optimal PCV-2 DNA log10 cutoff concentration that distinguishes wasting and nonwasting pigs was lower for sera (4.7 per mL sera) than for lymphoid and nonlymphoid tissues (range = 6.8–8.4, depending on the tissue). Although this experiment provides initial estimates of diagnostic sensitivity and specificity, additional studies with samples obtained from more farms and pigs would be beneficial. In the interim, these results are currently relevant for diagnosticians because to the authors' knowledge, no other equivalent sensitivity and specificity data are available for PCV-2 qPCR.
The gene sequencing of PCV-2 was undertaken to provide relevance to the experiment vis-à-vis the current North American PCVD epidemic, and the widespread speculation that PCV-2b is of higher virulence, but otherwise it was not a key objective of this experiment. Nevertheless, some of the ORF2 sequencing results obtained were unexpected. More specifically, the presence of PCV-2b in a PCVD-unaffected pig from an unaffected farm provides valuable evidence that the presence of PCV-2b is not always associated with severe PCVD. The authors acknowledge that the sequencing results from a single pig or farm does not provide any information on the strength of association, and that the experiment would have been strengthened by sequencing the PCV-2 obtained from multiple tissues and from each of the experimental pigs. However, these results do provide valuable data contradicting the commonly held belief that the present North American epidemic may be caused by PCV-2b.
The results of this experiment are consistent with other studies in that high PCV-2 viral load was associated with severe PCV-2. 3,5,12,14,20 Moreover, this experiment also revealed that PCV-2 DNA concentrations were lowest in the farm with no history of PCVD. In most commercial farms, PCV-2 seroconversion and viremia occur in pigs sometime after 6 weeks of age, corresponding with the waning of maternal antibody. 13,15 In this experiment, the animals were selected in the nursery and grower stages of production, during which time PCV-2 was expected to be actively circulating, and corresponding with the onset of clinical disease in pigs in farms A and B. A number of reports however, have demonstrated that early seroconversion is a potential risk factor associated with the development of PCVD. 14,19 Thus, in unaffected farms such as farm C, seroconversion and viremia would be expected to occur later and in older pigs compared with PCVD-affected farms. It is therefore possible that the later circulation of PCV-2, if it occurred in farm C, may have contributed to the lower PCV-2 load compared to farms A and B.
The results of the present experiment indicate that healthy swine from farms with PCVD do contain elevated PCV-2 concentrations compared with those on unaffected farms. Moreover, PCV-2 DNA concentrations were strongly correlated with immunoperoxidase staining scores in both lymphoid and nonlymphoid tissues, and variable but generally lower PCV-2 DNA concentrations were detected by qPCR in tissues scoring IHC = 0 (i.e., normal). The presence of low PCV-2 DNA concentrations in tissues where immunoperoxidase staining was absent has been described by others. 3,12,20 This finding may reflect the presence of unencapsidated DNA in tissue or the requirement for higher concentrations of nucleocapsid protein in tissues for positive IHC staining. Regardless, tissue PCV-2 DNA log10 concentrations below 7.0 are less likely to be associated with gross or histopathologic lesions compared with levels above 7.0. Furthermore, the presence of pronounced germinal centers and paracortical T-cell–dependent zones in lymph nodes was strongly associated with low PCV-2 load, and therefore their presence is suggestive of the absence of PCVD in commercially raised pigs.
The present experiment is novel and has a number of strengths, not the least of which is that it is the first North American field study following the reemergence of PCVD measuring PCV-2 load across multiple tissues in naturally infected pigs. Unlike previous reports, 3,5 a larger number of pigs (n = 50) was analyzed, and the same 7 lymphoid and 5 nonlymphoid tissues and serum from each pig were examined, allowing for more rigorous between-tissue comparisons. In addition, PCV-2 lesions, nucleocapsid staining intensity, and DNA concentration were assessed in a blinded manner, and the experiment also included a nonblinded gross and histopathologic assessment to screen for the presence of concurrent diseases. To the authors' knowledge, this is the first published article reporting correlation coefficients that describe the strength of association between PCV-2 DNA concentration and PCVD-lesion severity and PCV-2 staining intensity in multiple tissues, and it is also the first to provide initial estimates of the sensitivity and specificity of a PCV-2 qPCR assay.
The current study could have potentially been strengthened by performing routine IHC and PCR for other swine pathogens on all carcasses. Such testing, to determine the potential involvement of coinfections as opposed to disease, was not routinely performed, because identification of concurrent infections was not a primary objective of the experiment. By contrast, a detailed gross and histopathologic examination was undertaken in all carcasses, and IHC and bacterial culture were undertaken as appropriate on tissues with gross or histopathologic lesions indicative of an infectious disease process. With the exception of coccidiosis and swine influenza, no gross or histopathologic lesions suggestive of other diseases, such as PRRS or mycoplasmal pneumonia, were noted in the experimental pigs; otherwise, appropriate ancillary tests would have been requested. At the time of writing and to the best of our knowledge, the health status of the experimental farms has remained unchanged based on clinical and diagnostic necropsy evaluations, and for farm B on the basis of surveillance serology.
PCV-2 monitoring systems for live pig populations need to be developed to better measure the effectiveness of control programs, such as vaccination or implementation of specific anti-PCVD management strategies. At present, serology may be used for monitoring the rate and age of first exposure, but it is not useful for monitoring viral load or clinical outcome. By contrast, if the measurement of viral load is a predictive PCVD assessment in live populations, PCV-2 qPCR would provide producers and clinicians with a laboratory-based tool to evaluate the efficacy of PCVD control programs.
Acknowledgements
The authors graciously acknowledge Big Sky Farms Inc. and Prairie Swine Centre Inc. for providing farm access, transport vehicles, and animals used in this experiment. In addition, the authors thank Drs. Yanyun Huang, Zenon Forster, Lorraine Forster, Leigh Rosengren, and Wendy Wilkins, and the staff of Prairie Diagnostic Services necropsy laboratory for their assistance with necropsy examinations. Funding for this experiment was provided by the National Pork Board (project #06–077).
Footnotes
a.
QIAquick PCR Purification Kit, Mississauga, Ontario, Canada.
b.
PCV-2 nucleocapsid monoclonal antibody provided by G. Allan, Virology Department, Veterinary Sciences Division, DANI, Stormont, Belfast/Faculty of Agriculture and Food Sciences, The Queens University of Belfast, Northern Ireland.
c.
Primary antibody provided by the National Institute of Allergy and Infectious Disease, Bethesda, MD.
d.
Mx3005P, Stratagene, La Jolla, CA.
e.
Qiagen DNeasy Blood & Tissue Kit, Mississauga, Ontario, Canada.
f.
StataCorp LP, College Station, TX.
g.
MedCalc Software, Mariakerke, Belgium.