
Abstract
The prevalence of obesity is increasing in dogs as well as in humans. C-reactive protein (CRP) is an important tool for the detection of inflammation and/or early tissue damage and is linked to obesity in humans. The objective of the present study was to determine if serum CRP levels are altered in obese dogs. Fifteen lean (control group) and 16 overweight (obese group) dogs were examined. Blood samples were collected under fasted conditions for serum determination of CRP, glucose, insulin, cholesterol, triglyceride, and fructosamine. Results indicated that obese dogs were insulin resistant because serum insulin and insulin/glucose ratios were higher than in lean dogs (P ≤ 0.05). Serum CRP concentrations were lower in obese dogs than in controls (P ≤ 0.001). C-reactive protein was negatively correlated with insulin/glucose ratio (R = −0.42) and cholesterol (R = −0.39; P ≤ 0.05). Furthermore, levels of cholesterol, triglycerides, and fructosamine were increased in the obese group compared with the control group. Based on these results, it can be postulated that CRP production is inhibited by obesity and insulin resistance in dogs.
Within the last 50 years, the prevalence of obesity has been progressively increasing in companion animals, 33 and with it there has been an increase in associated metabolic diseases, including diabetes mellitus. 8,10,12,13,15,30,31 Human obesity is considered to be an inflammatory condition because of increased production and release of proinflammatory mediators, 7 which are also accompanied by an increase in white blood cell (WBC) and lymphocyte counts in obese subjects. 36 This inflammatory response may be mediated in part by C-reactive protein (CRP). C-reactive protein is a positive acute phase molecule secreted by the liver in response to internal and external injury. 26 It binds to Fc membrane receptors of neutrophils and mononuclear cells and stimulates the release of proinflammatory cytokines. 4 Interestingly, serum CRP levels are increased in obese humans, 7,25,28,37 and insulin reduces CRP levels in humans. 6 However, the role of CRP in canine obesity remains to be studied. Carbohydrate metabolism differs between dogs and humans 33 ; therefore, results in humans may not be applicable to dogs. The objective of this experiment was to determine serum CRP levels in obese and overweight dogs and to determine the effect of insulin resistance on these parameters in obese dogs.
Thirty-one owner-presented dogs of different breeds were used in this experiment. Before being accepted into the study, the general health of the animals was assessed by hemogram, platelet count, urinalysis, alanine transaminase (ALT), alkaline phosphatase (ALP) isoenzyme test, blood urea nitrogen (BUN) test, and creatinine tests. Blood (5 ml) was collected into vacuum collection tubes a with ethylene-diamine tetra-acetic acid (EDTA) as anticoagulant for hemogram and platelet count. Whole blood count was made on a semiautomatic cell counter, b and the white cell differential count was performed using optical microscopy.
Mean, maximum, and minimum values of morphometric and clinical variables from control and obese dogs.*
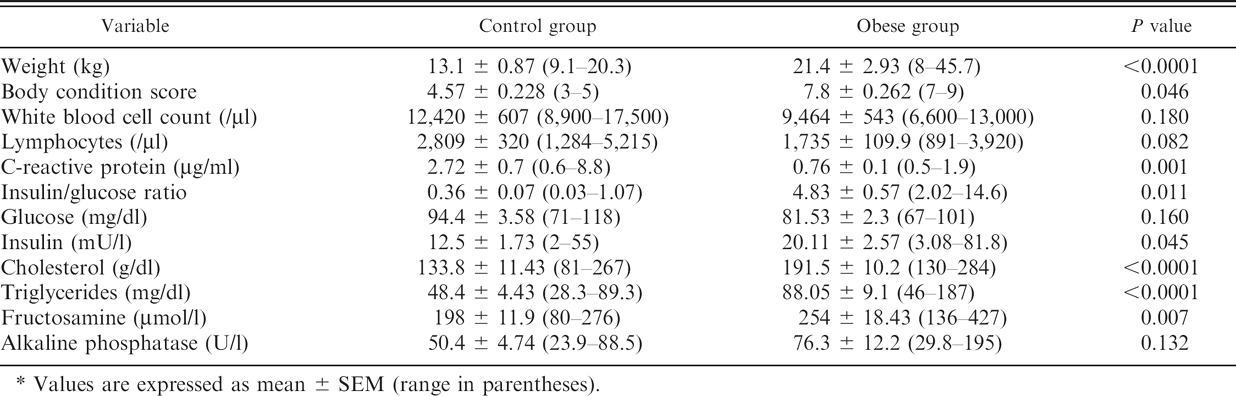
Values are expressed as mean ± SEM (range in parentheses).
Biochemical assays were performed using semiautomatic spectrophotometer c with commercial kits. d The animals were weighed, and their 9-point body condition score (BCS) was verified. 20,23 Fifteen dogs had scores of 3 to 5 and were considered to be lean (control group), and 16 dogs had scores of 7 to 9 and were considered obese. Twelve- to 16–hr fasting blood collection was performed for serum determination of glucose (glucose-oxidase), e insulin (radioimmunoassay [RIA]), f CRP (enzyme-linked immunosorbent assay [ELISA]), g triglycerides (glycerophosphate-oxidase), cholesterol (cholesterol-oxidase), and fructosamine (nitroblue tetrazolium [NBT]). c,d Insulin and CRP assays were performed with commercial kits according to the manufacturers' instructions. Insulin/glucose ratio was calculated as a measurement of insulin sensitivity. 9,17,35 The study was approved by the Federal University of Rio Grande do Sul Veterinary Hospital Animal Care Committee and performed under the principles set down by the Brazilian College of Animal Experimentation.
Statistical analysis was performed using Statistical Analysis Software (SAS). h The Mann-Whitney U-test was applied to nonparametric data to determine differences among groups, with a significance level of P ≤ 0.05. Correlations were determined with Pearson's correlation test. Data were presented as mean ± SEM, maximum and minimum values. Table 1 shows the morphometric and clinical variables for control and obese dogs. As for morphometric characteristics (weight and BCS), obese dogs showed higher values than controls. Obese dogs had lower serum CRP concentrations and higher levels of insulin, insulin/glucose ratios, cholesterol, triglycerides, and fructosamine concentrations compared with lean dogs.
Mean values of insulin and insulin/glucose ratios were significantly higher in obese than in control dogs. This ratio is considered to be a good indicator of insulin resistance and also gives information regarding relative insulinemia. 1,9,17 The limit value for the insulin/glucose ratio considered was 0.235. 17 Thus, 56.3% of the obese animals had high concentrations of insulin, and all had high values of insulin/glucose ratio. 10 The high concentrations of triglycerides 30 in 62.5% of obese dogs indicate dyslipidemia (vs. controls). Although no change in cholesterol level was detected when considering reference range, except for 1 animal, the obese group showed higher levels than the control group (P ≤ 0.0001), which can indicate a trend to a long-term increase. Fructosamine reflects the state of glycemia over the previous 2 to 3 weeks 3,5,32 ; therefore, the increased fructosamine levels in obese dogs suggests that they had more episodes of higher concentrations of glucose than controls throughout such a period. The reference range considered for this metabolite was determined by the authors' laboratory 30 ; this range can be lower than the reference range reported in other studies 5,21,32 and related to regional differences found in Southern Brazil compared with other countries.
Metabolic syndrome is reached with the development of at least 3 of the following characteristics: hypertension, hyperlipidemia, fat accumulation, and insulin resistance. 2,14,16,18 Although the obese dogs in the present study were not yet diabetic or hyperglycemic and their blood pressure was not determined, their fat accumulation, hypertriglyceridemia (in 62.5% of obese animals), hyper-insulinemia (in 56.3% of obese animals), and increased insulin/glucose ratio make them strong candidates for metabolic syndrome (Fig. 1).
The concentrations of CRP in control dogs, which ranged from 0.6 to 8.8 μg/ml, are in general agreement with many studies 11,19,27,29 but disagree with others 24 that reported lower ranges for this protein in healthy dogs. Figure 2 shows the variability chart for CRP and triglycerides in both groups, where the points, range bars (which include maximum, median, and minimum quantiles), and cell means can be observed. Two animals of the control group showed higher levels of CRP, and this was probably responsible for the high maximum values in this group compared with previous studies. 24 These high values could be elevated as a response to inflammation. To exclude this possibility in the control dogs, the authors accessed the WBC count and found that the control dogs fell within the reference range (8,900–17,500 cells per μl) for this parameter (Table 1). The control group included 1 animal whose WBC fell within the superior limit of the reference range (17,500 cells per μl), but interestingly its serum CRP concentration (1.9 mg/μl) was not the highest. Two other animals who showed the highest levels of CRP in the control group (7.7 and 8.8 mg/μl, respectively) did not show the highest WBC counts (9,600 and 10,700 cells per μl, respectively). Because CRP is considered more sensitive than WBC count in the assessment of inflammation, this possibility was reasonably excluded with the absence of clinical signs of inflammation and/or infection. Additionally, serum CRP levels were lower in obese dogs, and there was a negative correlation (R = −0.42; P ≤ 0.01) between the insulin/glucose ratio and CRP. These data are in contrast with those from humans, who show increased serum CRP levels with the onset of obesity. 28,37 The decision to use insulin concentrations and insulin/glucose ratio for the assessment of insulin sensitivity was based on previous reports in dogs. 9,17 Other techniques have been used in the evaluation of the response to oral or venous administration of glucose 1,2,16,21,34 ; however, these are more expensive, time consuming, and invasive approaches, although more sensitive, than the use of basal insulin levels and the calculation of insulin/glucose ratio. Furthermore, no changes have been found in the rates of insulin-stimulated glucose uptake in dogs affected by metabolic syndrome in previous studies. 16
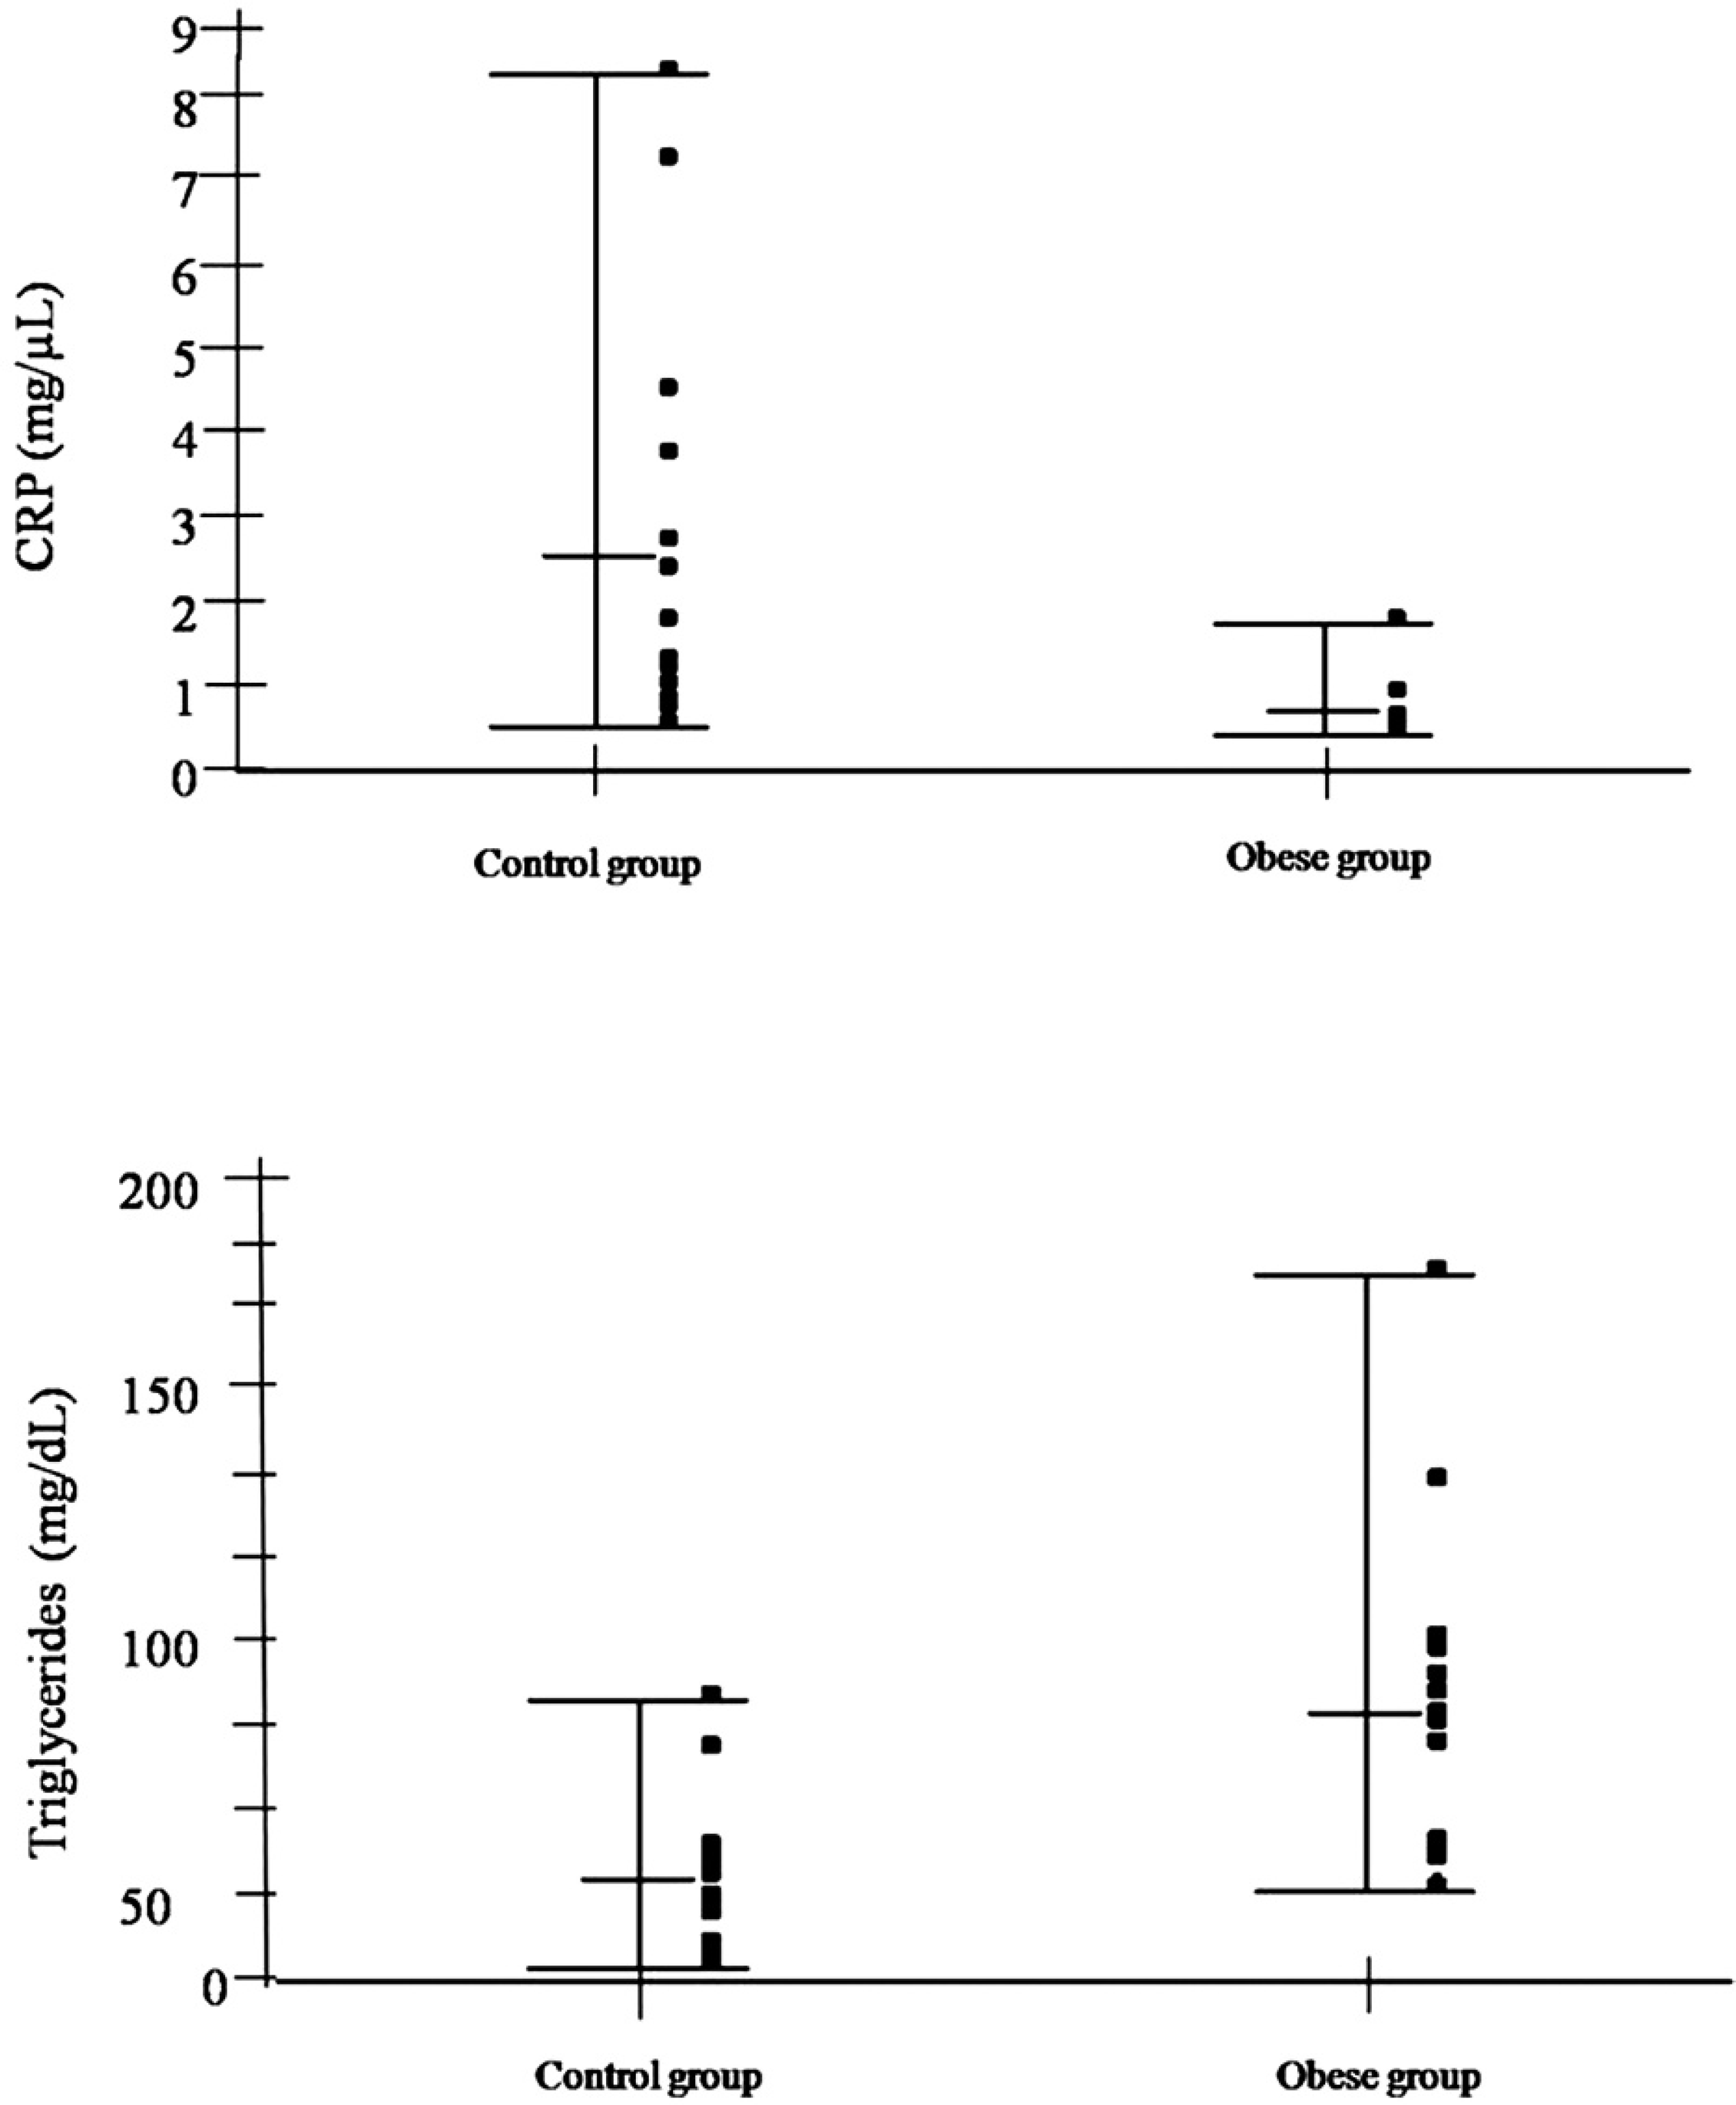
Variability chart for triglycerides and C-reactive protein in control and obese dogs. Horizontal bars show ranges (maximum, median, and minimum quantiles).
The effect of triglycerides on CRP concentrations has been demonstrated in recent studies. 22 Because 62.5% of the obese dogs showed hypertriglyceridemia (Fig. 2), this would be expected to lower circulating CRP levels, as observed in the present study. Because the dogs in the present experiment were not all hyperinsulinemic, it is likely that metabolic disease was not as advanced as that observed in studies in humans with insulin resistance. This is also supported by a study in which plasma CRP levels were elevated in obese women who were insulin resistant but not in those who were insulin sensitive. 25 As for CRP concentrations, the difference between studies may be related to the level of insulin resistance.
To the authors' knowledge, this is the first report of serum levels of CRP in obese dogs. The results are contrary to observations in human subjects, which suggest a metabolic difference between the species. It is clear that species-specific data are necessary for the correct interpretation of clinical indicators of obesity/diabetes in companion animals. The mechanism by which CRP levels are decreased in obese dogs remains to be determined.
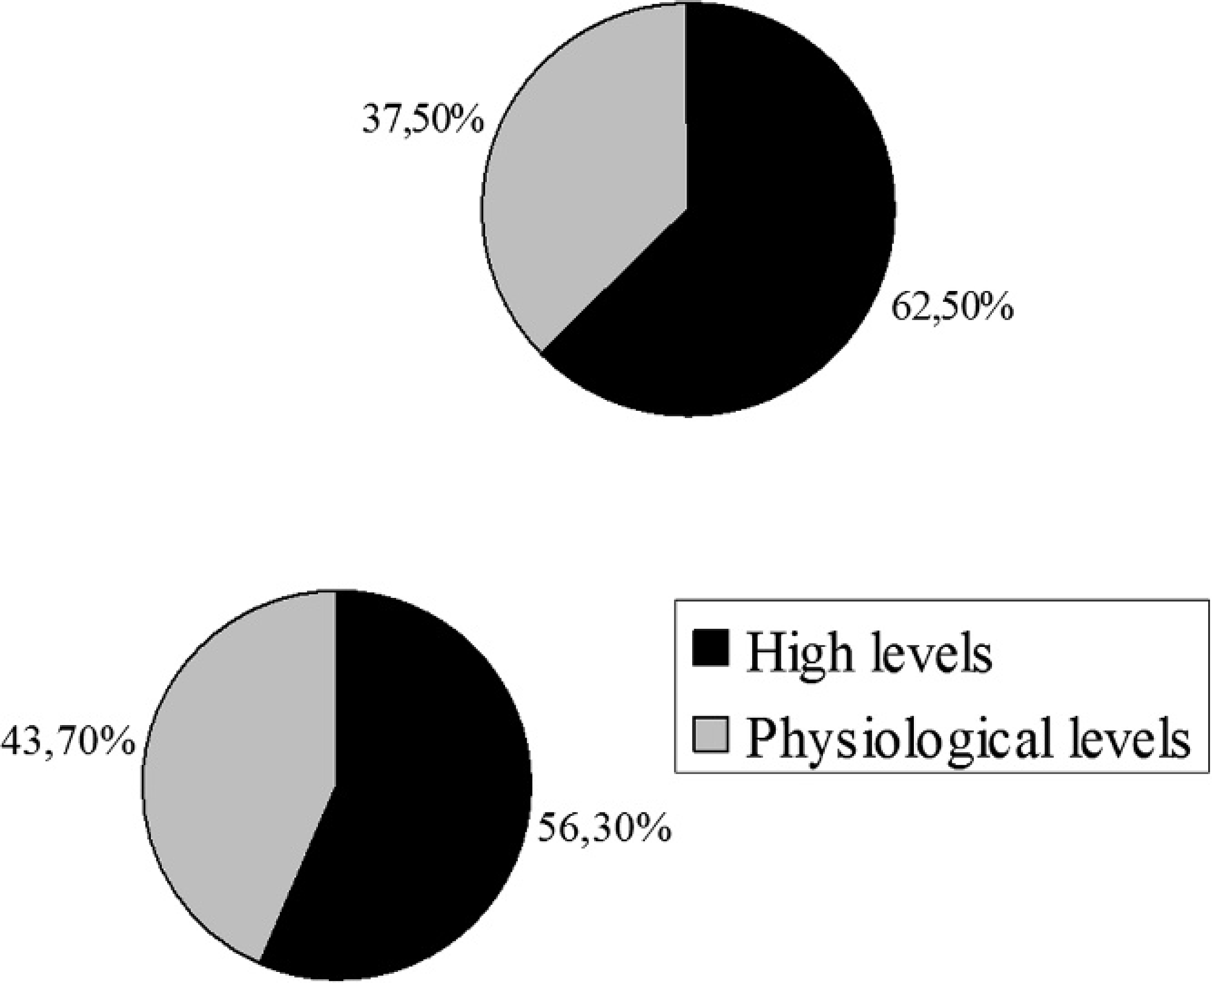
Percentage of obese animals with high and physiological levels of triglycerides (top) and insulin (bottom).
Acknowledgements. This research was supported by Conselho Nacional de Pesquisa e Desenvolvimento (CNPq)-Brazil and the Waltham Foundation. The authors thank Helica Biosystems for the donation of kits for canine measurements of C-reactive protein.
Footnotes
a.
Hemogard K3, Labnew Indústria e Comércio LTDA, São Paulo, SP, Brazil.
b.
CELM 500-Cia, Equipadora de Laboratórios Modernos, São Paulo, SP, Brazil.
c.
Metrolab 1600 Plus, Vis-Metrolab S.A., Buenos Aires. Argentina.
d.
Labtest Diagnostic S.A., Lagoa Santa, Minas Gerais, Brazil.
e.
Accu-Check Active Blood Glucose Meter, Roche Diagnostics. São Paulo, SP, Brazil.
f.
Linco Research, Billerica, MA.
g.
Helica Biosystems, Inc., Fullerton, CA.
h.
Statistics Software v2, version 6.08, Cary, NC