
Abstract
The performance of flow cytometry (FC) was compared with immunofluorescence microscopy (IM) for detection of Giardia duodenalis in bovine feces. Samples from 36 adult dairy cows and 208 dairy calves were collected. Flow cytometry test characteristics were calculated using continuous, ordinal, and dichotomized results. Spearman correlation coefficients comparing the results of the 2 tests were 0.47 and 0.68 for cows and calves, respectively. Using IM as indicative of presence or absence of G. duodenalis cysts in each sample, likelihood ratios of FC results with 0, 1, and ≥2 gated events indicated that samples with 1 gated event were likely to be positive in the cows but not in the calves. Immunofluorescence microscopy detected G. duodenalis in 69.7% and 48.1% of cows and calves, respectively. When dichotomizing the FC results at a cutoff point of 1 or 2 gated events, 46.3% and 19.9% of the cow and 51.9% and 35.1% of the calf samples, respectively, were classified as G. duodenalis-positive. Relative to IM, the sensitivity in the cows was 0.59 and 0.28, respectively, and 0.76 and 0.64, respectively, in the calves. At a cut-off point of 1, 65.7% and 73.1% of the cow and calf samples, respectively, were correctly classified in FC, and at a cut-off point of 2, 49.3% and 78.4% were correctly classified in the cows and calves, respectively. Flow cytometry was less sensitive than IM. Possible reasons and research needed to improve FC for G. duodenalis detection are discussed.
Introduction
Accurate diagnosis of Giardia duodenalis in animals is important to obtain precise prevalence estimations. Fecal flotation and differential gradient centrifugation techniques are routinely applied for concentrating G. duodenalis cysts from feces, followed by conventional or immunofluorescence microscopy (IM). 3,6,9,12,17,21,24 While IM has made identification of G. duodenalis easier through monoclonal antibody staining of cysts, microscopic methods, especially for a large number of samples, are tedious and often result in viewer fatigue. 6 In addition, well-trained experts are necessary to diagnose cysts correctly on a microscopic slide, limiting the use of these methods to experienced laboratories. Flow cytometry (FC) has been reported to be a rapid and sensitive method for screening large numbers of fecal samples for the presence of protozoan cysts and oocysts. 5,6 While FC may not be considered confirmatory in itself, samples found to be positive or equivocal by FC can be readily examined and confirmed by IM. In addition, cell sorting of FC-positive samples can be used to further concentrate the cysts prior to microscopy.
Automated FC allows for a large number of fecal samples to be analyzed in a shorter time and provides more consistent results. Although the sample preparation time for FC is as long as or longer than the preparation for IM, the actual time to analyze a single sample is much shorter. Flow cytometry has been successfully applied in the diagnosis of pathogens such as Giardia, Cyclospora, and Cryptosporidium shed in human and animal feces. 2,4–6,14,18,23 Thus, FC could be an effective alternative method for the detection of G. duodenalis cysts, especially for large-scale epidemiological studies or extensive surveillance programs. If FC would produce results that are comparable to IM, it would have the beneficial attribute of speed and would not depend on an experienced microscope viewer. The goal of this study was, therefore, to compare FC as a diagnostic test with IM for the detection of G. duodenalis in bovine fecal samples.
Materials and methods
Sample population and fecal sample collection
Fecal samples were collected from 36 cows m(>3 years of age) from the Atlantic Veterinary College (AVC) teaching herd, which consisted of healthy, nonlactating Holstein Friesian cows and 1 Jersey cow. Multiple fecal samples were collected from these cows at regular intervals over a period of 4 months for a total of 201 fecal samples. Additional fecal samples were obtained from 208 calves (<6 months of age, 75% weaned, 25% preweaned) from 14 dairy farms located on Prince Edward Island, Canada. Every fecal sample was collected per rectum using a new disposable latex glove and put into individual plastic containers. Fecal samples were stored at 4°C at the AVC and processed within 24 hr after collection.
Cyst isolation procedure
Giardia duodenalis cysts were isolated from fecal samples according to a previously described method. 15 The procedure was modified for adult cows to accommodate a sample size of 20 g. Briefly, 35 ml or 10 ml of phosphate buffered saline (PBS) was mixed with 20 g or 5 g of feces of adult cows or calves, respectively. The slurry was filtered through cheesecloth and layered over 15 ml (adult cows) or 5 ml (calves) of sucrose solution (specific gravity 1.13) in a clean 50-ml (adult cows) or 10-ml (calves) tube. The sample was centrifuged at 800 × g for 5 min. Following centrifugation, the interface and the upper layer of liquid were transferred using a disposable pipette to a clean 50-ml (adult cows) or 5-ml (calves) tube and centrifuged at 800 × g for 5 min. The supernatant was decanted, leaving a pellet of approximately 0.5 ml.
Immunofluorescence microscopy
Pellet (0.02 ml) was spotted onto 1 well of a 2-well fluorescence microscopy slide a and dried on a slide warmer at 37°C for approximately 10 min. A Giardia-specific fluorescein isothiocyanate (FITC)-labeled monoclonal antibody solution b (0.04 ml) was applied to the spotted sample on the slide. The slide was incubated in a humid air chamber at room temperature for 40 min. After incubation, the slide was briefly rinsed with PBS and allowed to air dry. The slides were prepared with mounting media c and sealed with a glass cover slip. Giardia duodenalis cysts were examined and enumerated under an immunofluorescence microscope, using a filter suitable for FITC detection. Positive control slides, containing formalin-fixed cysts b and prepared as described above, were used to compare and confirm G. duodenalis cysts. One slide was examined for each sample. When more than 1,000 G. duodenalis cysts were counted under the immunofluorescence microscope, which was the case for 15 calves, the result was recorded as exactly 1,000 cysts and further counting was not performed.
The minimum concentration of G. duodenalis cysts detectable by this method in cattle has been shown to be about 50 cysts per gram of feces. 22 After slide preparation, calf samples were stored at 4°C until FC analysis within 14 days. Cow samples were frozen at −20°C until FC analysis within 3 months.
Flow cytometry
Following the G. duodenalis cyst isolation procedure, 500 ml of the aliquot was centrifuged at 10,000 × g for 10 min, the supernatant was aspirated, and the pellet resuspended in 10% buffered formalin to a final volume of 1 ml. Samples were stored at 4°C in the dark until staining for FC. Two hundred microliters of each sample was diluted 1:5 with PBS, and duplicate 200-μl aliquots were placed in 5-ml round bottom tubes. d Twenty-five ml of anti-Giardia FITC 1X monoclonal antibody solution b was added to 1 tube of each sample, and 25 μl of PBS was added to the duplicate tube as an autofluorescence control. Control tubes containing known numbers of G. duodenalis cysts as well as known positive and negative fecal controls were prepared the same way. Samples were incubated at room temperature for 45 min in the dark, mixed twice during incubation, and then washed with 2 ml of PBS and centrifuged at 1,900 × g for 20 min. The supernatant was discarded and the pellet resuspended in PBS to a final volume of 500 ml. Samples were stored at 4°C until FC analysis, which took place within 24 hr of sample preparation.
Samples were vortexed before and during acquisition on the flow cytometer. A maximum of 100,000 events was analyzed for each sample and fecal control. Samples were analyzed using a commercially available software. e To define the analysis gate, a positive control b was used. Region 1 (R1) was set based on size (forward scatter) versus FITC-fluorescence intensity of G. duodenalis cysts. Region 2 (R2) was set based on complexity (side scatter) versus FITC-fluorescence intensity of G. duodenalis cysts. A double anchor gating strategy was used in which particles had to appear in both R1 and R2 to be counted as cysts. 5 Every sample's autofluorescence control was analyzed in the same manner to ensure that any fluorescent debris did not appear in the analysis gate.
Statistical analyses
Histograms of the test outcomes were created for assessment of the distribution of the results. Scatter plots of the FC versus the IM results in the cows and calves were used to visualize agreement between the 2 tests. Flow cytometry and IM results with more than 50 gated events or cysts per slide, respectively, were summarized as having exactly 50 gated events or cysts per slide. This was warranted to improve the quality of the graphs. With both test results on a continuous scale, Spearman nonparametric correlation coefficients and corresponding significance levels were calculated in the calf and cow samples. A kappa (k) statistic was calculated to assess diagnostic agreement between the tests. Kappa values >0.8 represent almost perfect agreement, values between 0.6 and 0.8 indicate substantial agreement, values between 0.4 and 0.6 indicate slight to moderate agreement, and values between 0.2 and 0.4 indicate fair agreement. 8 The IM results were classified into 2 categories: 0 G. duodenalis cysts on the slide were a negative result, and ≥1 cysts on the slide were a positive result. The FC results for both populations were classified into 3 categories: 0, 1, and ≥2 events in the gated region were considered negative, equivocal, and positive FC results for G. duodenalis, respectively. The 3 FC outcome categories were tabulated against the 2 IM result categories, and category-specific likelihood ratios for a positive (LRcat+), negative (LRcat-), and equivocal (LRcat-/+) FC result were calculated for both cows and calves. The FC results were dichotomized ≥1 and ≥2 gated events. Using the IM as indicative of the presence or absence of G. duodenalis cysts in each sample, the relative sensitivity (Se) and specificity (Sp) were determined for FC. The cut-off point-specific likelihood ratios (LRcp+, LRcp-) as well as the percentages of correctly classified cows and calves were calculated. Confidence intervals for the category-specific and the cut-off point-specific likelihood ratios were computed by a log-scale approximation equation. 7 To compare the relative Se between cows and calves at a cut-off point, a 2-sample test of proportion was applied. The proportions positive by both tests were calculated and compared with a McNemar chi-square test. For the cow samples, an attempt was made to confirm all FC-positive, IM-negative samples by IM. In addition, a proportion of the IM-positive, FC-negative samples from the cows and calves were revisited to reconfirm the positive IM result. All statistical analyses were performed using a commercially available software program. f P values ≤0.05 were considered statistically significant.
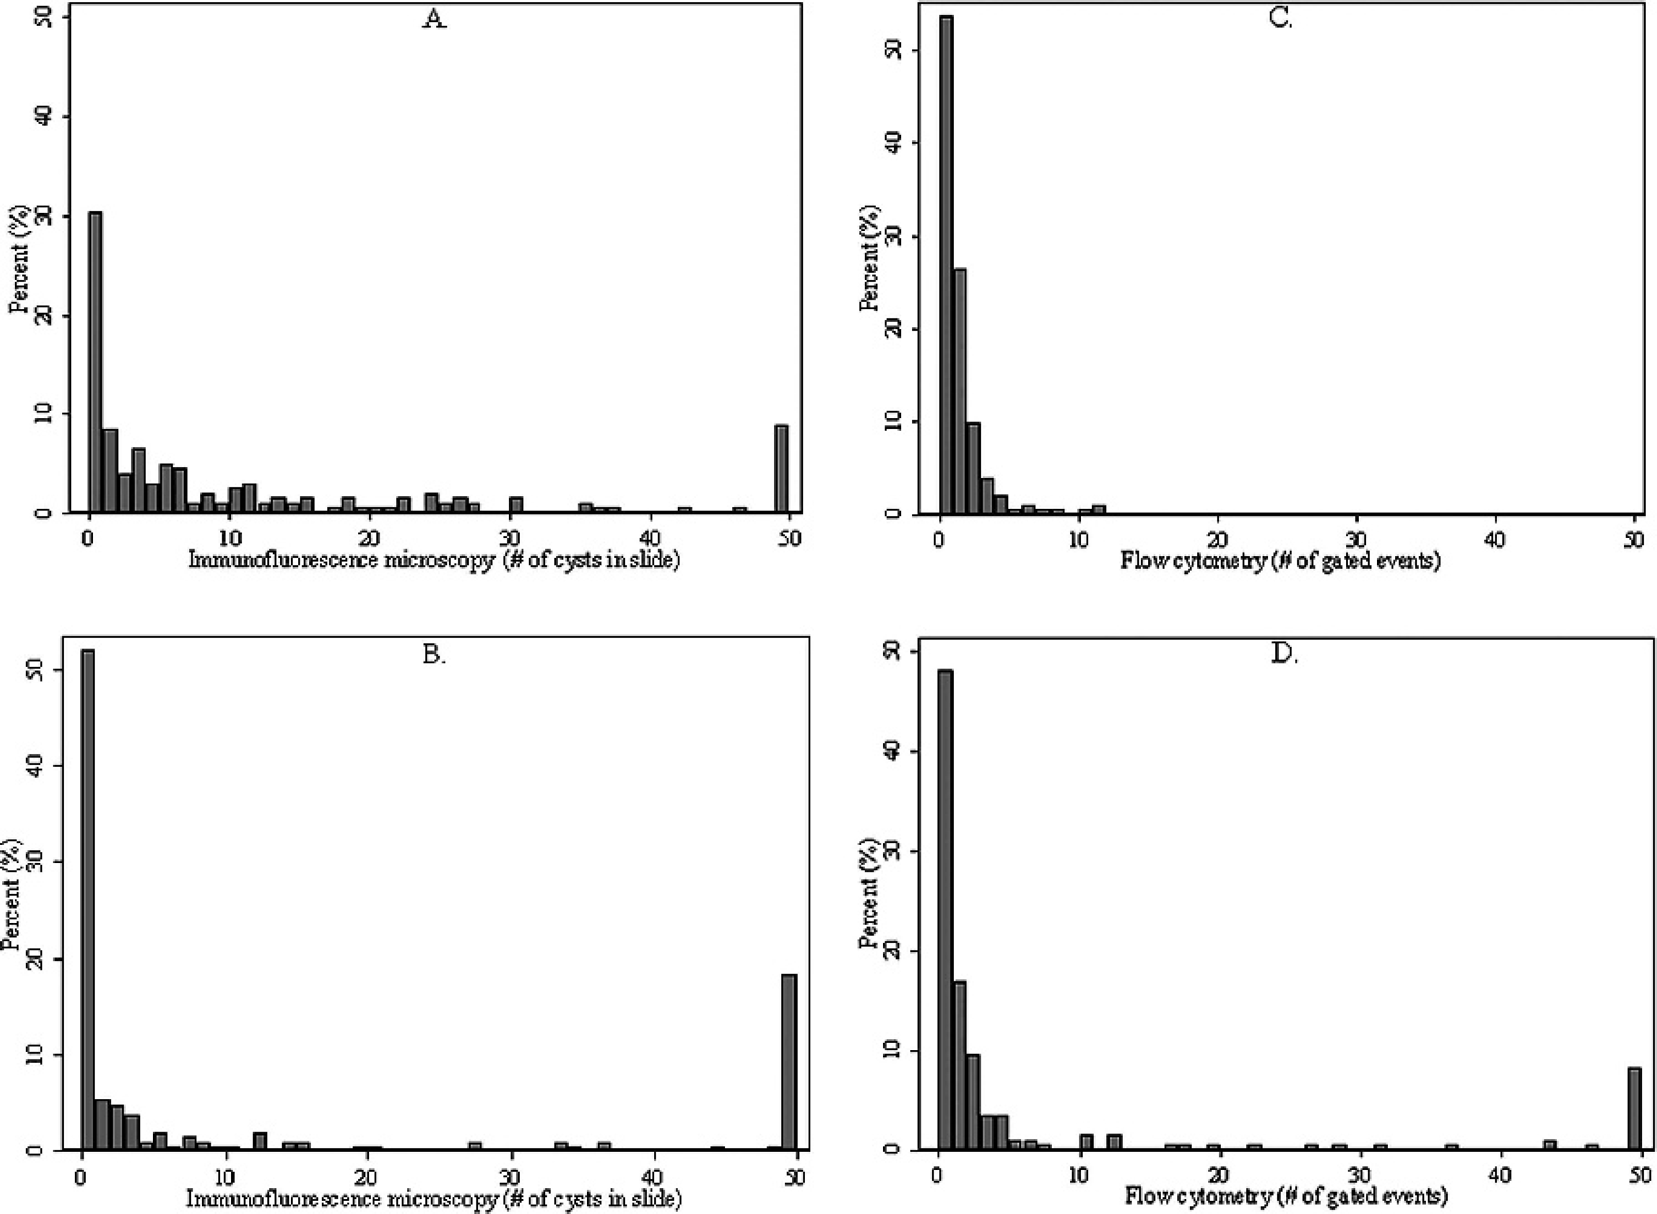
Distribution of Giardia duodenalis results by immunofluorescence microscopy (IM) and flow cytometry (FC) in 201 cows and 208 calves.
Results
Immunofluorescence microscopy detected G. duodenalis cysts in 69.7% (140/201) and 48.1% (100/208) of the cow and calf samples, respectively. In 39.3% (79/201) and 31.8% (64/201) of the cow samples, 1–10 and >10 G. duodenalis cysts could be detected by IM, respectively (Fig. 1A). In 20.7% (43/208) and 27.4% (57/208) of the calf samples 1–10 and >10 G. duodenalis cysts were detected by IM, respectively (Fig. 1B).
When the FC results were dichotomized at a cut-off point of 1 or 2 gated events, 46.3% (93/201) and 19.9% (40/201) of the cow and 51.9% (108/208) and 35.1% (73/208) of the calf samples, respectively, were classified as G. duodenalis-positive. Of the cows, 45.3% (91/201) and 1.0% (2/201) of the samples had 1–10 and >10 gated events by FC, respectively (Fig. 1C). Of the calves, 37.0% (77/208) had 1–10 and 14.9% (31/208) had >10 gated events, respectively (Fig. 1D). The IM and FC results in both the cows and the calves were right-skewed, and 8.5% of the cows had >50 cysts enumerated by IM, while 17.3% and 8.2% of the calves had >50 cysts enumerated by IM or >50 gated events by FC, respectively. The highest number of gated FC events in the cows was 12. A square root or a natural log transformation did not improve the distributions (data not shown).
Spearman correlation coefficients were 0.47 (P < 0.001) and 0.68 (P < 0.001) for the cows and calves, respectively, indicating a positive association between the 2 tests (Figs. 2A, 2B). However, there was disagreement for a substantial number of samples between the 2 tests: 28.9% (58/201) of the cow and 11.5% (24/208) of the calf samples were IM-positive but FC-negative, whereas 5.5% (11/201) of the cow and 15.4% (32/208) of the calf samples were IM-negative but FC-positive (Tables 1, 2). Of the 58 cow and 24 calf samples that were FC-negative, IM-positive, 31 (53.4%) and 12 (50.0%), respectively, were reconfirmed by IM. Of the 11 FC-positive, IM-negative cow samples, 9 could be revisited by IM, but no G. duodenalis cysts were found in 1 additional slide examined for each of these 9 samples. None of the 32 calf samples that was FC-positive, IM-negative could be revisited because of insufficient quantities of volume left. The agreement between the FC and IM was fair in the cows (κ = 0.33), and it was moderate in the calves (κ = 0.46).
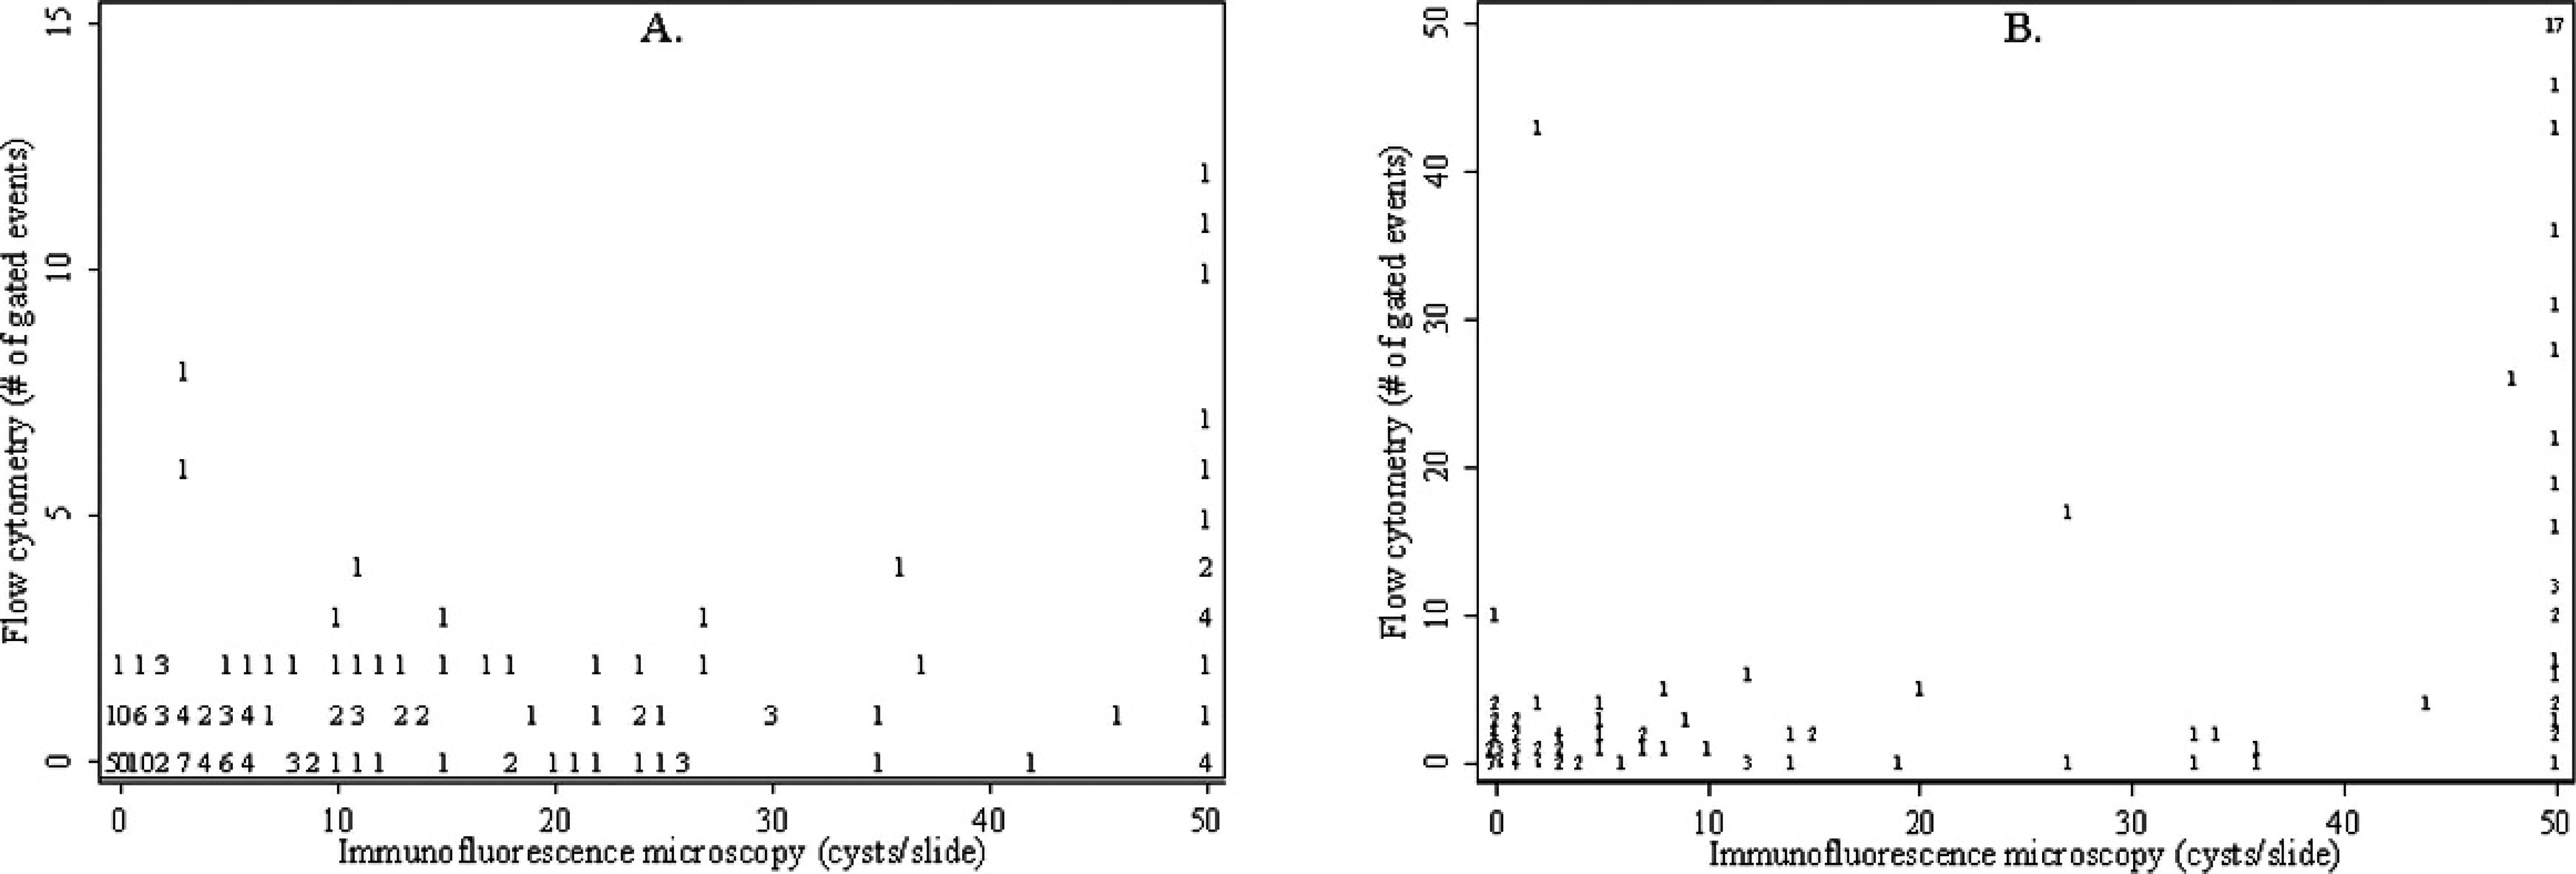
Giardia duodenalis immunofluorescence microscopy (IM) cyst count versus number of gated events in flow cytometry (FC) in 201 cows and 208 calves.
Using the IM as indicative of the true state of nature of each sample, the category-specific likelihood ratios for a positive (≥2 gated events) and negative (0 gated events) FC result in the cows and calves were as follows: an FC result of ≥2 gated events was 16.99 and 7.68 times more likely to be observed in infected cows and calves, respectively, than in noninfected animals; an FC result of 0 gated events was only 0.51 and 0.34 times as likely to be observed in infected cows and calves, respectively, than in noninfected animals (Table 3). The interpretation varied for a sample with an equivocal FC result (exactly 1 gated event); a sample from a cow with exactly 1 gated event was more likely (1.87) to be observed from a cow that was IM-positive for G. duodenalis, whereas the same result in a calf sample was less likely (0.56) to occur if the calf was IM-positive for G. duodenalis.
2 × 2 table of flow cytometry and immunofluorescence microscopy results for the detection of Giardia duodenalis cysts in fecal samples from 201 cows.
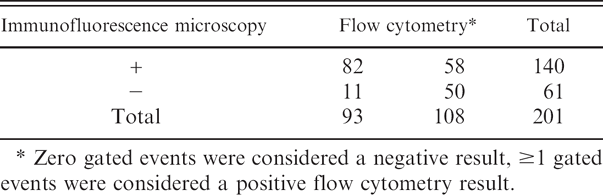
Zero gated events were considered a negative result, ≥ 1 gated events were considered a positive flow cytometry result.
Again, using the IM as indicative of the true state of nature of each sample, the relative Se of the FC was significantly higher in the calves compared with the cows at both cut-off points of ≥1 gated event and ≥2 gated events (P = 0.005 and P < 0.001, respectively; Table 4). Raising the cut-off point decreased the relative Se in the cows to 0.28. The relative Sp was higher in the cows than in the calves, and almost reached 1 in the cows at the cut-off point of ≥2. At a cut-off point of ≥1, FC correctly classified 65.7% and at a cut-off point of ≥2, it correctly classified 49.3% of the cows. Of the calves, 73.1% were correctly classified by FC at a cut-off point of ≥1, whereas 78.4% were correctly classified at a cut-off point of ≥2. The proportion of positive samples detected by the 2 tests was different in the cows at both cut-off points (P < 0.0001), and in the calves at a cut-off point of ≥2 (P < 0.001). It was not different in the calves at a cut-off point of ≥1 (P = 0.28). Dichotomizing both test results at ≥1 and ≥2 produced a FC cut-off point specific LRcp+ of 3.25 and 16.99, respectively, in the cows, and 2.57 and 7.68, respectively, in the calves (Table 4). The LRcp-increased according to the increase in cut-off point (0.51 and 0.73, respectively, in the cows, and 0.34 and 0.39, respectively, in the calves).
2 × 2 table of flow cytometry and immunofluorescence microscopy results for the detection of Giardia duodenalis cysts in fecal samples from 208 calves.
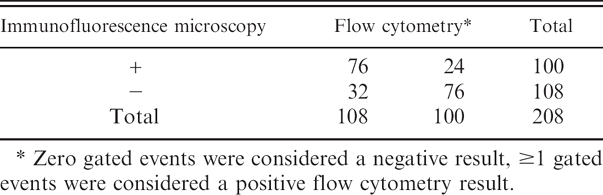
Zero gated events were considered a negative result, ≥1 gated events were considered a positive flow cytometry result.
Category-specific likelihood ratios and approximate 95% confidence intervals for 3 categories of flow cytometry results (number of gated events) compared with dichotomized immunofluorescence microscopy results for the detection of Giardia duodenalis in bovine fecal samples.
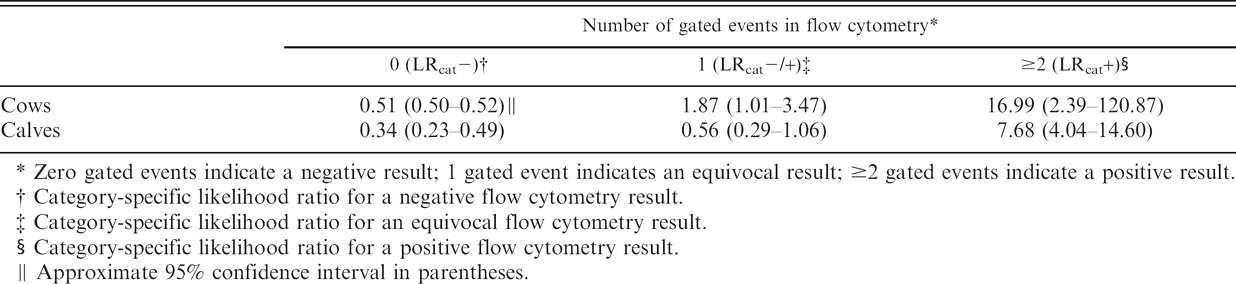
Zero gated events indicate a negative result; 1 gated event indicates an equivocal result; ≥2 gated events indicate a positive result.
Category-specific likelihood ratio for a negative flow cytometry result.
Category-specific likelihood ratio for an equivocal flow cytometry result.
Category-specific likelihood ratio for a positive flow cytometry result.
Approximate 95% confidence interval in parentheses.
Discussion
The present study compared FC and IM for the diagnosis of G. duodenalis in bovine fecal samples. Although the Spearman correlation coefficients indicated some positive association between the 2 tests in both populations, the scatter plots show disagreement between the test outcomes. A great variation in the range of values between the FC and the IM results, especially in the cows, has been noted. It is important to note that the maximum values in both tests were created artificially. In both populations, the FC analysis was finished when 100,000 events had been recorded. In the calves, cysts under IM were enumerated to a maximum of 1,000 cysts. Higher numbers that may have been present were not recorded. There is, however, a difference in the range of values between the cows and the calves. While the cows are expected to shed fewer cysts per gram of feces than the calves, other factors may have contributed to this marked difference; freezing of the cow samples after IM and before FC analysis may have damaged cysts present in the sample. This could have led to an intensity of the fluorescence or the complexity of some cysts, which was different from the control cysts used to calibrate the gated region of the FC. Ideally, samples would have been fixed in formalin immediately after IM was performed. Another probable cause for the difference in range of values between IM and FC may be the 1:5 dilutions of the samples prior to FC analysis, which may have decreased the potential sensitivity of the FC. This also warrants caution in interpreting the scatter plots. The dilution was required as cysts had been concentrated for IM analysis using a sucrose solution with a specific gravity of 1.13. Ongoing work with FC performed by the authors after concluding the data collection for this study has made it evident that sucrose of higher specific gravity (1.18) may capture a greater proportion of cysts, especially when samples are formalin fixed. A likely effect of diluting the samples was that the concentration of debris was reduced, thereby making it easier for the antibodies to bind to their target. Even more importantly, the ratio of the volume of sucrose solution to that of the sample overlay will influence the amount of final debris in the suspension; it appears that the separation of debris from cysts is more efficient when the volume of sucrose is higher than the volume of sample overlay and will need to be optimized for the FC. In this study, the sucrose to sample overlay ratio was slightly higher for the calves than the cows. The discrepancy between the number of gated FC events and cysts on a slide is much less profound in the calves than in the cows. Another possible explanation could be that 5 g of feces was used in the calves for initial cyst concentration and not 20 g, as for the cows. Using less feces would result in a cleaner sample after sucrose centrifugation, and therefore fewer particles that could interfere with FC. Furthermore, if the sample was cleaner, more volume could be analyzed before the maximum 100,000 events were reached in the flow cytometer. Other factors, such as differences in age and diet of the animals, may also affect the performance of the flow cytometer.
Relative sensitivity, relative specificity, and cut-point specific likelihood ratios of the flow cytometry at 2 cut-off points compared with the immunofluorescence microscopy for detection of Giardia duodenalis in bovine fecal samples.
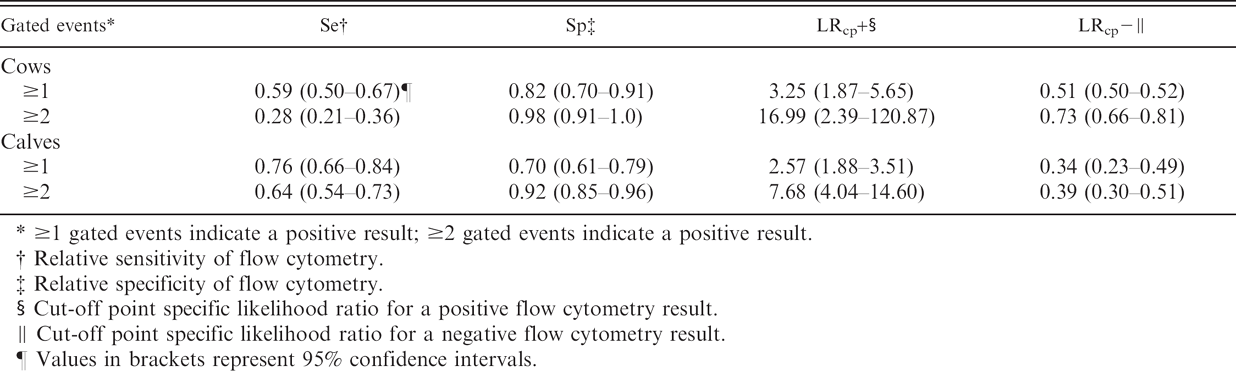
≥1 gated events indicate a positive result; ≥2 gated events indicate a positive result.
Relative sensitivity of flow cytometry.
Relative specificity of flow cytometry.
Cut-off point specific likelihood ratio for a positive flow cytometry result.
Cut-off point specific likelihood ratio for a negative flow cytometry result.
Values in brackets represent 95% confidence intervals.
Both statistical and biological factors should be considered when choosing a cut-off point for a continuous diagnostic test such as the FC results. Consequences of false-positive or false-negative test results must be considered seriously. 8 No treatment is currently approved for giardiasis in cattle in North America, and calves are often subclinically infected. 16 Cows are usually only diagnosed with G. duodenalis infection in the context of research. Therefore, consequences for a false-positive result are not severe. A false-negative result may be considered more important as cows and calves can be infected with a zoonotic genotype of G. duodenalis and be a potential public health risk. 13,19–21 For research purposes, such as G. duodenalis prevalence estimations, a cut-off point that maximizes the overall number of correctly classified results may be the most desirable.
Likelihood ratios, test sensitivity and specificity, and predictive values calculated at different cut-off points are also helpful in making a cut-off decision. 11 By IM, G. duodenalis cysts can be visualized and compared with known positive control slides. This reduces the chances of false-positive results, although it is somewhat dependent on viewer experience. Presence of a single cyst on the slide, however, is confirmatory of a positive G. duodenalis fecal sample, and dichotomization of continuous cyst counts can be based on presence or absence of 1 cyst on the slide. In contrast, choosing a cut-off point for FC is not a straightforward task. Electronic artifacts and fecal debris exhibiting similar characteristics as G. duodenalis cysts may cause a false-positive gated event. It may therefore be beneficial to have an equivocal outcome category that allows for some uncertainty in the classification of test results. In this study, the FC outcomes were categorized into negative, equivocal, and positive results, while the IM served as the reference test that would correctly classify a cow or a calf as having G. duodenalis. The likelihood ratios for each result category are the probability of observing a given result in a G. duodenalis-infected animal compared with the probability of observing the same result in a noninfected animal (based on IM test results). Interestingly, the likelihood ratio for an equivocal result (exactly 1 gated event) in the cows and the calves resulted in opposite interpretations. Similarly, the relative Se and Sp, as well as the number of correctly classified animals, of the dichotomized FC results indicated the same discrepancy between the cows and calves. While the cut-off point of ≥1 gated event may be appropriate in the cows from a strictly statistical point of view, it does not appear to perform as well in the calf feces. The lower Se leading to a higher number of false-negative results in the cows could be a function of the sample preservation protocol and dilution prior to FC analysis and may be an unjust representation of the FC's true Se. Sensitivity in the calves may be less affected by the dilution, as the sample was cleaner to start with. This may explain the higher Se in the calves. While 53% (cows) and 50% (calves) of the FC-negative, IM-positive samples could be reconfirmed by IM, no G. duodenalis cysts were detected in the FC-positive, IM-negative cow samples when additional slides were examined. These could be truly negative samples and indicate a lower specificity of the FC; however, it could also be that the cyst concentration in these samples was low and inhomogenously distributed throughout the fecal sample. Furthermore, for a slide, 0.02 ml of sample was used while the volume of sample was often higher and the concentration different for the analysis by FC. Therefore, looking at only 1 slide to confirm a positive FC result in this study may not have been appropriate.
The method used to estimate relative sensitivity and specificity was based on the assumption that test results of FC and IM were independent. However, multiple samples of the same cows were used, and samples were collected from several calves per farm. Collecting several fecal samples from the same cow introduces a lack of independence among fecal samples. Similarly, samples from calves on a farm may be more alike than from calves from different farms. More important, the relative sensitivity of FC may be different among cows and between calves of different herds. 10 Although both tests were performed on fecal samples, they are based on different diagnostic procedures. However, certain factors may have influenced results of both tests in the same direction with interdependence among tests as a result. The interdependence of samples within cows or to a lesser extent samples of the calves within the same farm could be attributed to biologic factors, such as shedding level, manure consistency, or infection with other pathogens that cause false-positive results. Additionally, pathogen-specific factors such as size of the specific genotype of G. duodenalis could play a role. It is imperative to note that IM is not a true gold standard test for the detection of G. duodenalis cysts in cattle feces, although it is widely used in research laboratories. 1,13,17,20 Therefore, comparing FC with IM may be an unjust representation of the flow cytometer performance. As the detection limit in the IM method used in this study is about 50 cysts per gram of bovine feces, samples with very low cyst concentrations may be falsely classified as negative. Therefore, the true infection status in the 2 populations sampled in this study was likely underestimated. If the analytical sensitivity of FC was higher compared with IM, at least some of the false-positive results obtained in comparison with IM would be true positive samples. In that case, FC could serve as a rapid screening tool for a large number of samples, but positive results should be confirmed with a second, more specific test.
In the present study, FC was not as sensitive as IM in detecting G. duodenalis in cattle feces. In order for FC to replace IM reliably, the relative sensitivity of FC would have to be as good as or better than IM. If FC can be improved to provide the same sensitivity as IM or better, it could be applied as a rapid screening tool followed by a second, more specific test such as IM. Currently, further work is being carried out by the authors to improve the methodology of FC analysis for detecting G. duodenalis in bovine feces. In particular, special consideration is given to sample preparation and processing methods that could increase the sensitivity of FC. Although a closer correlation between IM and FC results are expected with these optimization steps, some differences in sensitivity and specificity should be anticipated. Further, as there is no true gold standard method for the detection of G. duodenalis in bovine feces, the differences found between IM and FC in the present study should not necessarily be interpreted as a deficiency only in the FC method. In a number of earlier studies, FC has been found to be a rapid and sensitive screening tool for detecting the presence of a variety of protozoan parasites in fecal samples from humans and animals. 2,4–6,14,18,23 Results from the present study suggest that with optimization, FC could be useful in surveillance and prevalence studies involving bovine fecal samples in which a large number of samples may preclude the use of more time-consuming microscopic methods. It should be reiterated, however, that FC is meant to be used only as a screening tool and that any FC positive samples should be confirmed wherever possible using microscopy. With regards to the 2 populations sampled in this study, there was a better FC performance in the calf samples compared with the cow samples. It is possible that differences in sample composition contributed to the discrepancy observed between the 2 sample populations and this study showed that different FC cut-off points may be preferable when applying FC to cow and calf feces.
Acknowledgement
The authors would like to thank Dr. Henrik Stryhn for his support with the statistical analyses.
Footnotes
a.
Erie Scientific Co., Portsmouth, NH.
b.
Giardi-a-Glo, Waterborne, Inc., New Orleans, LA.
c.
Aqua-Poly/Mount, Polysciences, Inc., Warrington, PA.
d.
BD Falcon, BD Biosciences, Mississauga, ON, Canada.
e.
BD FACSCalibur, CellQuest Pro Software, BD Biosciences, Mississauga, ON, Canada.
f.
STATA 9.0, StataCorp, College Station, TX.