
Abstract
Because porcine reproductive and respiratory syndrome virus (PRRSV) can be transmitted through semen, PRRSV-free boar studs need to be routinely monitored to rapidly detect any potential PRRSV introduction. However, current protocols for monitoring PRRSV in boar studs are diverse, sometimes very costly, and their effectiveness has not been quantified. The objective of this study was to evaluate the ability of different monitoring protocols to detect PRRSV introduction into a negative boar stud by using a simulation modeling approach. A stochastic transmission model was constructed to simulate the spread of PRRSV in a typical negative boar stud in the USA (herd size of 200 boars, 60% annual replacement) and the performance of monitoring protocols by using different sample sizes (10, 30, and 60 samples), sampling frequency (3 times a week, weekly, and biweekly), and diagnostic procedures (PCR on semen, PCR on serum, ELISA on serum, and both PCR and ELISA on serum). The monitoring protocols were evaluated in terms of the time from PRRSV introduction into the boar stud to PRRSV detection. Protocols that used PCR on serum detected the PRRSV introduction earlier than protocols that used PCR on semen, and these were earlier than those that used ELISA on serum. The most intensive protocol evaluated (testing 60 boars 3 times a week by PCR on serum) would need 13 days to detect 95% of the PRRSV introductions. These results support field observations, suggesting that an intensive monitoring protocol needs to be in place in a boar stud to quickly detect a PRRSV introduction.
Keywords
Introduction
Porcine reproductive and respiratory syndrome (PRRS), a viral disease first described in 1987, 37 is one of the most important diseases affecting swine in the USA. It causes abortion and stillbirths in pregnant sows and respiratory disease in growing pigs, 37 resulting in important economic impact in pig production. 18,22 In the last 2 decades, the swine industry has experienced critical changes. 31 The sow herd size has increased, with 3,000 sows being a common size of current units, and artificial insemination (AI) has become the standard practice, in place of natural breeding. 31 In response to these changes, large boar studs housing between 100 and 400 animals have been built. The risk of transmission of porcine reproductive and respiratory syndrome virus (PRRSV) to sows through AI with semen obtained from PRRSV-infected boars is well recognized. 16,36 Therefore, current risk reduction strategies have made achievement and maintenance of PRRSV-free boar studs a priority. Eradication of PRRSV from a single farm is feasible, 9,11,14 and most boar studs are now considered PRRSV free. However, despite recent advances in biosecurity, 10,12 outbreaks of PRRSV in negative farms still occur, and, very often, the source of the introduction cannot be identified. To intervene as early as possible, monitoring protocols in boar studs play a critical role.
Monitoring of boar studs for PRRSV has traditionally been done by testing for the presence of antibodies by ELISA. A study that surveyed approximately 54% of the boar studs in the USA during summer 2001 reported that the majority of the boar studs (80%) were performing PRRSV monitoring by sampling on a monthly basis or less frequently (Connor JF: 2006, Thesis (MS), University of Minnesota). The same study observed that ELISA was the most common test performed on serum samples and that the most common sample size was 30 boars. Therefore, although with some variations, the standard monitoring protocol was to test 30 boars/month by using ELISA. This observation agreed with previously recommended monitoring protocols. 5,13 However, field experiences have shown the limitations of this protocol to detect a PRRSV introduction before contaminated semen is sent to sow farms. During the last few years, producers and veterinarians have implemented new measures to improve the early detection of potential outbreaks. These measures include the introduction of semen PCR and serum PCR in the monitoring protocols, an increase of the number of boars and/or frequency of sampling, and the development of a new sampling technique (blood swab). 27 As a result, current protocols for PRRSV monitoring in boar studs are diverse, sometimes very costly, and their effectiveness for early detection has not been quantified.
The effectiveness of different monitoring strategies has been evaluated by simulation modeling for a number of animal diseases, such as bovine tuberculosis 15 and classical swine fever. 20 In general, this approach is based on simulating the distribution of infection in a population, together with the ability of different monitoring protocols to detect the infection. The main advantage of this theoretical approach is the ability to evaluate many different sampling and testing strategies otherwise unfeasible to do under field conditions. Consequently, the objective of this study was to assess the ability of different monitoring protocols to detect a PRRSV introduction in a negative boar stud by using a simulation modeling approach.
Materials and methods
The simulation was based on a stochastic model that was structured as 2 integrated components: PRRSV transmission and PRRSV diagnosis. The first component, PRRSV transmission, modeled the spread of PRRSV in a negative boar stud and determined the infection status of each boar over time. The second component, PRRSV diagnosis, modeled the performance of different monitoring protocols for the detection of PRRSV in the scenarios provided by the first component. The model was developed by using commercial software. a , b
Description of the boar stud
To represent the most common boar studs in the USA (Connor JF: 2006, Thesis (MS), University of Minnesota; D Reicks, personal communication), the simulated stud was a 200-head farm with boars housed in individual stalls. All the boars were considered PRRSV naïve (no previous contact with virus). Because replacement of old and nonproductive boars is routinely done in boar studs, the model simulated the introduction of 7% of the inventory (14 boars) every 6 weeks, which provided an annual replacement rate of 60%. The day that the replacement was performed was randomly chosen between day 1 and day 42 post-PRRSV introduction. The culled boars were randomly selected from the total population, independent of their infection status. All the newly introduced boars were considered fully susceptible.
PRRSV transmission model
A compartmental susceptible-infectious-recovered (SIR) model was designed to simulate the transmission of PRRSV in an originally naïve boar stud. In SIR models, each animal in the population, at any given time, is assigned 1 of 3 possible statuses or compartments: susceptible (S), infected/infectious (I), and recovered or resistant (R). 17 Because the transmission of PRRSV in the boar stud was simulated up to 30 days post-PRRSV introduction, only the “S” and “I” compartments were simulated in this case. A modified Reed-Frost model 1 was used to model the transition from the susceptible status to the infected status, under the assumption that the number of boars that become infected each day when PRRSV was introduced in a negative boar stud depended on the number of susceptible and infectious boars. The model assumed that the PRRSV introduction could occur at any day of the week (Monday to Sunday) with equal probability and that only 1 boar became infected at day 1. To represent all the possible outcomes during PRRSV transmission, the classic Reed-Frost model, NCt+1 = St · P, was modified. A binomial distribution was used to model the number of new cases at each day post-PRRSV introduction, as

where NCt+1 was the number of new cases at day t + 1, St was the number of susceptible animals at day t, and P was the probability of having an effective contact with at least 1 infectious animal in the herd from day t to day t + 1. The value of P for each time unit was obtained as P = 1 − qIt , where q was the probability of not having an effective contact and It was the number of infected boars at day t. The value of q was obtained by solving q = 1 − p, where p was the probability of having an effective contact with 1 specific animal in the herd. The value of p was calculated as p = k/(N − 1), where k was the contact rate or the number of effective contacts per boar per day and N was the population size (200 boars).
The contact rate (k) determines how fast an infection spreads in a population. Because PRRSV does not spread at the same rate under field conditions in all field cases, k was modeled by using a uniform distribution, k ∼ Uniform (0.04, 0.5). These limits were calculated from 2 field cases in which negative boar studs were infected by PRRSV and extensive diagnostic work was done (D Reicks, personal communication; J Wadell, personal communication); these cases clinically appeared to represent examples of slow and fast spread of PRRSV, respectively. In this model, it was assumed that the range of k used could account for variability in viral strain, boar stud management, and other factors that may affect the rate of spread of PRRSV.
There is limited information about the duration of the infectiousness after PRRSV infection in adult swine. Wills et al. 35 found that piglets can be infectious up to at least 48 days after infection. In addition, Bierk et al. 3 found that 3 of 12 PRRSV-inoculated sows were infectious at 49, 56, and 86 days after infection. In another study, transmission of PRRSV from infected to sentinel gilts could not be detected at 90 days after infection. 2 However, there is no information about the length of infectiousness in boars. In this transmission model, boars were assumed to be infectious immediately after becoming infected. The model assumed that a boar was equally infectious during the infected period.
PRRSV diagnostics model
Three different diagnostic tests were evaluated: PCR on serum, ELISA on serum, and PCR on semen, as well as a strategy that included both PCR and ELISA on serum. The results for each of the 3 diagnostic tests were considered to be statistically independent.
Boars can be infected with PRRSV for long periods of time, and sensitivity of the diagnostic techniques varies based on days after infection. To reflect these changes in diagnostic sensitivity over time, the “I” status was divided further in 30 sub-statuses, representing the animals at 1 day after infection, 2 days after infection, and so on, up to 30 days after infection. Subsequently, the model assigned each boar to 1 of 31 possible compartments: “S” and “I” (30 compartments, depending on the day after infection).
At each day post-PRRSV introduction, the model simulated the number of boars in each of the 31 compartments that would test positive for each of the 4 diagnostic tests as follows

where Posc,d,t was the number of boars from the compartment c that would test positive for the diagnostic test d at day t, Bc,t was the number of boars in the compartment c at day t (determined by the transmission model), and SEd,c was the sensitivity of the diagnostic test d for boars in the compartment c.
The diagnostic sensitivities of the various tests for boars at the 30 “I” compartments were estimated based on data from previous experimental inoculations of boars with PRRSV 6–8,21,23,25–29,33,34 and are shown in Fig. 1a. To obtain these estimates, the sensitivities reported in the different studies were weighted based on the number of animals used. Estimates from days not available in the literature were interpolated. The sensitivity of the testing procedure based on both PCR and ELISA on serum was calculated as the sensitivity of a combination of tests interpreted in parallel (the boar is identified as positive if at least 1 test result is positive): SEELISA, PCR = 1 – [(1 – SEELISA) · (1 – SEPCR)]. The 3 diagnostic tests were assumed to have perfect specificity.
Sampling protocols
Three different sampling frequencies were simulated: 3 times a week, weekly, and biweekly. Sampling was simulated on Mondays (protocols sampling weekly and biweekly) or on Mondays, Wednesdays, and Fridays (protocols sampling 3 times a week). For biweekly protocols, the week of PRRSV introduction had a 0.5 probability of being a sampling week.
Three different sampling sizes were simulated: 10, 30, and 60 total number of boars per sampling. The sample size of 30 was chosen because it is commonly used in swine farms. Larger and smaller sample sizes of 60 and 10 were chosen because they are feasible and they were appropriate for the comparison of the combination of sample size and sampling frequency. The number of positive samples (Pos Samples) for each diagnostic test (d) and sampling time (t) was simulated with a hypergeometric distribution as follows

where n was the sample size (10, 30, or 60 samples), Total Postd was the total number of boars that would test positive for diagnostic test d at day t, and N was the population size (200 boars). This method is used to simulate sampling without replacement and assumed that samples were randomly selected from the total 200 boars of the stud.
Model outcomes
The performances of the different monitoring protocols were described in terms of time to detection (TD), defined as the time from PRRSV introduction in the boar stud to PRRSV detection. A probability of detection (PD) was calculated for each monitoring protocol at each day after introduction as the proportion of iterations of the model in which the PRRSV introduction had been detected at that point in time.
Convergence was monitored based on the variability of outcome measures. The model was run for 4,000 iterations, which resulted in a variability of TD measures of no more than 1.5%. The TD measures evaluated were percentiles (0% to 100% in 5% increments), mean, and standard deviation.
Another outcome examined for each monitoring protocol was the prevalence at detection (PrevD), defined as the proportion of infected boars at the time of detection. For each iteration of the model, the prevalence at detection was calculated as Itd/N, where Itd was the number of infected boars at the time of detection and N was the total number of boars. For protocols that did not detect the PRRSV during the simulated 30 days after introduction, the prevalence at the end of the simulated period was used.
Sensitivity analysis
A sensitivity analysis was performed to evaluate the influence of the choice of input parameters of the model on the TD of the different monitoring protocols. Two scenarios were analyzed for each input parameter, an extremely low value and an extremely high value. Deviations from the original scenario were calculated in terms of the change of the median TD for the different monitoring protocols.
Boar stud size. A size of 200 boars was chosen for the model, because it is a common size for boar studs in the USA. However, smaller and larger studs exist, and the monitoring protocols may have to be adapted to the stud size. Two scenarios that assumed boar stud sizes of 50 and 500 boars were also evaluated. Although these are extreme small and large boar studs sizes, they represented real situations.
Annual replacement rate. Not all boar studs have the same annual replacement rate. Moreover, the replacement with naïve animals during an unnoticed PRRSV introduction could have important consequences for the PRRSV dynamics. Therefore, the impact of replacement was investigated by evaluating a scenario without replacement and another with 100% annual replacement rate.
Contact rate. The model estimate for contact rate included a range of possible values from 0.04 to 0.5 effective contacts per boar per day. To examine the influence of this estimate on the model outcome, 2 scenarios with the lower and higher limits of this range were evaluated.
Diagnostic test sensitivities. The sensitivities of PCR on serum, ELISA on serum, and PCR on semen assumed in the model (Fig. 1a) were obtained by combining the results of these tests on experimentally inoculated boars, as reported in the scientific literature. 6–8,21,23,25–29,33,34 However, this literature review showed differences in the sensitivity estimates obtained in different studies. Part of these differences could be explained by the different PRRSV strains used for inoculation. Infections with PRRSV strains considered more virulent result in higher levels of viremia and serum antibodies than infections with strains of low virulence. 4,19,32 Therefore, the effect of the change in the estimates of diagnostic test sensitivity was evaluated as part of the model sensitivity analysis. For this purpose, the low (Fig. 1b) and high (Fig. 1c) estimates for diagnostic sensitivity were obtained from the studies that reported lower 26,33 and higher 6,25,27,34 estimates, respectively.
Results
Model results
The model simulated a wide range of different scenarios for PRRSV dynamics. The median and the 5th and 95th percentiles of the simulated prevalences at each day post-PRRSV introduction are shown in Fig. 2. After 30 days of PRRSV introduction, the prevalence ranged from 0 (the initially infected boar was replaced and did not transmit the virus) to 1 (all the boars were infected), with a median prevalence of 0.79. In 3.1% of the iterations, the infected boar could not transmit PRRSV to any other boar during the simulated 30 days. In contrast, in 12.6% of the iterations, all the boars were infected at 30 days post-PRRSV introduction.
The distribution of the TD for the different protocols is shown in Fig. 3. Results for the use of both PCR and ELISA on serum samples are not depicted, because they were practically the same as the results of PCR on serum. Only the 95th percentile was slightly lower in protocols that used both tests, compared with protocols that used only PCR. The results of TD showed a large variability both within and between protocols, ranging from 1 day (the initially infected boar was detected 1 day after infection) to more than 30 days (the PRRSV introduction had not been detected by the end of the simulated period).
Prevalence of infected boars during the 30 days post-PRRSV introduction into a negative boar stud, as predicted from a simulation model developed to evaluate different monitoring protocols for PRRS in boar studs (–- = median prevalence; –– = 5th and 95th percentiles).
Based on the comparison of median TD and of the PD by 1 week, protocols that used PCR on serum detected the PRRSV introduction earlier than protocols that used PCR on semen, and these were earlier than those that used ELISA on serum (Fig. 3, Table 1). These differences were observed for any sample size and frequency. For example, for protocols that tested 60 samples on a weekly basis, the probability of detection of a PRRSV introduction within the first week was 0.42 if PCR on serum was used, 0.19 if PCR on semen was used, and 0 if ELISA on serum was used (Fig. 4a). The prevalence at detection was highest for protocols that used ELISA on serum, followed by protocols that used PCR on semen and protocols that used PCR on serum (Table 1).
Within each combination of sample frequency and diagnostic test, protocols with larger sample sizes had a shorter TD (Fig. 3, Table 1). For example, for protocols that used PCR on serum on a weekly basis, the PD within the first week was 0.09, 0.25, or 0.42 when 10, 30, or 60 samples are tested, respectively (Fig. 4b).
Box-plot representation of the distributions of TD for the different protocols. The upper and lower limits of the boxes represent the 75th and the 25th percentiles of 4,000 iterations, respectively. The upper and lower ends of the lines represent the 95th and 5th percentiles, respectively.
The TD was consistently lower in protocols with more frequent sampling. However, this effect was mainly because of the increase in the overall sample size of the protocol rather than from the frequency of sampling. For example, when protocols with a total sample size of 120 samples per month were compared, the median TD was 13, 12, and 11 days for the protocols that tested 60 samples biweekly, 30 samples weekly, and 10 samples 3 times a week, respectively (Table 1). Furthermore, with respect to the protocols above, the PD within the first week was 0.21, 0.25, and 0.25, respectively (Fig. 4c).
Effect of the diagnostic procedure, the sample size, and the sampling frequency
on the probability of detection (PD).
Sensitivity analysis
A summary of the results of the sensitivity analysis is presented in Table 2.
Boar stud size. The simulation of the same protocols in a stud of 50 boars resulted in TD shorter by 4 to 7 days. Alternatively, in a stud of 500 boars, a 2- to 5-day longer TD was observed. These are the expected results, because the proportion of animals tested was higher (boar stud size of 50 boars) and lower (boar stud size of 500 boars) than the original scenario (200 boars).
Annual replacement rate. Changes on the replacement rate did not affect the median TD of most protocols. In only 3 instances, TD was 1 day shorter in protocols without replacement than in the original scenario. In 2 other cases, TD was 1 day longer in protocols with 100% replacement rate.
Contact rate. When an estimate of 0.04 effective contacts per boar per day was used, PRRSV spread was very slow and the predicted TD was 1 to 20 days longer. This change was especially marked for protocols with low sample sizes and low sampling frequencies, which failed to detect the PRRSV introduction in a larger proportion of the cases. When 0.5 effective contacts per boar per day were used as an estimate of high contact rate, PRRSV spread faster and TD was 1 to 6 days shorter.
Diagnostic sensitivity. When low test sensitivity estimates were used, TD was 1 to 7 days longer than in the original scenario. This increase in the TD was larger for the protocols with lower sample size and/or sampling frequency. Moreover, the largest increases in TD were observed for semen PCR protocols, followed by serum PCR and serum ELISA. Under the opposite scenario, when using the high test sensitivity estimates, TD was unchanged or was 1 to 2 days shorter.
Nevertheless, these variations in the input values of the model did not change the overall observations described for the original model regarding differences between diagnostic tests, sample size, and sampling frequency.
Discussion
The main objective of the monitoring is to avoid transmission of the virus to sow farms through semen in case the stud gets infected. However, boars can shed PRRSV in semen as early as 2 days after infection, 21,27 and they do not necessarily show clinical signs. 37 The results from this study suggest that monitoring protocols have to be intensive to detect a PRRSV introduction early. Field observations support this finding (Huinker CD, 2002. Proc Allen D Leman Swine Conference, pp. 65–67). Based on this transmission model, even the most intensive protocol evaluated (testing 60 boars 3 times a week by PCR on serum) would need 13 days to detect 95% of the PRRSV introductions. However, it should be noted that the model assumes that there are no clinical signs. Under field conditions, a targeted monitoring protocol that tests animals that are showing clinical signs could reduce the TD of the monitoring protocol.
Results of the time to detection (TD) and prevalence at detection (PrevD) for different monitoring protocols predicted from a simulation model developed to evaluate monitoring protocols for PRRS in boar studs.
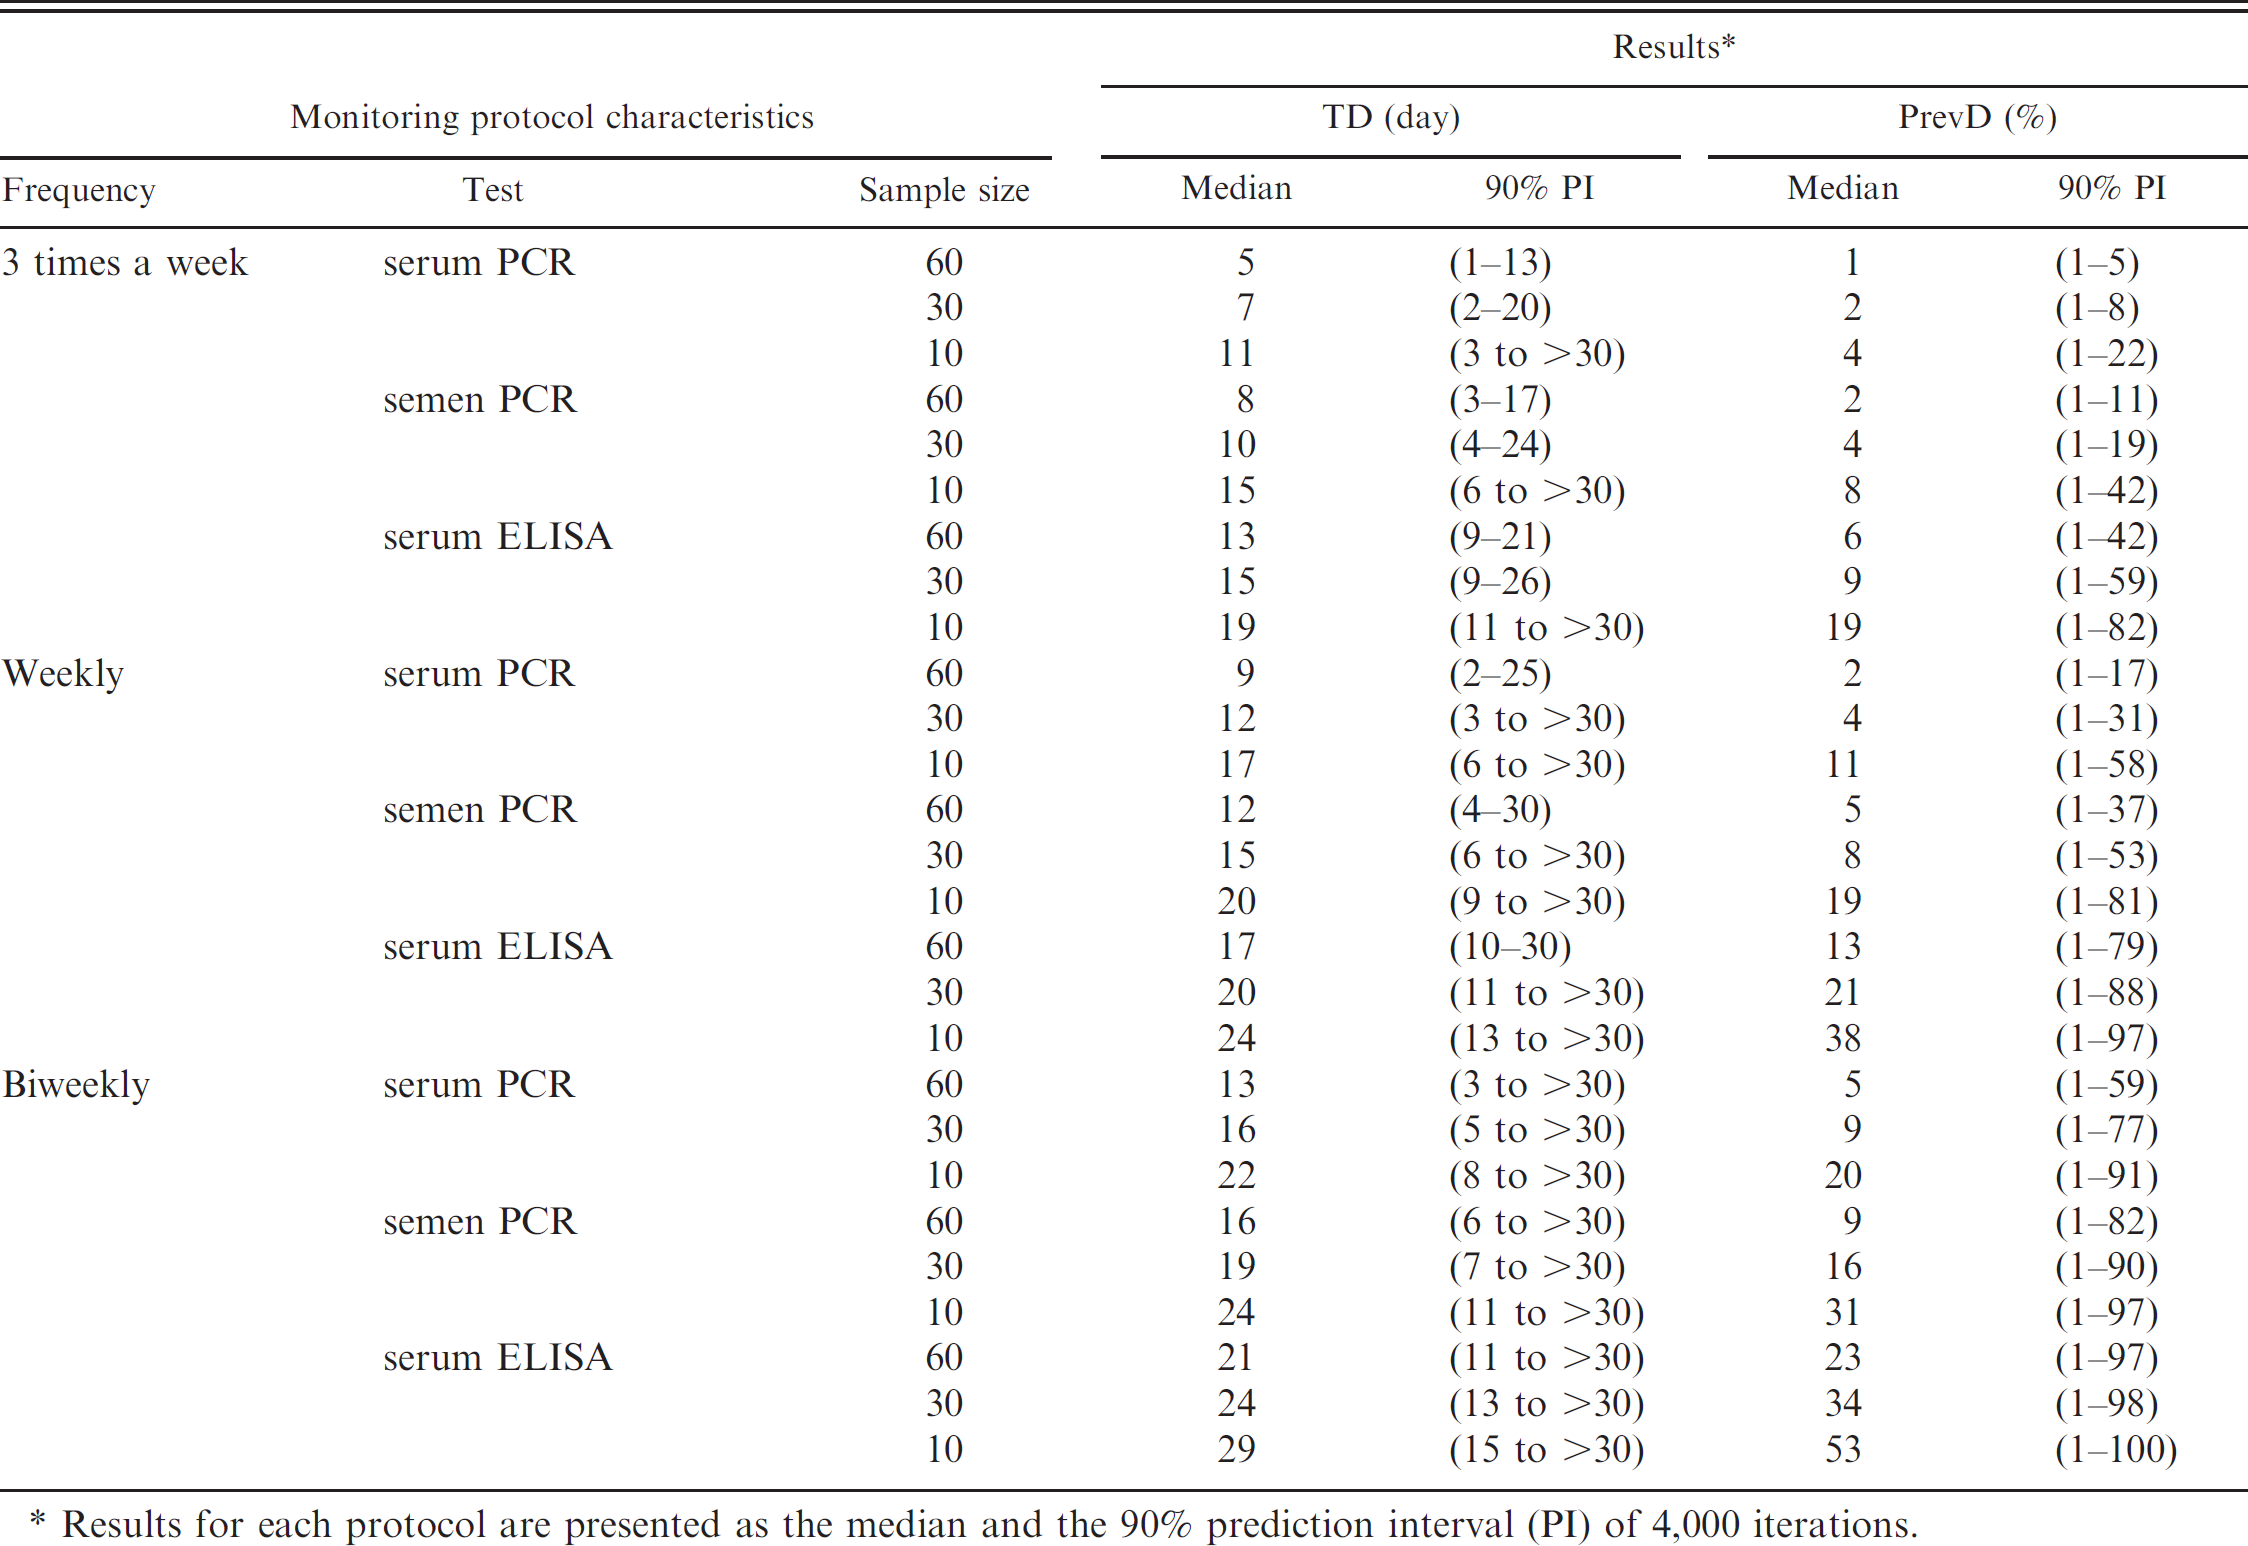
Results for each protocol are presented as the median and the 90% prediction interval (PI) of 4,000 iterations.
A large variability was observed in the results tor TD for a given protocol. Two sources of variability within the protocol can be identified in this model. One source of variability was because of modeling the contact rate with a uniform distribution. This variability in the input contact rate was introduced to simulate the variability in the spread of PRRSV within a naïve herd that was observed in PRRSV outbreaks in boar studs (D Reicks, personal communication) and other swine farms. 37 The model predicted that the median prevalence at 30 days after PRRSV introduction was 0.79, with a 90% prediction interval from 0.01 to 1. There are no reports from PRRSV outbreaks in boar studs in the scientific literature to validate this observation. However, Nodelijk et al. 24 reported a prevalence of 0.89 in a naïve 115-head sow herd 1 month after the last negative sampling. The additional variability can be attributed to the use of binomial and hypergeometric distributions to simulate the effect of chance in the probability of a boar to become infected, to be selected for sampling, and to test positive to a given test.
The sensitivities of the different diagnostic procedures evaluated depend on how long after PRRSV infection the sample was taken (Fig. 1a). 34 Thus, sensitivity of PCR on serum is high during the first 2 weeks after infection and low thereafter. In contrast, the sensitivity of ELISA on serum is low during the first 2 weeks of infection and very high thereafter. Finally, the sensitivity of PCR on semen is somewhat intermediate throughout the first month of infection. Because of these differences, it is very difficult to intuitively know how soon we can expect a given monitoring protocol to detect a PRRSV introduction. The transmission model allowed us to estimate the TD for various protocols by taking into account the changes in sensitivity at different times after infection for each boar, as well as the changes in prevalence at different times after PRRSV introduction in the boar stud. The stochasticity in this model allowed us to consider all possible scenarios of prevalence over time, sampling, and test results that are reflected in the variability of TD for a given protocol. If, for example, monitoring of studs similar to the one described here is performed by testing 30 semen samples 3 times a week, then the model predicted that in 50% of the cases the PRRS introduction would be detected by day 10, however, it could be as early as 4 or as late as 24 (Table 1, Fig. 3).
Results of the sensitivity analysis of a simulation model developed to evaluate different monitoring protocols for PRRS in boar studs.
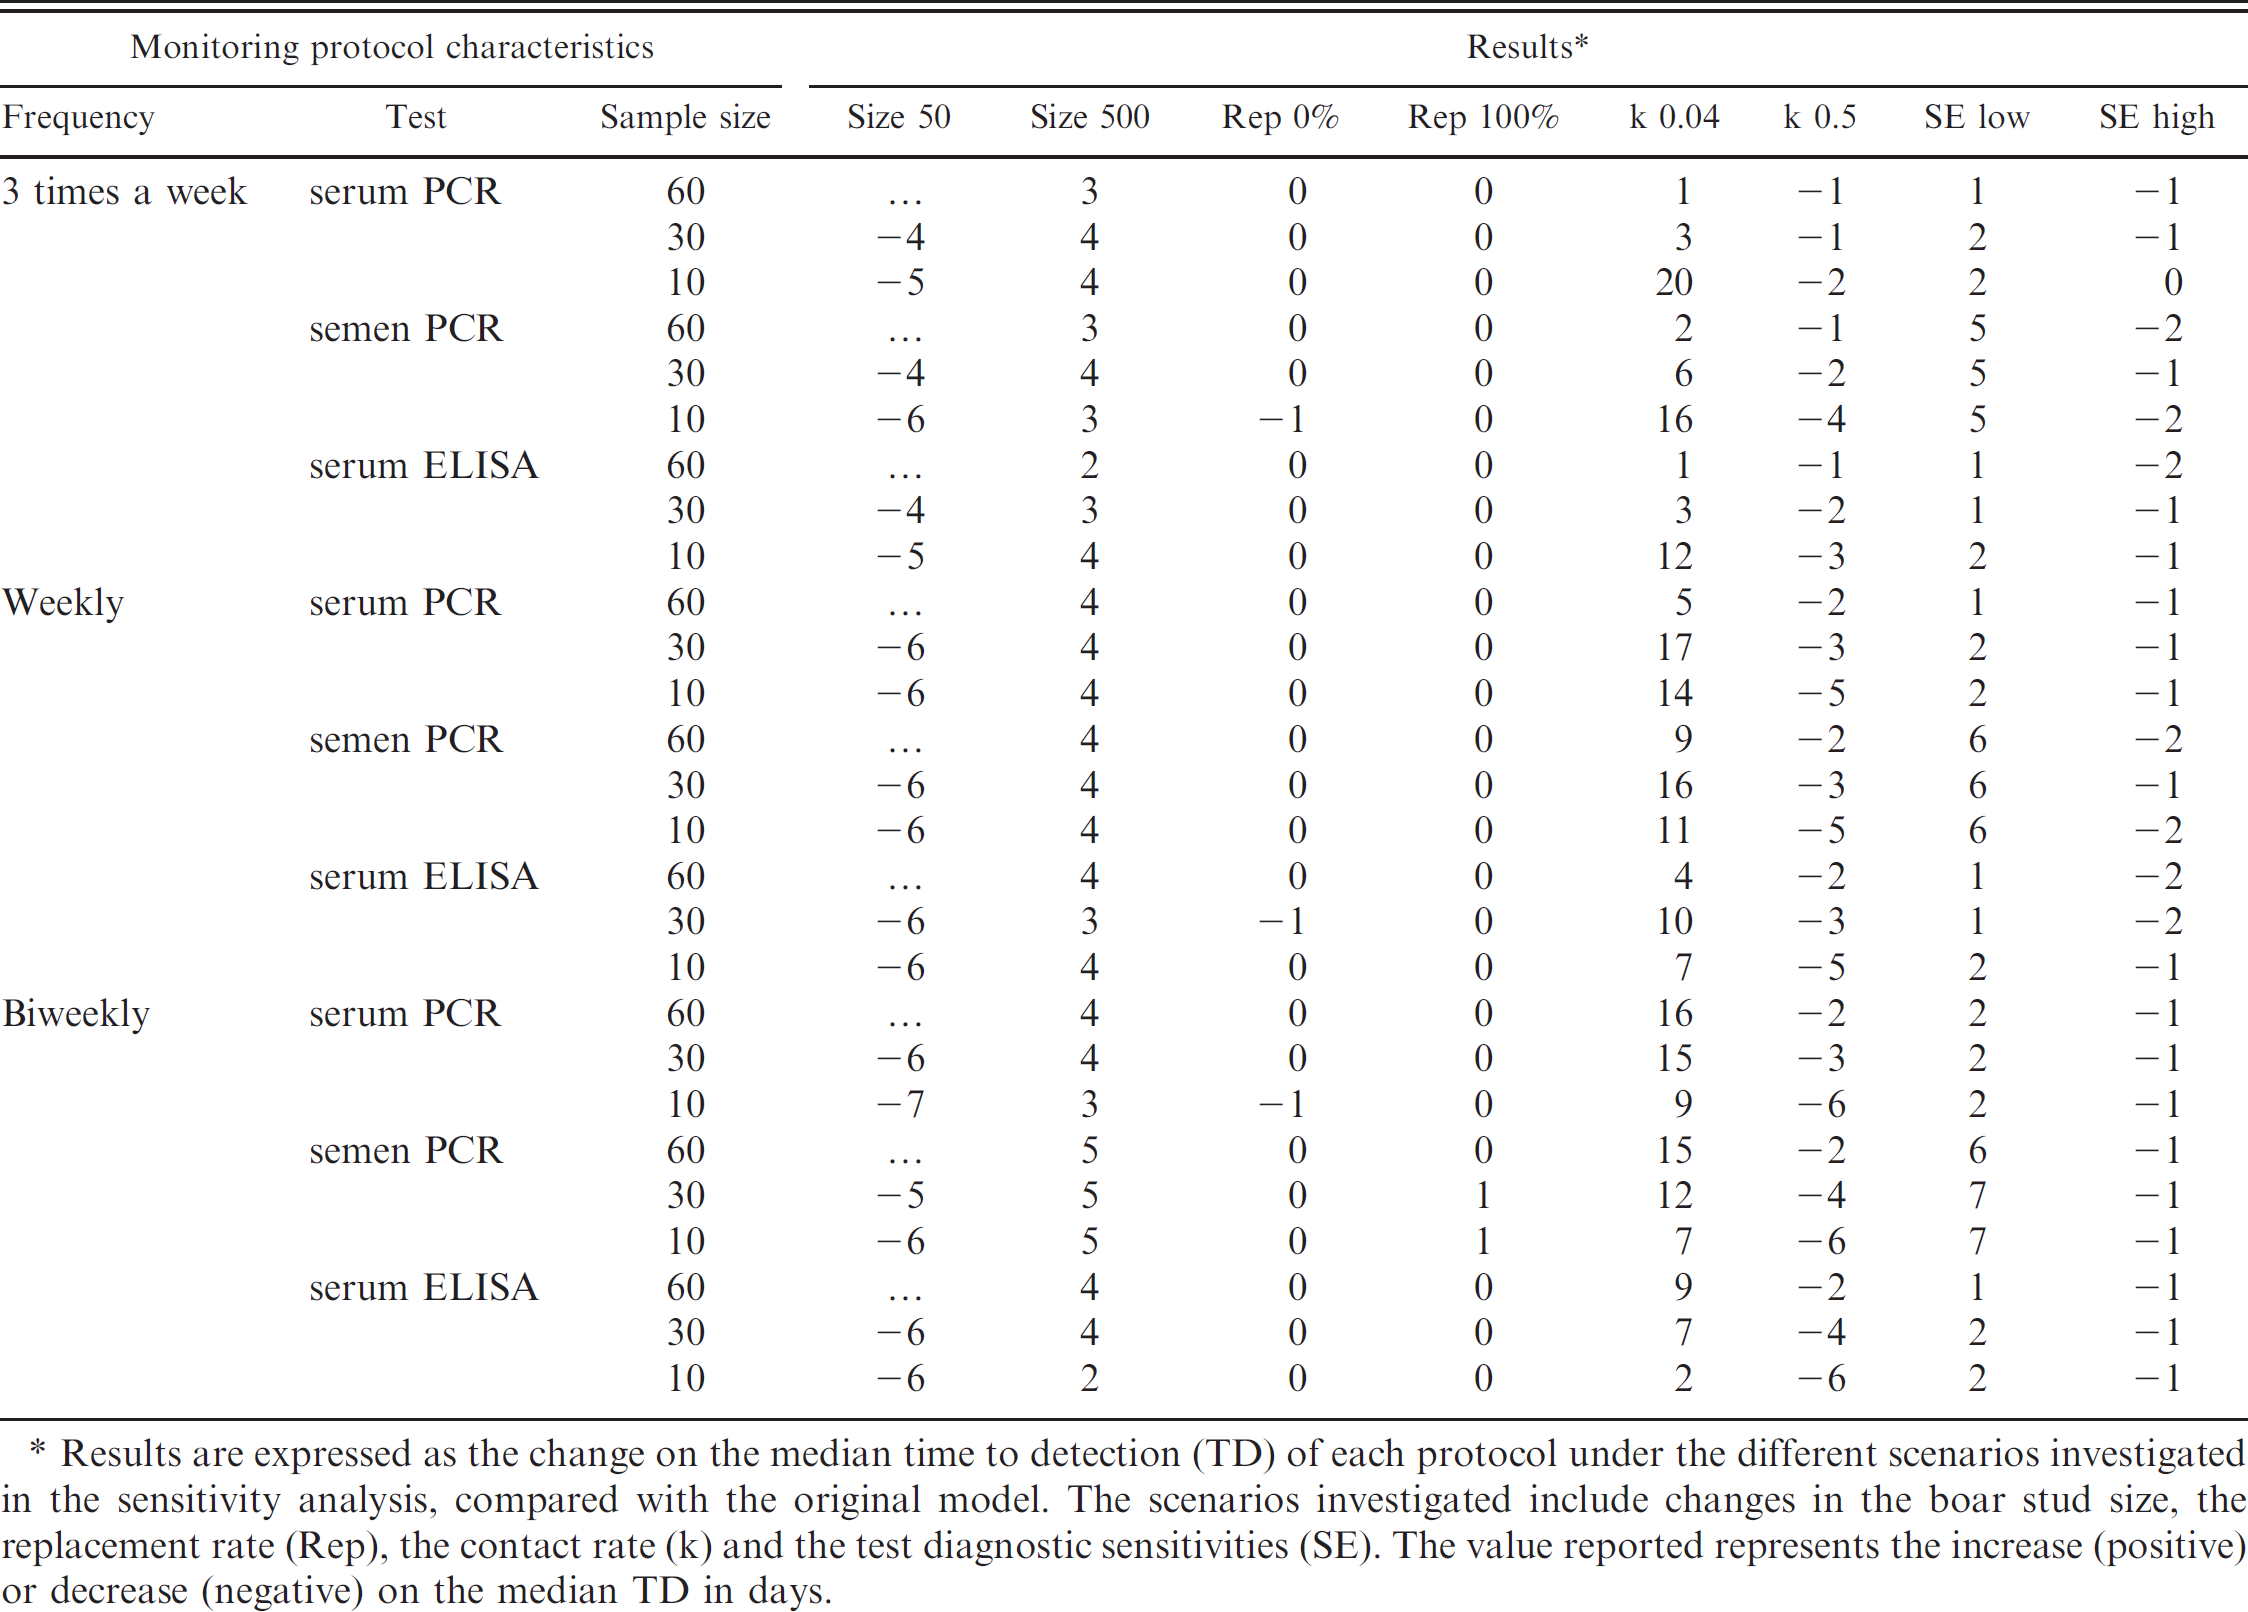
Results are expressed as the change on the median time to detection (TD) of each protocol under the different scenarios investigated in the sensitivity analysis, compared with the original model. The scenarios investigated include changes in the boar stud size, the replacement rate (Rep), the contact rate (k) and the test diagnostic sensitivities (SE). The value reported represents the increase (positive) or decrease (negative) on the median TD in days.
While recognizing the large variability in the TD, the TD of protocols that used serum PCR was consistently shorter than the TD of protocols that used semen PCR or serum ELISA for each combination of sample size and sampling frequency. This observation was true for all the percentiles of TD observed (5th, 25th, 50th, 75th, and 95th; Fig. 3). Therefore, these results suggest that PCR on serum is the best combination of diagnostic test and specimen to monitor boar studs for PRRSV. Moreover, results from this study suggest that serum ELISA is not an appropriate test to monitor negative boar populations. Furthermore, a diagnostic procedure that tests serum samples by ELISA and PCR was evaluated because it represents a potential way to increase sensitivity without having to increase sample size. However, running PCR and ELISA did not seem to enhance the performance of monitoring protocols compared with running PCR alone. A limitation of this study was that it did not take into account other characteristics of the diagnostic tests that may have important practical implications, such as the specificity, the cost (ELISA is less expensive than PCR), and the ease of sampling (semen samples are easier to obtain than serum samples). A quantitative comparison between protocols would need to evaluate the cost of each protocol versus the gain in days of early detection. Furthermore, it would be required to know the economic benefits brought by each day of early detection and the difference in TD between protocols that would make a difference to producers.
For a fixed total number of samples, sampling frequency did not appear to have a critical role in protocol performance, as shown in the example in Fig. 4c. This is because, although increasing sampling frequency increases the chances of sampling the infected herd earlier, the number of samples tested each sampling time is smaller and, therefore, the power is lower. However, if an intensive monitoring protocol is to be performed, sampling as frequently as 3 times a week may need to be done.
The ideal monitoring protocol for negative boar studs would involve testing a large number of boars by serum PCR. This is expensive and laborious. Therefore, there is a need for solutions that can make a very intense monitoring protocol more affordable. Recently, a new sampling technique that consists in puncturing the ear vein and collecting the blood with a swab was described. 27 This technique allows obtaining a blood sample without stressing the boar or compromising the safety of the person collecting blood. Another strategy that is often used is the test of pooled samples. Pooling is a strategy that could be useful if the target analyte is present in large amounts in the sample and the analytical sensitivity of the test is high. 30 This may be the case for PCR from boar serum samples during the first 2 weeks of infection. However, the sensitivity of both blood swab PCR and pooling serum samples for PCR is decreased by a dilution effect, compared with the sensitivity of serum PCR in individual samples. Further work is needed to obtain estimates of the sensitivity of pooled serum and blood swab before protocols that use these strategies can be evaluated.
In conclusion, this study highlights the importance of an intensive monitoring protocol in boar studs. Further efforts should be directed at facilitating the implementation and reduction in the cost of such protocols. For that purpose, the use of new sampling techniques and testing strategies, such as blood swab and pooling, and the development of on-farm diagnostic tests need to be investigated.
Acknowledgement
This project was funded by the National Pork Board (Project 04−197) and the USDA NRI PRRS CAP Project.
Footnotes
a.
Microsoft Office Excel 2003.
b.
@Risk 4.5.4 Professional, Palisade Corp., Ithaca, NY.