
Abstract
Alpha-1-acid glycoprotein (AGP) increases in the blood of cats with feline infectious peritonitis (FIP), a lethal disease caused by feline coronavirus (FCoV). However, the diagnostic potential of AGP might be limited because AGP also increases in pathophysiological conditions other than FIP. In this retrospective study, the diagnostic potential of serum AGP concentration was evaluated on the basis of the pretest probability of disease, according to the Bayesian approach. Serum AGP levels from cats with FIP (group 1; n = 58) and without FIP (group 2; n = 104) were evaluated. Non-FIP cats were further subgrouped as follows: 2a) inflammation (n = 26), 2b) asymptomatic FCoV infection (n = 49), 2c) injection-site sarcoma (n = 19), 2d) postvaccination (n = 7), and 2e) specific pathogen free (n = 3). Standard descriptive analyses by group and empirical receiver-operating characteristic (ROC) curve estimation were performed. Ordinary logistic regression analysis was performed to derive an estimate of the continuous likelihood ratio to produce the posttest probability of disease for any combination of pretest probability and serum AGP value. The comparison of serum AGP levels in the different groups and the analysis of the ROC curve confirmed that serum AGP is a powerful discriminating marker for FIP. The Bayesian approach demonstrated that when the pretest probability of FIP is high, based on history and clinical signs (groups 1 or 2a), moderate serum AGP levels (1.5–2 mg/ml) can discriminate cats with FIP from others, while only high serum AGP levels (>3 mg/ml) can support a diagnosis of FIP in cats with a low pretest probability of disease (groups 2b to 2e).
Introduction
The diagnosis of feline infectious peritonitis (FIP) is often challenging. The clinical suspicion of FIP might be supported by the analysis of effusions when present, 11 , 15 , 21 but histology followed by immunohistochemical or immunofluorescent detection of feline coronavirus (FCoV) within intralesional macrophages are the only conclusive tests. 1 , 3 The application of biopsies in vivo is limited by the anesthestic risks associated with surgical biopsy 1 and the relatively high percentage of unsuitable or falsely negative tru-cut or fine-needle aspiration biopsies. 8 Serology and polymerase chain reaction techniques are not suitable for FIP diagnosis because they do not differentiate between the widespread low pathogenic FCoVs and the mutant pathogenic FCoV strains. 1 , 12
A previous study 24 reported high levels of à1-acid glycoprotein (AGP) in cats with experimentally induced FIP. This finding was confirmed by another study, 6 which proposed the possible use of serum AGP as a diagnostic tool for FIP. Serum AGP is now widely used in diagnostic profiles for FIP. 1 However, serum AGP levels increase in inflammatory disorders other than FIP, 6 , 13 , 25 , 26 neoplasia, 5 , 20 and asymptomatic but FCoV-positive cats. 9 This lack of specificity limits the diagnostic potential of serum AGP as a diagnostic test for FIP.
Evidence-based interpretation of diagnostic tests is based on the use of likelihood ratios (LRs), that is, the likelihood that a given test result is expected in an animal with the condition of interest (a true-positive case) compared to the likelihood that the same result would be expected in an animal that did not have the condition of interest (a false-positive case). LRs can give information about the informative power of a test because they allow the application of the Bayes formula to estimate the posttest probability of disease from the pretest probability. 2 , 24 LRs are helpful in selecting the appropriate diagnostic test(s) or sequences of tests. In the case of tests with dichotomous results (positive vs. negative), LRs can be calculated using the sensitivity (Se) and specificity (Sp) of the test. The positive LR corresponds to Se/(1 - Sp), while the negative LR corresponds to (1 - Se)/Sp. 7 Similarly, the predictive value can be easily calculated using the Bayes formula or the nomogram of Fagan. 7 LRs can be calculated either as binary LRs (arbitrarily determining a cut-off), as multilevel LRs (using predefined intervals of results), or as continuous LRs for each discrete result value. In the case of a test result usually expressed on a continuous numerical scale (as in the case of serum AGP), the dichotomization of data necessarily produces some loss of diagnostic information. The objective of this study was thus to assess the diagnostic value of feline AGP for feline infectious peritonitis using the LR approach and the Bayes formula.
Materials and methods
To achieve the objective, serum AGP concentrations from 162 cats of known FIP status were retrospectively evaluated and used to estimate continuous LRs, which in turn were used to show how the Bayes rule integrates serum AGP levels and pretest probabilities to yield the posttest probability of FIP.
Case selection
Archives from the Department of Veterinary Pathology, Hygiene and Public Health, University of Milan, were examined to identify all the cats on which serum AGP was measured during routine diagnostic or research activity over a 5-yr period (2001–2006). These cases (n = 344) were then examined using the following criteria:
Presence of adequate records containing information on signalment, history, clinical signs, laboratory findings, and follow-up
Presence of a final diagnosis in the available records above
Serum AGP measurement performed in the authors' laboratory using the single radial immunodiffusion (SRID) method
After this screening, 182 cases were excluded from the study. The remaining cases (n = 162) were classified into 2 main groups:
Group 1. FIP group. This group was composed of 58 cats that had clinical signs and laboratory findings confirmatory of effusive FIP (n = 53) or dry FIP (n = 5). Hematology and serum biochemistry in these cats revealed nonregenerative anemia, neutrophilia, lymphopenia, increased total proteins, and total-, α2-and γ-globulins. Cytology and protein analysis of the effusion in the effusive cases supported the diagnosis of FIP. All the cats were serologically negative for feline immunodeficiency virus (FIV) and feline leukemia virus (FeLV) infection. Anti-FCoV serology, performed by an immunofluorescence test produced at the University of Zurich according to Osterhaus et al., 14 was positive in 40 of the 44 cats in which this test was performed. All the suspected dry forms and 46 effusive cases had the diagnosis confirmed by necropsy, histological, and immunohistochemical findings. In the 7 effusive cases in which necropsy was not performed, FIP was confirmed using immunofluorescence staining of cells obtained by cytocentrifuging the effusions. 15
Group 2. Non-FIP group. This group was composed of 104 cats in which the diagnosis of FIP was definitively excluded. Based on the clinico-pathological findings, the clinical records, and the follow-up, these cats were further divided into the following subgroups:
Group 2a. Inflammatory processes other than FIP. This subgroup was composed of cats (n = 26) in which there was a clinical suspicion of FIP, based on clinical signs consistent with the wet (n = 6) or dry (n = 20) form of the disease. Specifically, the clinical suspicion of FIP was due to the presence of intracavitary effusions in 6 cats. Cytology and/or postmortem examination in these cats excluded the diagnosis of FIP and led to the final diagnosis of epithelial tumors (n = 4), lymphoma (n = 1), and cholangioepathitis (n = 1). In the remaining 20 cases, the clinical suspicion of FIP was due to the presence of fever (n = 14) or neurological signs (n = 6). Nine of the 14 febrile cats recovered after appropriate antibiotic therapy and were still alive 2 to 5 yr later, thus excluding a diagnosis of FIP. The remaining 5 febrile cats developed gastrointestinal signs consistent with feline panleukopenia, confirmed by postmortem examination. Of the 6 cats with neurological signs, a diagnosis of toxoplasmosis (confirmed by positive serology and response to specific therapy) was made in 4 cats, which recovered from neurological signs and were still asymptomatic 3 to 5 yr later; in the remaining 2 cats, intracranic tumors were confirmed at necropsy.
Group 2b. Asymptomatic FCoV infection (n = 49). These were FCoV-positive, FIV-negative, and FeLV-negative cats living in breeding catteries known to have a high prevalence of FIP. All these cats were asymptomatic at the time of serum sampling and remained asymptomatic over a follow-up period ranging from 18 mo to 5 yr.
Group 2c. Injection site sarcoma (n = 19). These cats were sampled before surgical removal of feline injection site sarcoma as part of another study.
Group 2d. Postvaccination (n = 7). These were clinically healthy shelter cats aged approximately 3 mo and were serologically negative for FIV, FeLV, and FCoV (n = 7). Serum was collected from these cats approximately 20 days after vaccination for feline panleukopenia, calicivirus, and herpesvirus. a
Group 2e. Specific pathogen-free (SPF) cats. Serum samples were collected from 3 clinically healthy, untreated SPF cats.
AGP measurement
In all the cases included in this study, AGP was measured using a commercially available SRID kit b following the manufacturer's instructions. Briefly, 5 μL of standard solutions containing 0.5 mg/ml and 2 mg/ml of feline AGP, respectively, was put in the first 2 wells of the plate, then 5 μL of each serum sample was put in separately identified wells, using 1 well for each sample. Plates were then incubated at room temperature for 48 hr, and the diameter of precipitation rings was then measured. Values obtained from the 2 standard solutions were used to design a standard curve, and values from the case samples were plotted in this curve to extrapolate absolute AGP levels, expressed as mg/ml.
Descriptive statistics of AGP in the FIP group versus the non-FIP group and versus the 5 subgroups of group 2.*
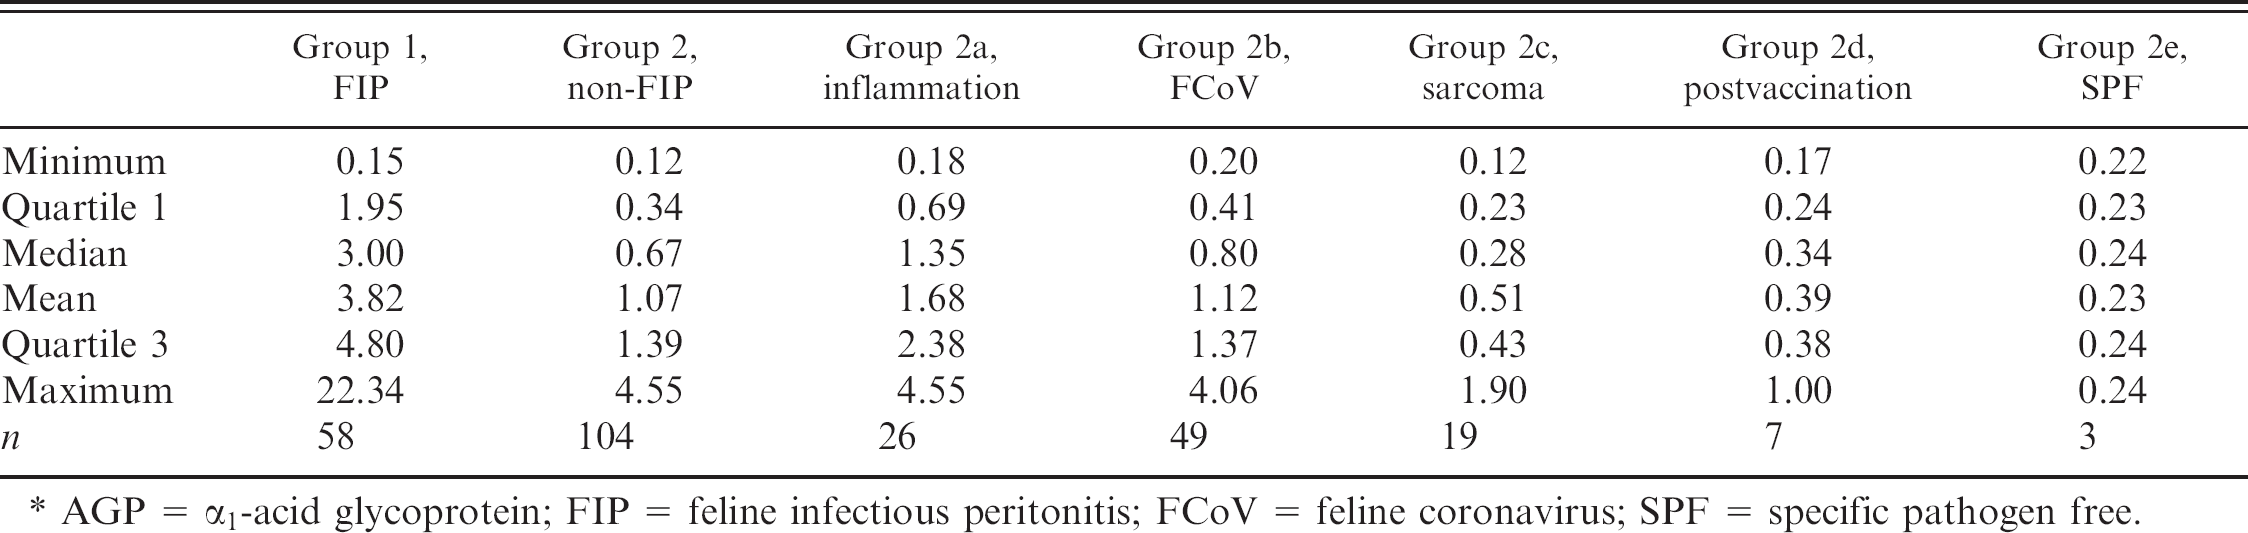
AGP = α1-acid glycoprotein; FIP = feline infectious peritonitis; FCoV = feline coronavirus; SPF = specific pathogen free.
Statistical analysis
Differences in AGP concentration between cats with and without FIP were analyzed using a Kruskall-Wallis nonparametric test. The significance level was set at P ≤ 0.05.
Receiver-operating characteristic (ROC) curve analysis with point and interval (95% confidence intervals [CIs]) estimation of area under curve (AUC) was performed to explore the power of AGP as a diagnostic test. 10
Continuous LRs were calculated from the logistic regression equation parameters using actual AGP values. This method, described in detail by Simel et al., 22 uses the following equation to calculate continuous likelihood ratios and their 95% CIs:

where x is the measured AGP test value and SE is the standard error for β, as derived from the logistic regression equation.
The variable xa is derived from the following equation:

where p is the prevalence in the data set of FIP animals and α and β are the parameters of the logistic regression equation, intercept and regression coefficient of the AGP value, respectively.
For each AGP value recorded, the posttest probability of disease has been calculated using the Bayes formula as described by Albert 2 and Habbema et al. 10
All the analyses were performed with a software developed by the R Development Core Team. 18
Results
Group comparisons
Descriptive statistics, stratified by disease group, are reported in Table 1. AGP values were higher in group 1 cats than in the whole of group 2 and than in each group 2 subgroup (P < 0.01).
ROC curve
The ROC curve, obtained by plotting sensitivity (the true-positive rate) versus 1 -specificity (the false-positive rate) for each AGP value is depicted in Fig. 1. The AUC was 0.85 (95% CI = 0.78–0.92).
Likelihood ratios
The parameters estimated by logistic regression (α = −2.6038, SE = 0.3838; β = 1.0427, SE = 0.1730) were used to calculate continuous LRs for various AGP values (Fig. 2).
As shown in Fig. 2, serum AGP values ≥3 mg/ml were associated with a steep increase in LR. For a serum AGP concentration of 4 mg/ml, the LR is approximately 8; that is, the probability of observing an AGP value of 4 mg/ml is 8 times higher in a cat with FIP than in a cat without FIP.
Posttest probability
The posttest probabilities, calculated from logistic regression from the data presented above, are shown in Fig. 3. Four different pretest hypothetical probabilities, each corresponding to a commonly encountered clinical scenario, are represented in Table 2. As demonstrated by the table, in the case of a very low pretest probability of FIP, the posttest probability remains low even at very high serum AGP levels. In the case of a low pretest probability of disease, the posttest probability increases with the serum AGP concentration but remains lower than 50%, even for high serum AGP concentration. In the case of medium pretest probability of FIP (e.g., in the case in which age and clinical signs would lead to a suspicion of FIP but the negative serology and the absence of contacts with possible FCoV shedders would not), the posttest probability is higher than 50% even for medium (e.g., 2 mg/ml) levels of serum AGP. In the case of a high pretest probability (e.g., history, clinical signs, and laboratory findings, including the negative serology during an acute episode of ascitis, consistent with FIP, but absence of additional clinical or laboratory abnormalities such as ocular or neurological signs, lymphopenia), the posttest probability of FIP is >60% for serum AGP values of 1 mg/ml and increases to >80% and >92% for serum AGP values of 2 and >3 mg/ml, respectively. In addition to the schematic information reported in Table 2, Fig. 3 shows how, in the same 4 scenarios reported in Table 2, logistic regression allows for the estimation of the posttest probability for each serum AGP concentration, thus providing more accurate information than is obtained using the multilevel cut-off (e.g., <1 mg/ml, 1 to 2 mg/ml, etc.).
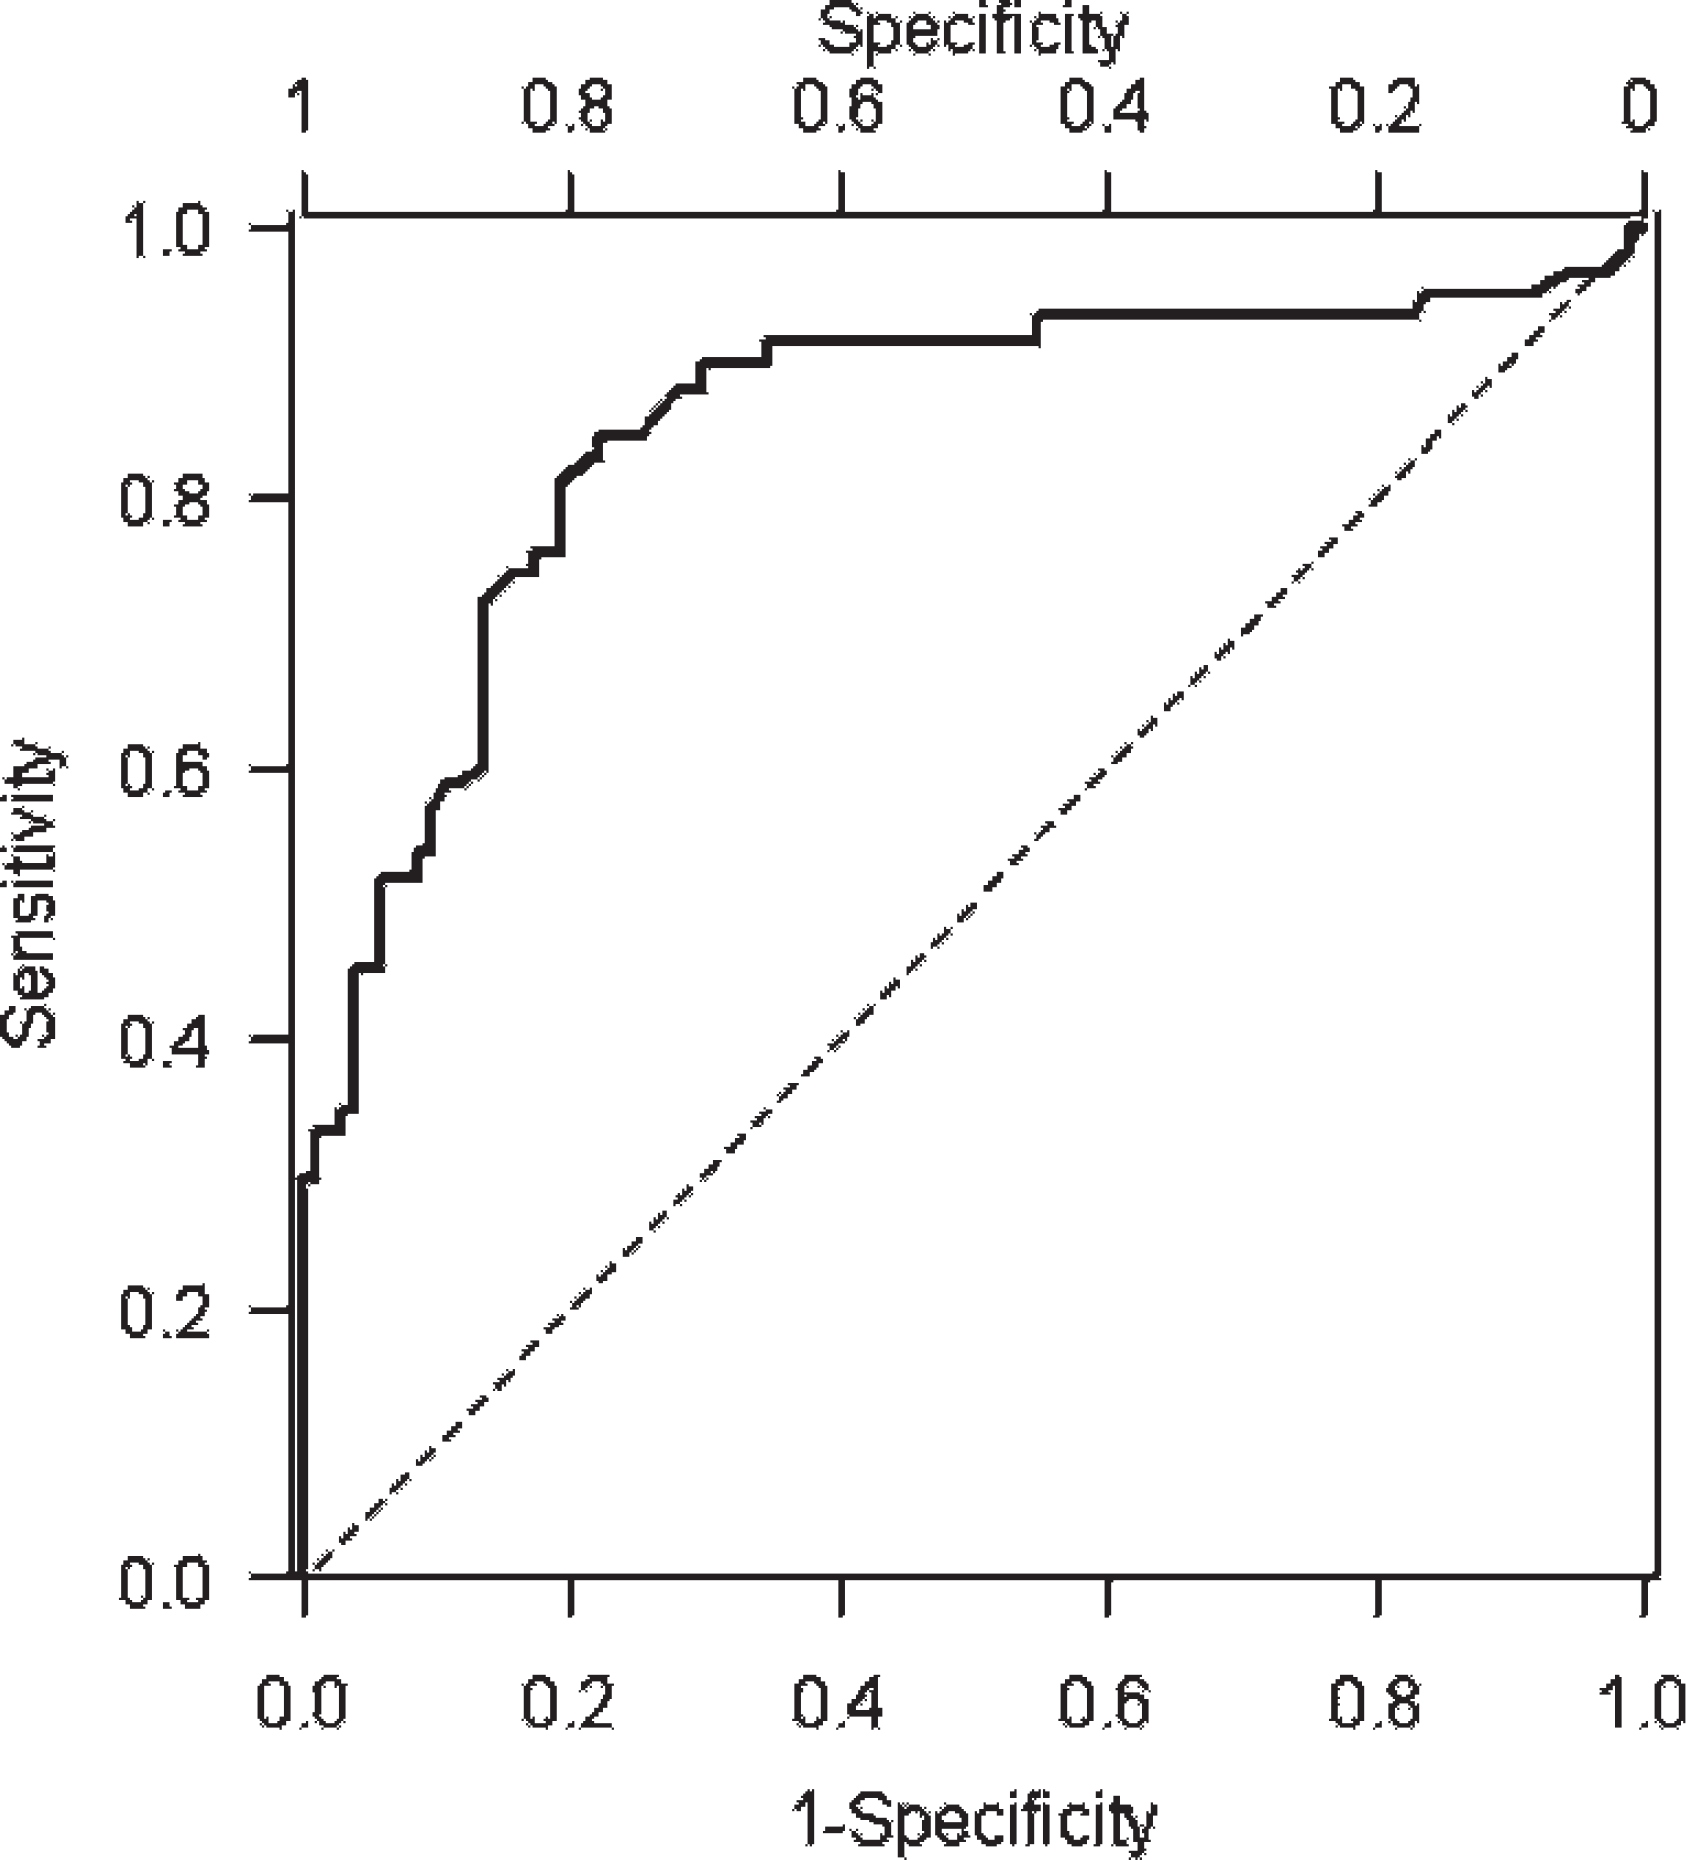
Receiver-operating characteristic curve of α1-acid glycoprotein (AGP) for the diagnosis of feline infectious peritonitis (FIP): the area under the curve is 0.85 (SE = 0.034, 95% confidence interval = 0.78–0.92), thus confirming that AGP increases have a good discriminating power for FIP.
Discussion
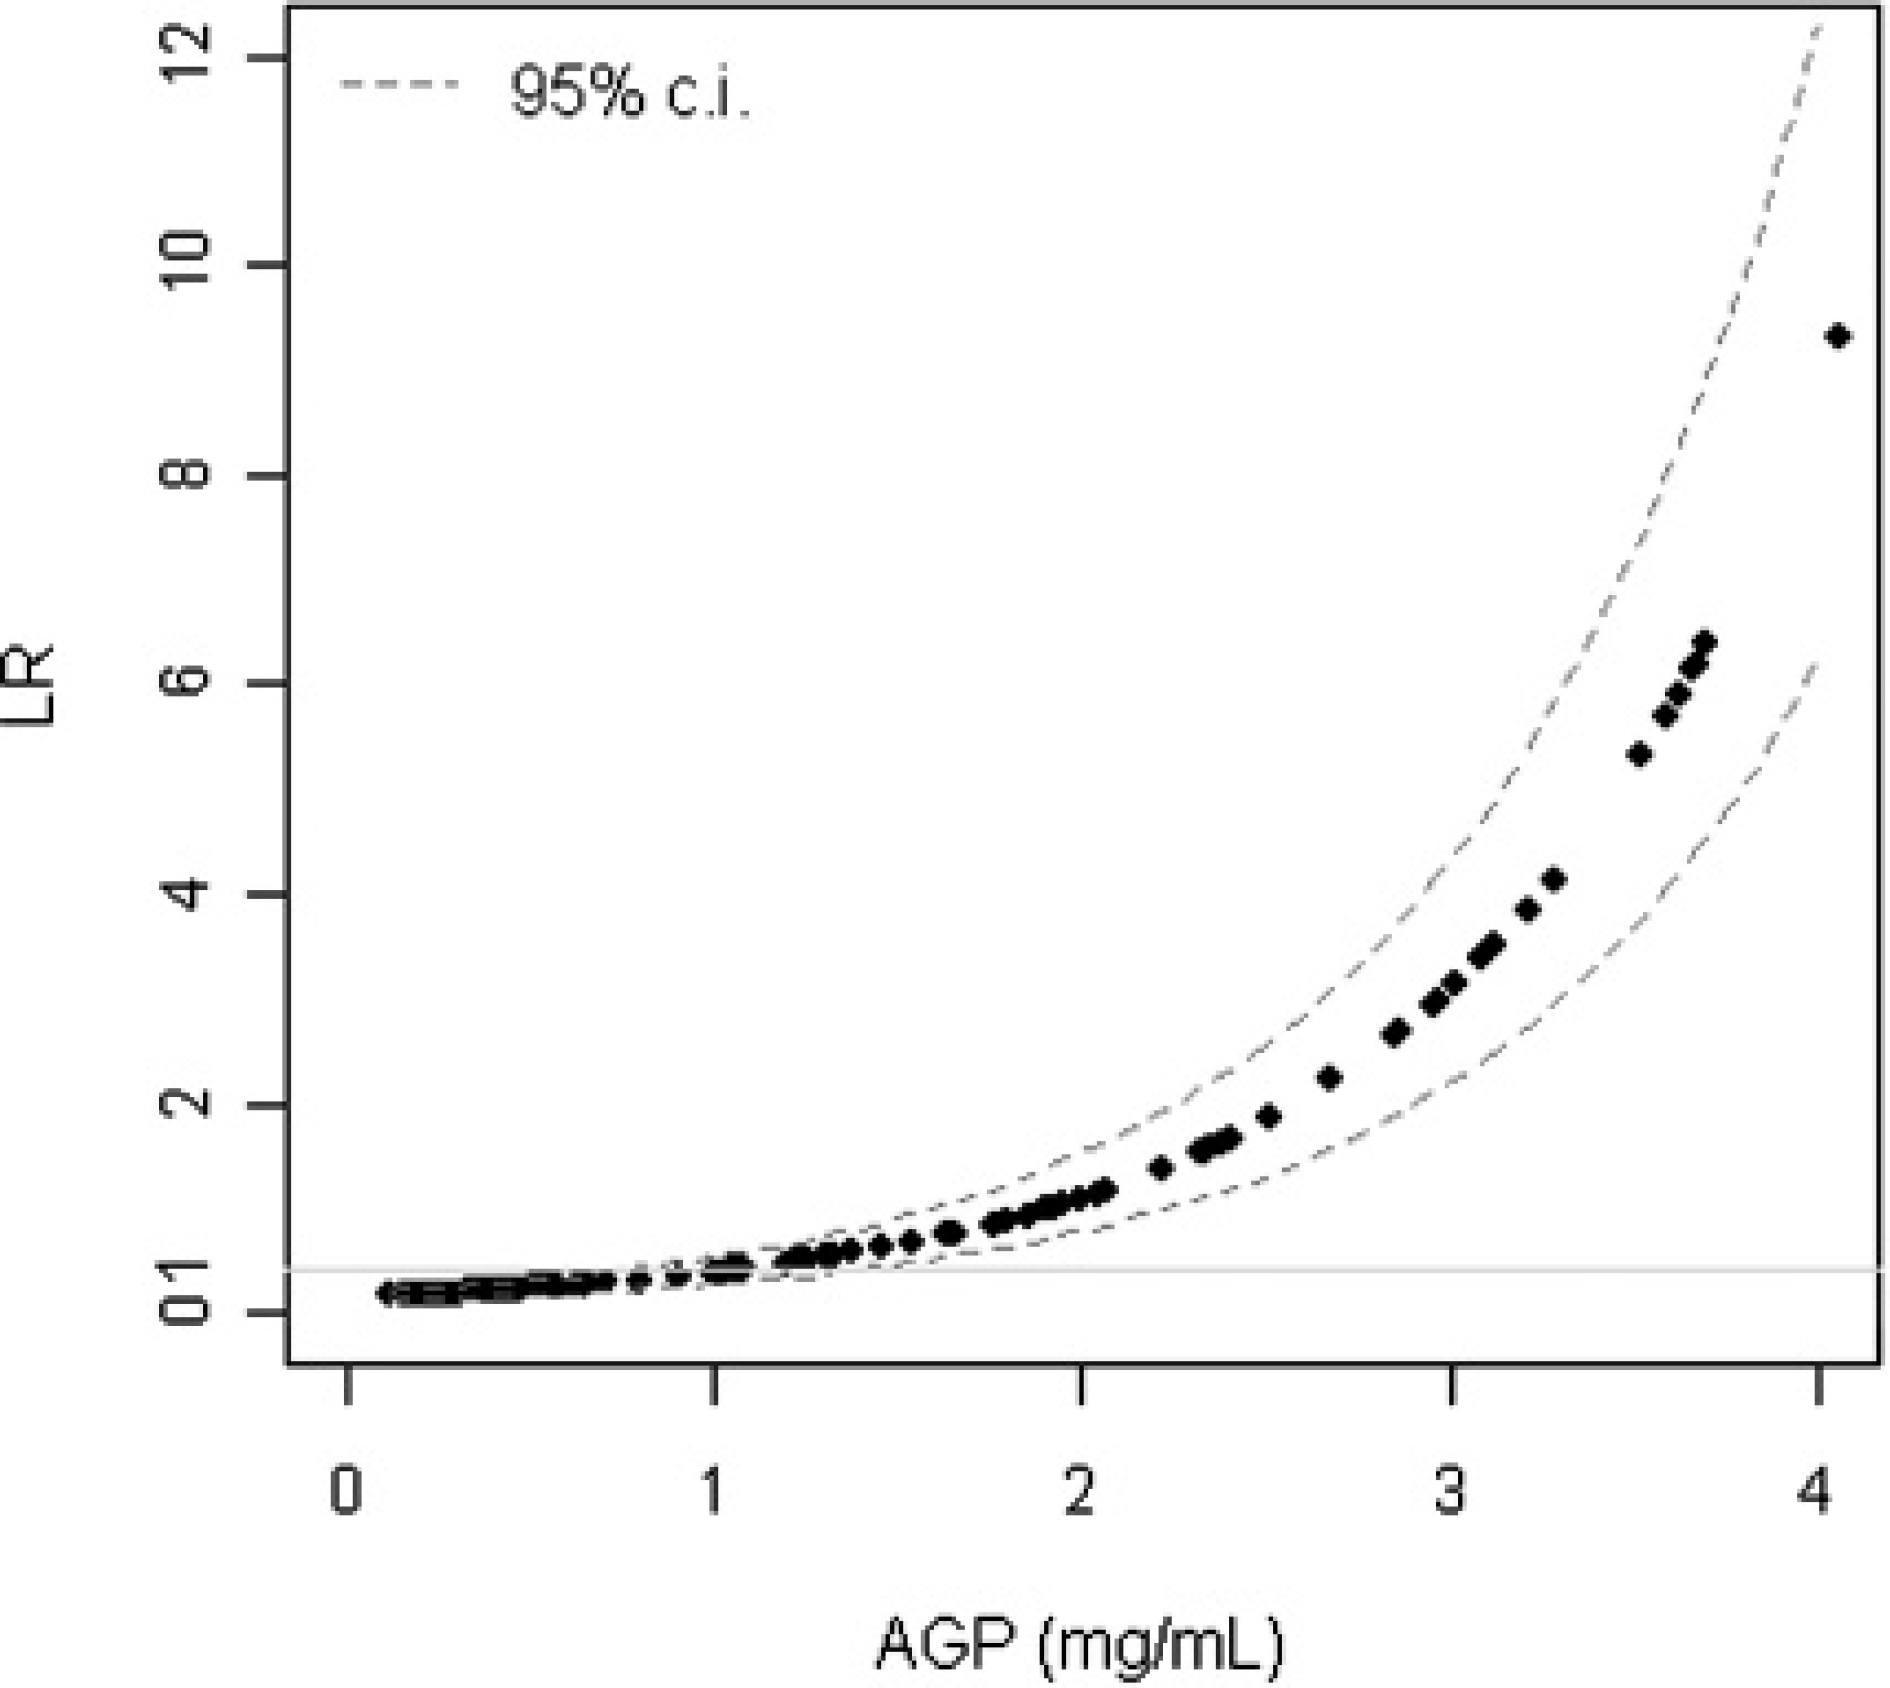
Continuous likelihood ratios for any given value of α1-acid glycoprotein.
Serum AGP is currently used in many veterinary laboratories as an adjunct to the diagnosis of FIP, but it can increase in other pathophysiological conditions. 5 , 6 , 9 , 13 For this reason, in the present study, serum AGP levels from cats with a confirmed diagnosis of FIP were compared with serum AGP levels from negative controls (group 2d, clinically healthy, recently vaccinated cats, and group 2e, SPF cats) and a number of positive controls (group 2a, FIP-negative cats with a variety of pathophysiological or pathological conditions; group 2b, asymptomatic FCoV-positive cats; and group 2c, injection-site sarcoma-positive cats). The criteria characterizing each group have previously been reported to cause increases of serum AGP associated with stimulation of innate immunity (groups 2c and 2d) 4 or to have a signalment and history (group 2b) and/or clinical signs (group 2a) that might generate clinical suspicion of FIP. The retrospective evaluation of routinely collected AGP serum levels might be characterized by a selection bias of cats with FIP. However, AGP was measured also when the pretest probability of FIP was low. Thus, it is very unlikely that cats with minimal clinical signs suggestive of FIP might have been excluded from the study. On the contrary, cats with other diseases but potentially characterized by high AGP levels might have not been included in the study. From a practical standpoint, however, this seems a minor problem since in most cases, the clinical workup rarely needs the support of serum AGP measurement.
Group comparison confirmed that the antemortem diagnosis of FIP can be difficult since clinical signs consistent with FIP were found both in FIP-positive cats from group 1 and in cats with a wide range of other clinical conditions (group 2a). This problem is amplified by the relative lack of specificity of most laboratory tests used to support a diagnosis of FIP. 16 , 23 These results confirmed that a clinical suspicion of FIP can be supported only by analysis of effusions and by histology/immunohistochemistry. 3 These data also confirm previous reports 17 , 19 that FCoV serology is not diagnostic for FIP since some of the cats in this study with confirmed FIP were seronegative for FCoV antibodies, while many others were asymptomatic but FCoV antibody positive (group 2b, n = 49). For these reasons, a surrogate marker of FIP, such as serum AGP, 6 would be clinically useful in FIP diagnosis. The comparison of the results from the different groups demonstrated that most of the cats from group 2 had serum AGP values close to or higher than the previously reported cut-offs for FIP. 6 In a previous study, 6 it was reported that FIV infection also might induce elevation in serum AGP concentration. The FIV status of cats included in groups 2a and 2c has not been assessed; it is thus possible that some of the cats with high serum AGP levels were affected by FIV. Nevertheless, median serum AGP levels were statistically higher in cats with FIP than in other groups, confirming the association between serum AGP concentration and FIP disease status.

Posttest probability of feline infectious peritonitis as a function of α1-acid glycoprotein values and pretest probabilities. Four possible scenarios have been hypothesized: pretest probabilty of 1% (
The ROC curve AUC analysis demonstrated that serum AGP concentration has a good discriminating power for FIP. In practical terms, however, some of this power might be lost by the necessary choice of an arbitrary cut-off value with this method, which dichotomizes patients and results in loss of diagnostic information. By contrast, when Bayesian methods are used to interpret the test results, 2 , 20 , 23 both the pretest probability of disease and the LRs associated with each laboratory result are taken into account. Since pretest probabilities are usually arbitrarily determined by the clinicians based on historical and clinical information, the clinician's judgment forms a basis for the interpretation of test results. The pretest probability can then be used with LRs to calculate the posttest probability using the Bayes formula, as explained in this article. However, a simplification of the original method may be used to calculate the Odds pretest [pretest probabilty/(1 - pretest probabilty)], then the Odds posttest (Odds pretest × LR), and finally the posttest probability [Odds posttest/(1 + Odds posttest)]. The LR for any given serum AGP concentration can be obtained from Fig. 2. Calculation of the Odds posttest for FIP based on the pretest probability of disease shows that when the pretest probability is low, the posttest probability of FIP remains low even for high serum AGP levels. When the pretest probability is medium, the posttest probability of FIP is high only in the case of high serum AGP levels. When the pretest probability is high, the posttest probability is high even for low serum AGP levels. Therefore, the same serum AGP value (e.g., 1.5 or 2 mg/ml) might be highly consistent with FIP in cats from groups 1 or 2a but not in cats from other groups, for which a clinical diagnosis of FIP might be supported only by high serum AGP values (e.g., >3 mg/ml or even >5 mg/ml). Values >5 mg/ml are rarely recorded, even in cats with a confirmed diagnosis of FIP.
Posttest probability of FIP at different AGP levels in 4 hypothetical scenarios characterized by different pretest probabilities of FIP.*
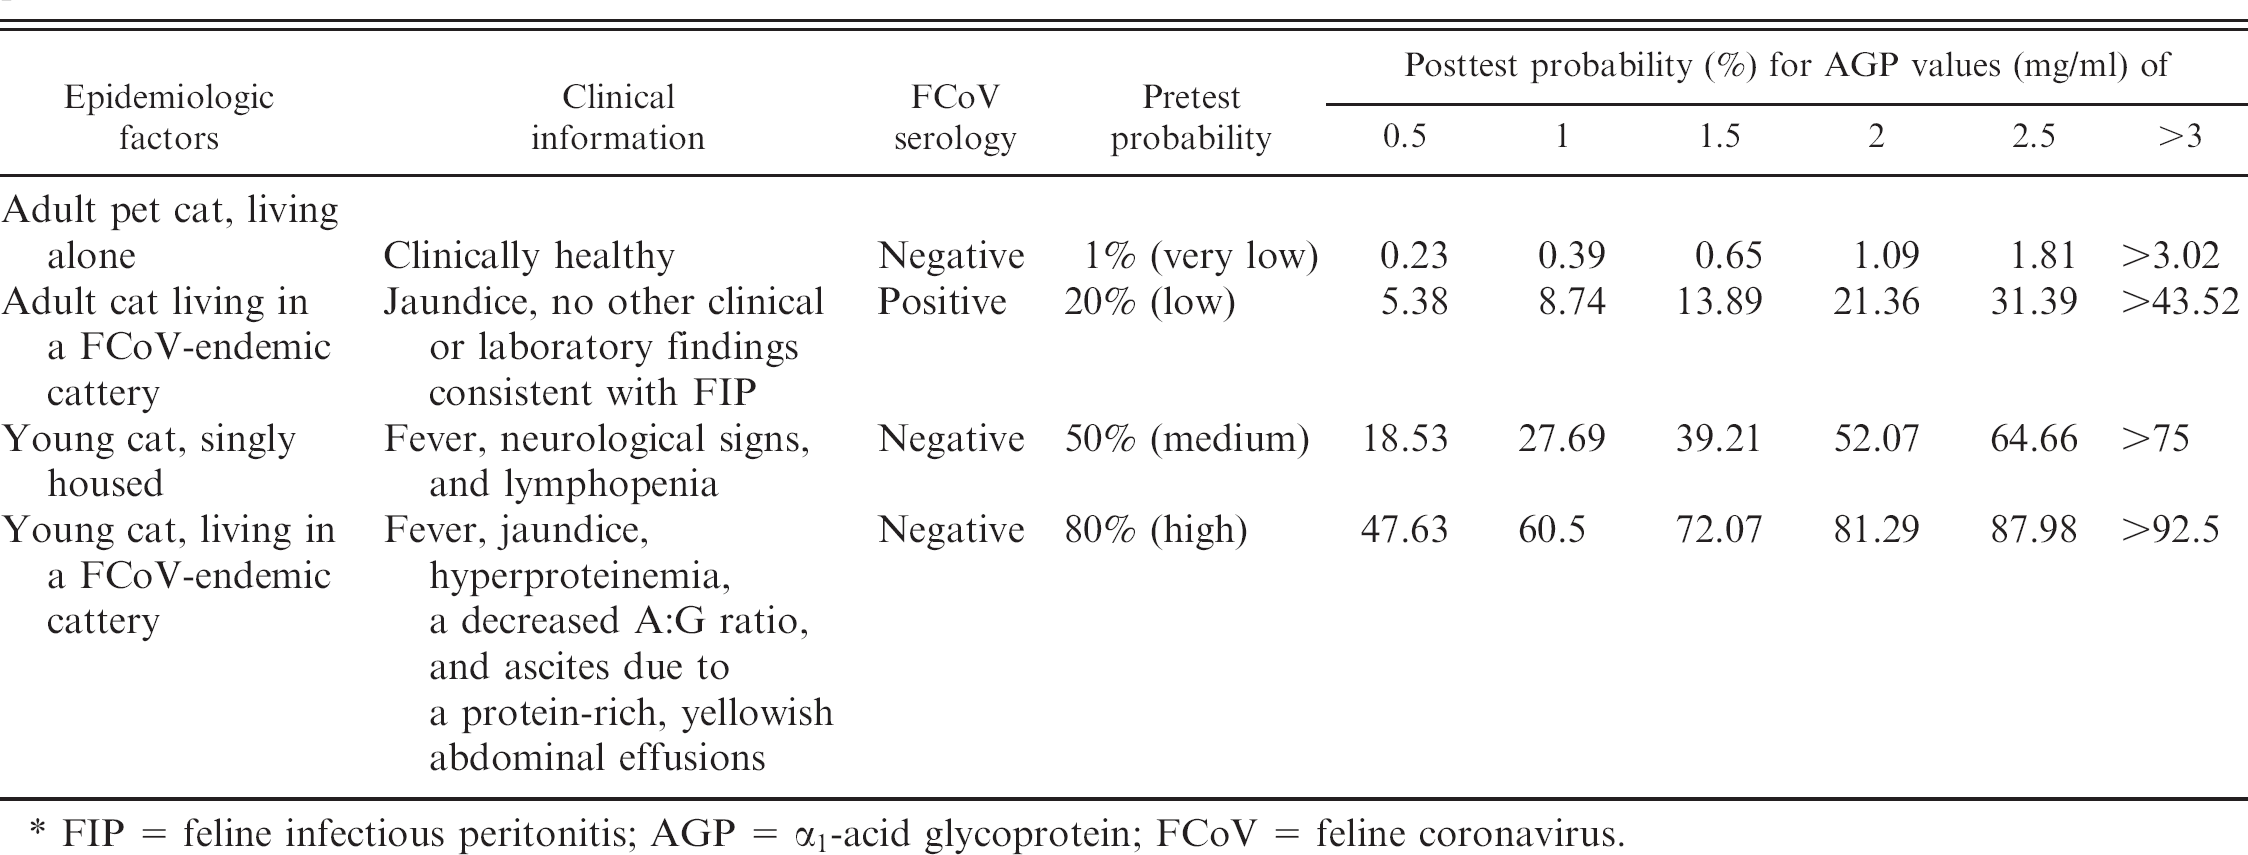
FIP = feline infectious peritonitis; AGP = α1-acid glycoprotein; FCoV = feline Coronavirus.
In conclusion, serum AGP levels recorded in groups of cats with different pretest probabilities of FIP demonstrated that serum AGP can be used as a discriminating marker for FIP. Pretest probability should be ranked based on epidemiological and clinico-pathological data (very low, low, medium, high) and used with continuous LRs (Fig. 3) to estimate the posttest probability of FIP. Specifically, when the pretest probability of FIP is high, moderate serum AGP increases are useful to discriminate cats with FIP from others, while only high serum concentrations of AGP can support a diagnosis of FIP in cats with a low pretest probability.
Acknowledgements
This study was funded by the grant Fondo Interno per la Ricerca Scientifica e Tecnologica (F.I.R.S.T.) of the University of Milan (Via Festa del Perdono 7, 20100 Milan, Italy).
Footnotes
a.
Tridelta Ltd, Bray (County Wicklow), Ireland.
b.
Feligen CRP, Virbac, Carros Cedex, France.