
Abstract
To quantify the sensitivity and specificity of a serum enzyme-linked immunosorbent assay (ELISA) and fecal culture (FC) tests and to estimate the prevalence of Johne's disease (JD) in New Zealand dairy herds using Bayesian methods, 4 New Zealand dairy herds were tested simultaneously by ELISA and FC 5 times over 3 lactations. Test results were dichotomized. A Bayesian regression model was developed that considered test sensitivity as a function of the covariates parity, lactation stage, and prevalence of JD, which is expected to vary between herds. It was applied to a cross-sectional subset of the data and the full, repeated measures data set. Results were compared with frequentist pseudo gold standard results of the full data. Using the regression model, sensitivity of the ELISA was higher in older animals, but the sensitivity of the FC test showed no trend across age groups. Both FC and ELISA sensitivity were lower in late lactation. Estimated prevalence was lower and FC sensitivity higher when analyzing the complete data. The regression model enabled a more accurate diagnosis of JD to be made because it incorporated cow-specific information in the diagnosis, such as age and lactation stage. The model also enabled the incorporation of previous test results for an individual when diagnosing disease. The trends in results from the regression model support the current understanding of the disease process. The advantage of repeated testing of individuals in the assessment of test performance is discussed in the current study.
Introduction
Johne's disease (JD), caused by Mycobacterium avium subspecies paratuberculosis (MAP) is a chronic enteritis of ruminant species. It is of particular importance in intensive livestock industries including the dairy industry. In cattle, the disease is characterized by infection during calfhood followed by a variable latent period, often of several years. Progressive disease usually follows, demonstrated by worsening diarrhea, weight loss, and a sharp drop in milk production. 6 The disease has no treatment and is normally fatal. The latent period of infection is a contributing factor in the poor sensitivity of diagnostic tests for JD. It has led to the commonly held dogma that for every cow with clinical signs of JD born in the herd, there are probably 15–20 subclinically infected herd mates. 36
A substantial research effort has been dedicated to the improvement and validation of diagnostic tests for JD. 2,7,9,15,23,24,26,27,31,32 Research has focused on the tests most commonly used: the enzyme-linked immunosorbent assay (ELISA) for serum antibody and culture of MAP from the feces. However, 2 challenges to evaluating diagnostic tests for JD exist that cannot easily be overcome by sampling methods or laboratory technology.
The first challenge is the absence of a gold standard (i.e., the true infection status of a tested individual remains unknown). Postmortem examination is currently the most accurate method of determining infection status, but it is seldom feasible to conduct postmortem examinations on the large number of trial animals required to validate the results of a diagnostic test. As a result, misclassification rates of JD tests under field conditions remain difficult to determine. One possible, but time-consuming and expensive, alternative is to test an animal for JD throughout its lifetime, which allows infection status to be estimated with greater certainty. ELISA test performance has previously been validated against the fecal culture (FC) test in lieu of a gold standard. 9,10,34 Since FC has imperfect sensitivity and specificity, this procedure gives biased estimates of ELISA sensitivity and specificity.
The second challenge is that test sensitivity varies with severity of the disease and with lactation stage. 25 In general, it is rare for an antibody response or fecal shedding of MAP to be detectable in the early, preclinical state of disease. During more advanced and clinical states of disease, animals develop high levels of antibody and shed large numbers of MAP in their feces. Reports of sensitivity for the antibody ELISA test ranged from 15.4% to 88.1% and were positively correlated with the progression of disease. 11
Bayesian probability models are well suited to address diagnostic test evaluation, and there is a growing body of research in veterinary science describing their application. Initially, a previous study 20 developed a Bayesian approach to the model described by Hui and Walter in a previous study 19 in which the performance of 2 independent diagnostic tests was estimated in the absence of a gold standard, using 2 populations each with a distinct prevalence. Subsequently, 2 approaches were developed to adjust for dependence in the 2-test model, one in 2001 12 and another in 2003. 3,17
A Bayesian regression model for estimating the performance of diagnostic tests that incorporates cow-level covariates parity and lactation stage, and allows test performance to vary as a function of these covariates, is presented in the current study. The model was applied to both cross-sectional and repeat measure data. Results from a pseudo gold standard (PGS) approach are also presented for comparison.
Materials and methods
Study herds
A longitudinal population study was conducted using a convenience sample of 4 dairy herds with a history of clinical JD in the Manawatu district of North Island, New Zealand (40° 19′ north and 175° 30′ east). The herds were coded A-D. Herd managers consented to a request for participation, and the herds were considered typical examples of New Zealand's seasonal calving, pasture-based dairy production system.
Data collection
The data were collected from October 2000 to October 2002. Unique animal identification was possible using the dairy herd improvement (DHI)-type monitoring services provided by Livestock Improvement Corporation. Herds were tested for JD twice per milking season, once in early lactation (October) and again in late lactation (May). Three herds were tested 5 times, and 1 herd was tested 3 times during the study.
At each herd visit, a sample of whole blood was taken by caudal venipuncture and a fecal sample collected. The simultaneous collection of a blood sample and fecal sample was defined as a single test-event. All milking cows in herds A-C were sampled at each visit. These herds milked approximately 100 cows. In herd D, which milked about 500 cows, samples were collected from a subset of approximately 100 cows. When culled, members of this subset were replaced with herd mates by random selection within age group, so that the age distribution of the sampled fraction continued to represent that of the entire herd.
Serology was conducted by a commercial veterinary laboratory using a commercial Johne's absorbed ELISA kit with an absorption step using soluble M. phlei antigen, an in-house antigen, and a single cut-off value recommended by the kit. a The antigen preparation methodology has been previously described. 29 In brief, a New Zealand isolate of the M. avium complex, not containing IS 900 (Wag 1001), M. avium strain 18, formerly identified as M. paratuberculosis, 5 and M. paratuberculosis Teps were used for antigen production. Bacteria were grown on modified Watson-Reid medium and washed in distilled water by centrifugation prior to disruption by sonication and further centrifugation. Culture of feces was conducted by AgRe-search Wallaceville Animal Research Centre (Upper Hutt, New Zealand) using the technique described in a previous study. 8
Data structure
The data had a hierarchical structure with 3 levels. The uppermost level was herd, followed by individual cow, and the lowest level was test-event repeated within cow. A subset of the data was taken to create a cross-sectional data set, which contained only the first test event (simultaneous ELISA and FC) for each cow.
Methods for evaluating the performance of diagnostic tests
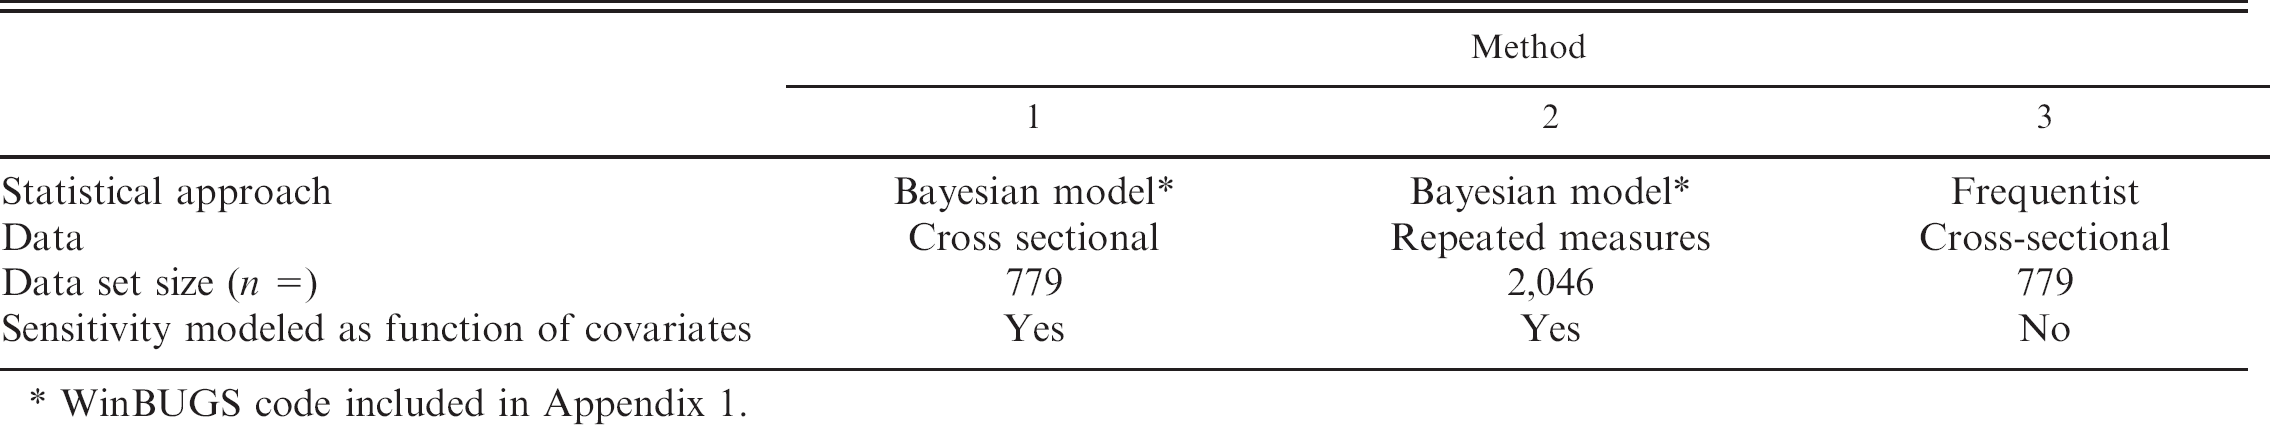
A summary of the 3 methods used is presented in Table 1. A detailed description of each method follows.
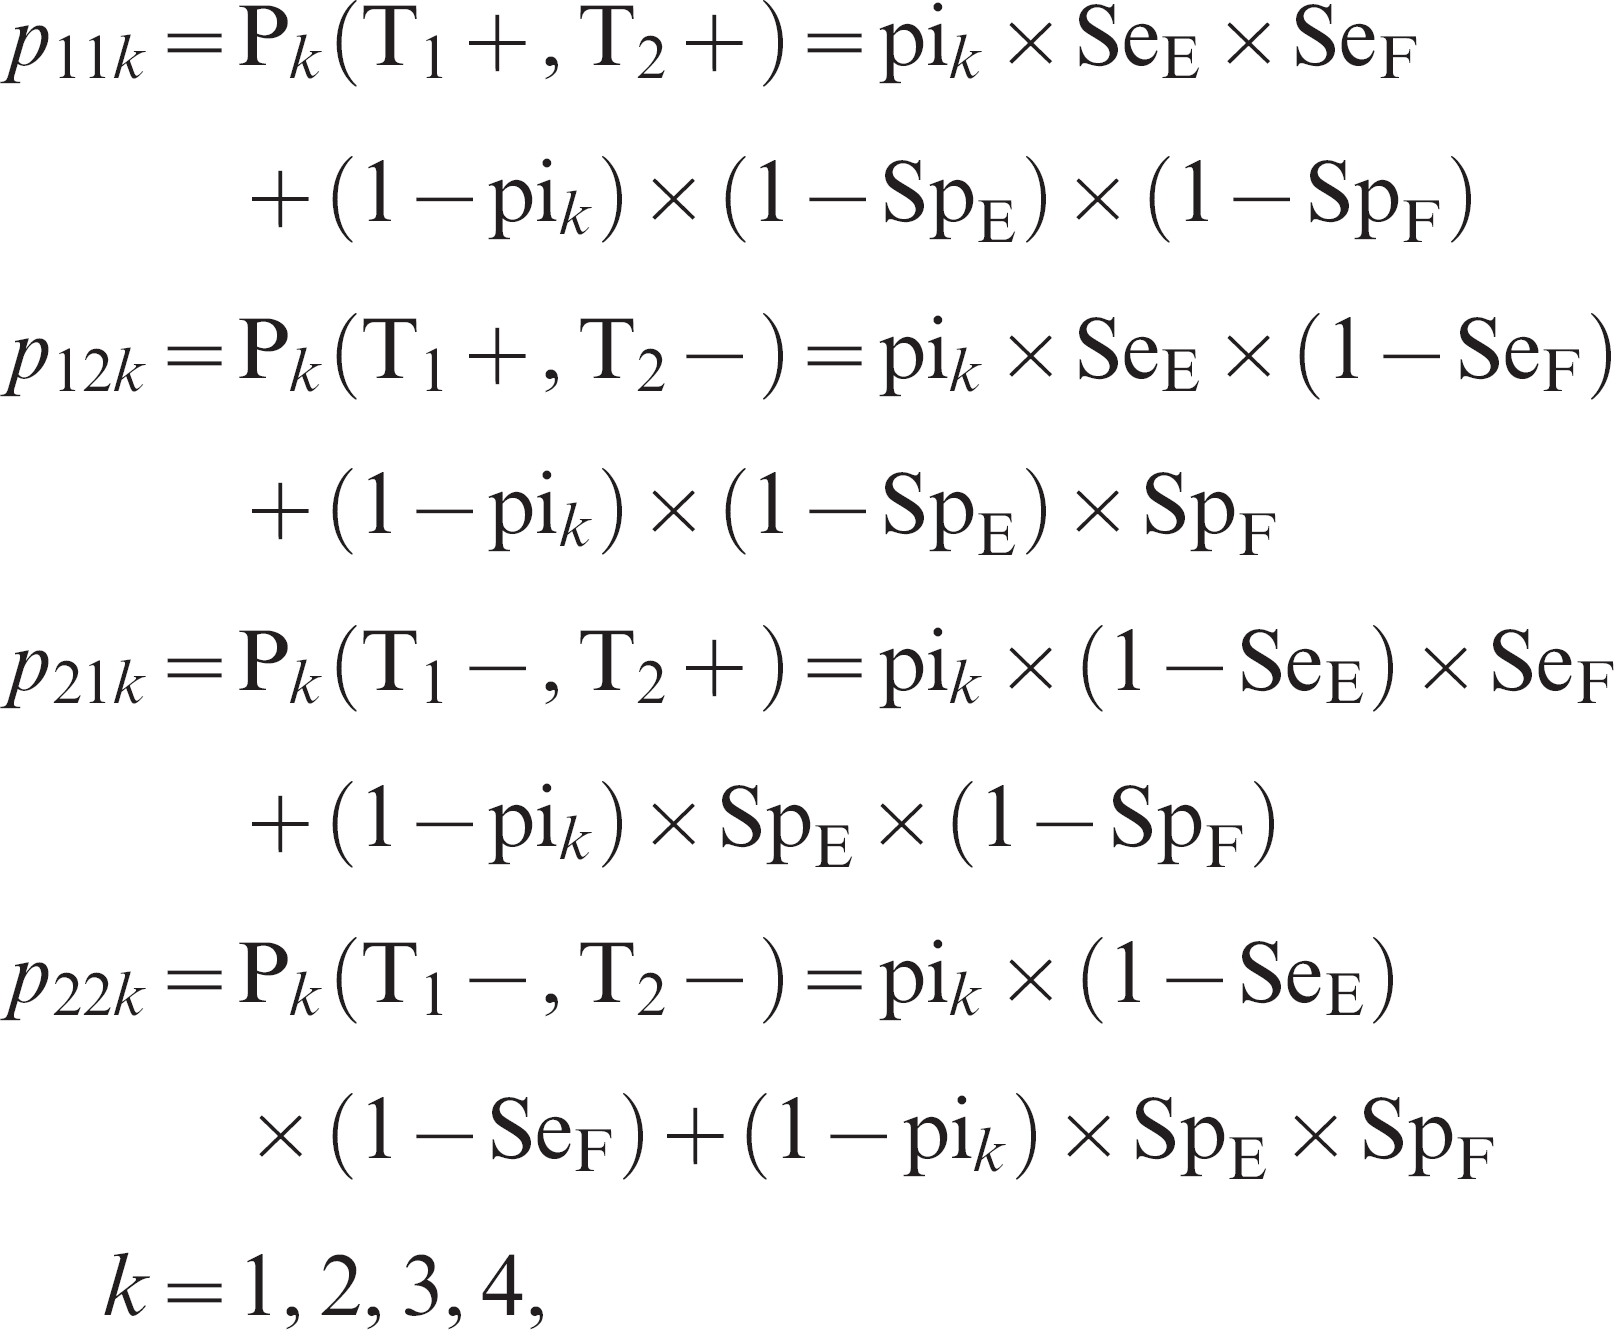
Method 1: Cross-sectional. In the Hui and Walter model, 19 the data are assumed to come from at least 2 distinct populations, each with a distinct prevalence. In the current case, the populations were the 4 herds. Test accuracy was assumed to be constant across populations. The data then consist of a 2 × 2 contingency table for each population (Table 2). The cell counts corresponding to the ith row and jth column for population k are modeled with independent multinomial distributions, where

and
Description of statistical methods used to evaluate the performance of the enzyme-linked immunosorbent assay and fecal culture tests for Johne's disease.
WinBUGS code included in Appendix 1.
where SeE = ELISA sensitivity, SeF = FC sensitivity, SpE = ELISA specificity, SpF = FC specificity, T1 = ELISA, T2 = FC, and pi k = prevalence in population k.
This approach can be extended to include covariate effects on sensitivities and/or specificities by allowing these parameters to be functions of the covariates. Equation 1 is then replaced by a cow-level equivalent, where the diagnostic test outcome for ELISA and FC (p 11 [+, +], p 12 [+, −], p 21 [−, +], or p 22 [−, −]) for cow j is multinomial with n = 1 and corresponding probabilities:
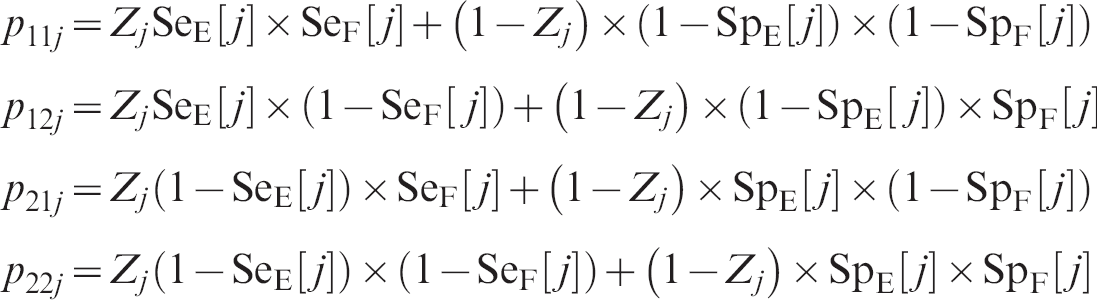
and the infection status Z j of cow j has a Bernoulli distribution (i.e., if cow j is from herd k then P(Zj = 1) = pi k ).
In this analysis, the average of the individual sensitivities SeE[j] and SeF[j] was monitored to give estimates of overall sensitivity for each test, but the sensitivity of each test was also modeled as a function of the covariates parity and lactation stage. The prevalence, on the other hand, was modeled only as a function of herd. It was assumed that the 2 tests were conditionally independent given the disease status of the animal and that test specificity would not vary as a function of covariates.
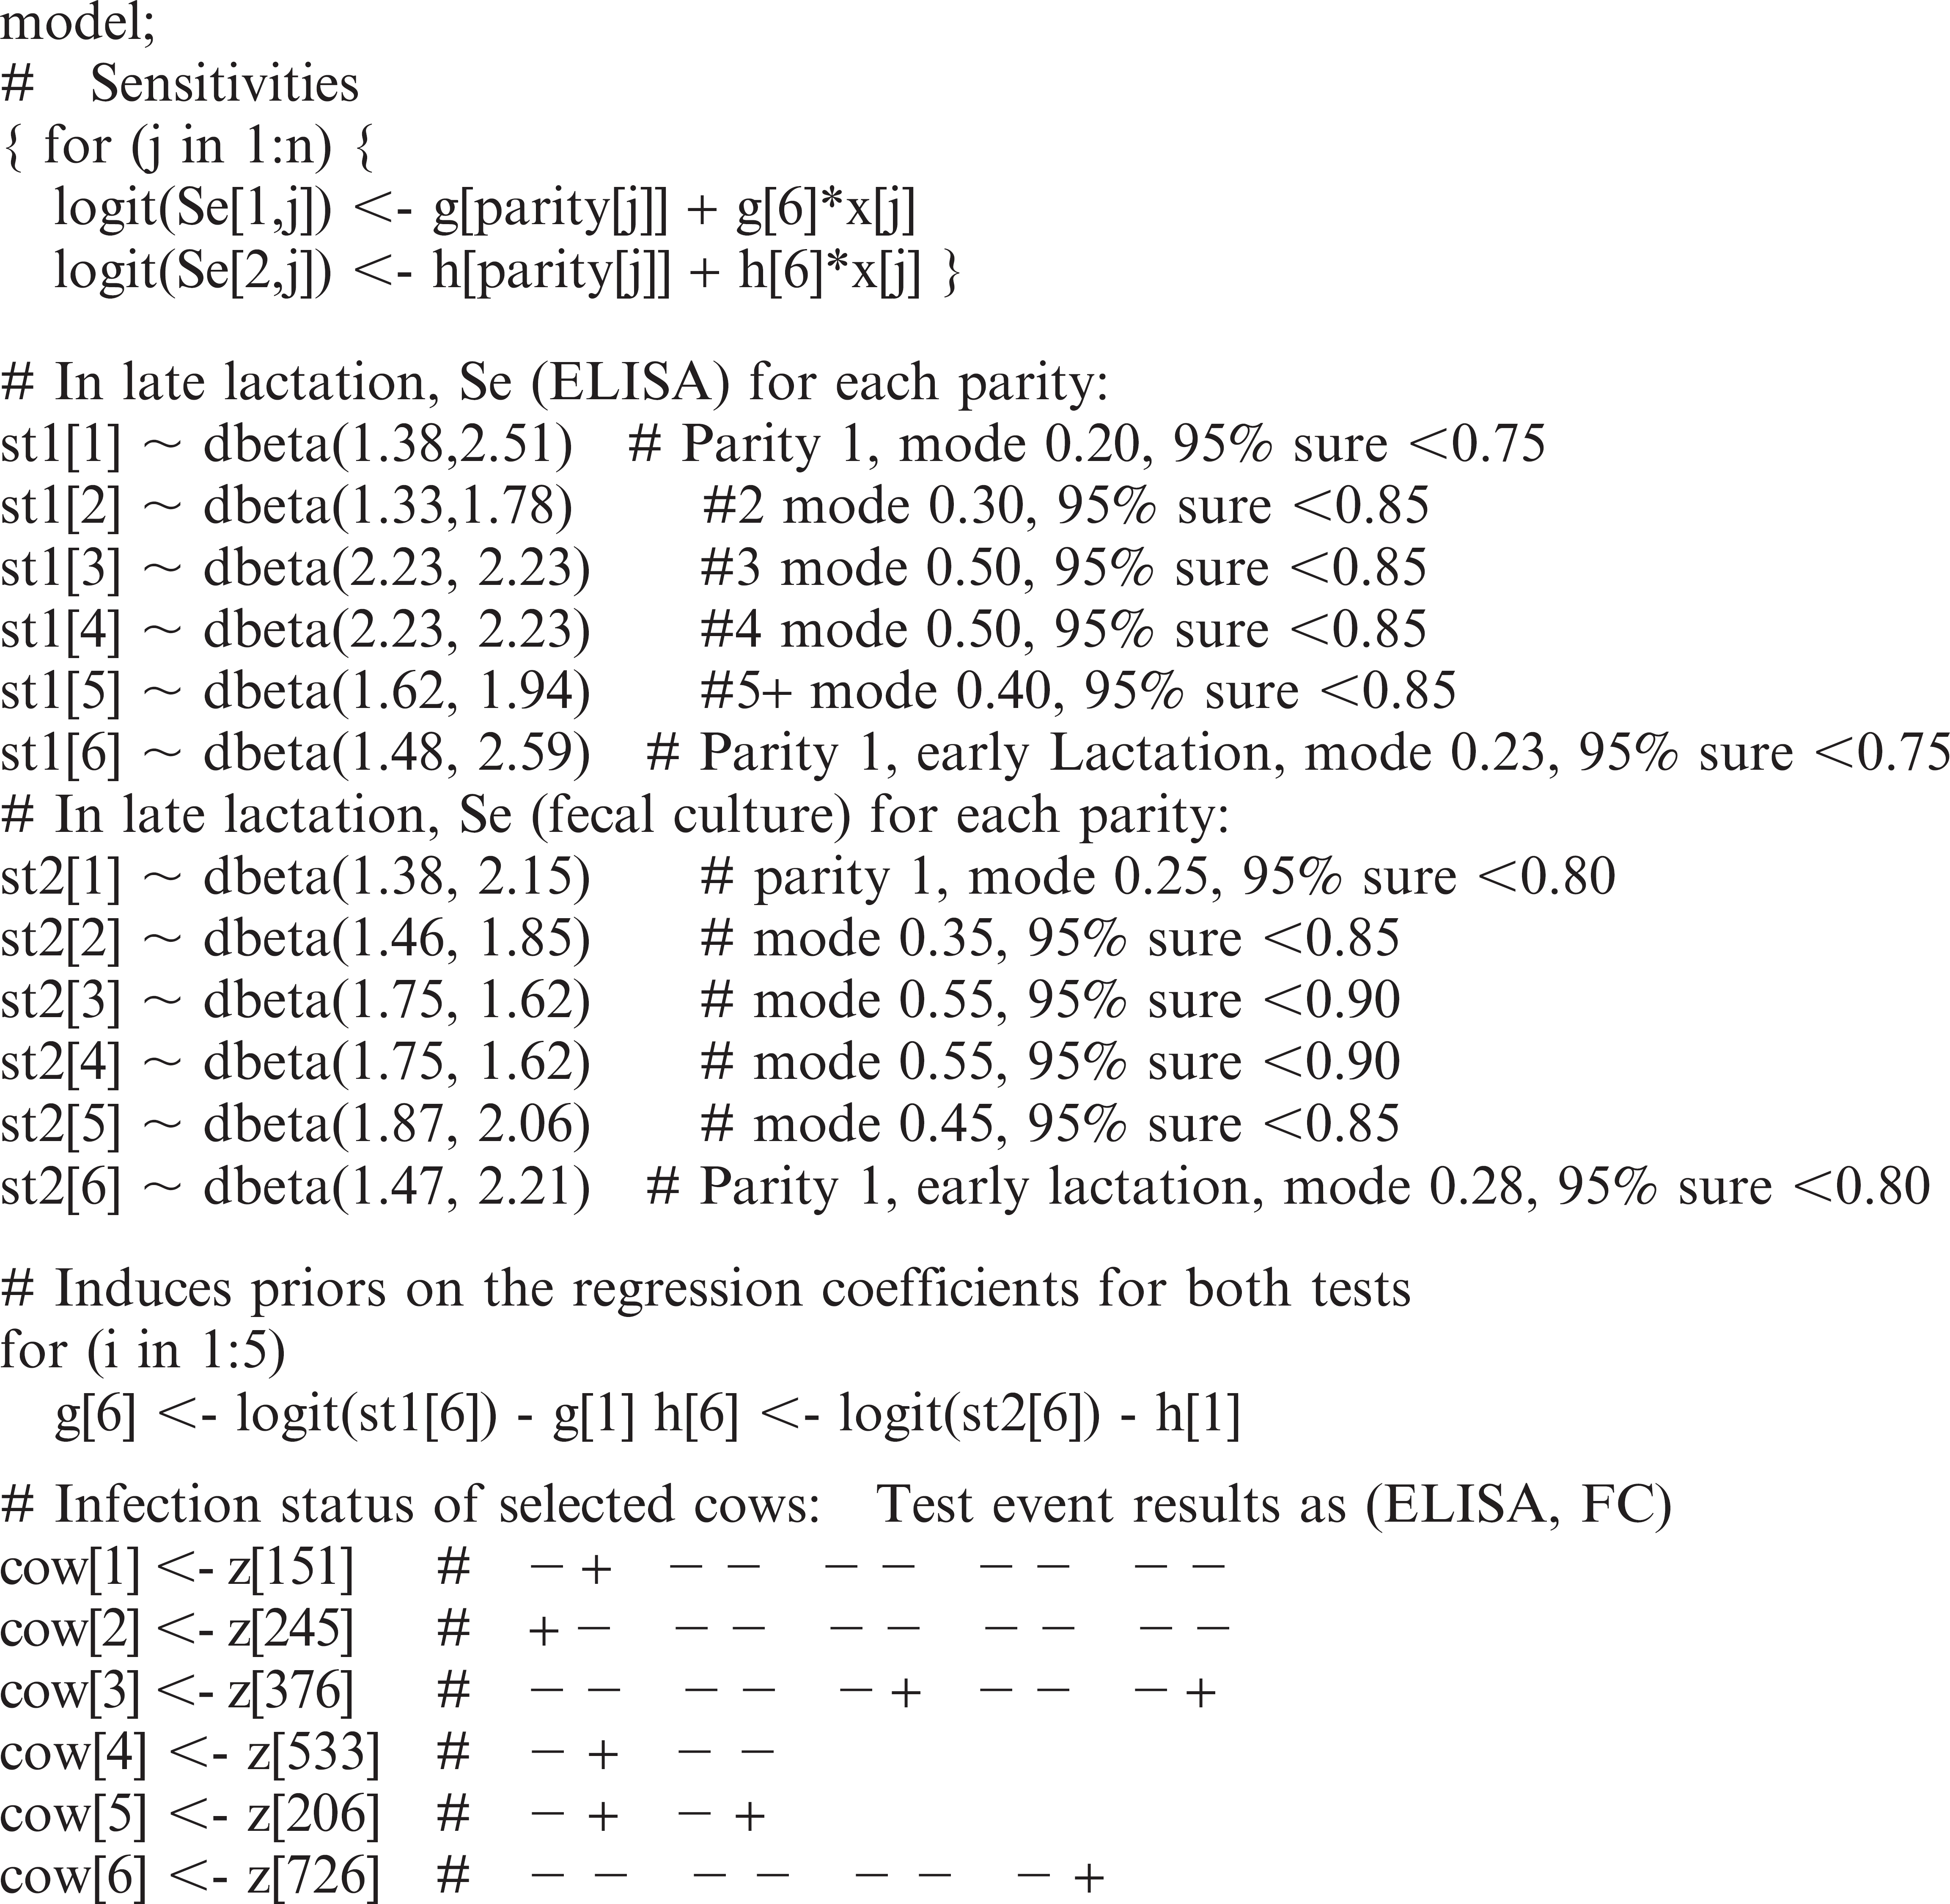
Sensitivity of the ELISA and the FC test were subsequently modeled on the logit scale for each cow. The covariate parity, categorized as 1, 2, 3, 4, and >4, was included as a proxy for age. The covariate lactation stage was categorized as either early or late. It was included to represent stress levels on the cow associated with parturition and the beginning of lactation. The sensitivities for each test and cow were modeled as
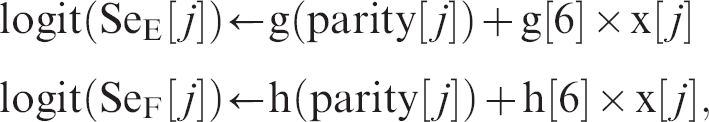
where j denotes the jth cow in the data, parity[j] its parity, and x[j] its lactation stage. In this parameterization, 6 coefficients are used; 1 for the sensitivity at each parity level, in late lactation, and 1 for the effect of lactation stage (Table 3). An informative prior was used for the regression coefficients based on a previously described technique. 1 This technique requires provision of scientific input that is independent of the data about the sensitivity of each test under 6 different parity and lactation stage combinations. For example, in the current study, for a cow in parity 1 and late lactation, the best prior estimate of ELISA sensitivity was 20%, with 95% certainty that it was less than 75%. On the other hand, the best guess for the sensitivity for a late-lactation cow in parity 4 was 50%, with 95% certainty that it was less than 85%, so it was believed there might be a 30% increase in sensitivity for parity 4 over parity 1 in late-lactation cows. Please note that a great deal of uncertainty was attached to these estimates. Observe that, with this parameterization, the effect on sensitivity associated with changing from early to late lactation was modeled to be the same, on the logit scale, across all parities.
Cross-tabulated results for an enzyme-linked immunosorbent assay (ELISA) and fecal culture (FC) test applied to 779 dairy cows from 4 New Zealand dairy herds.*
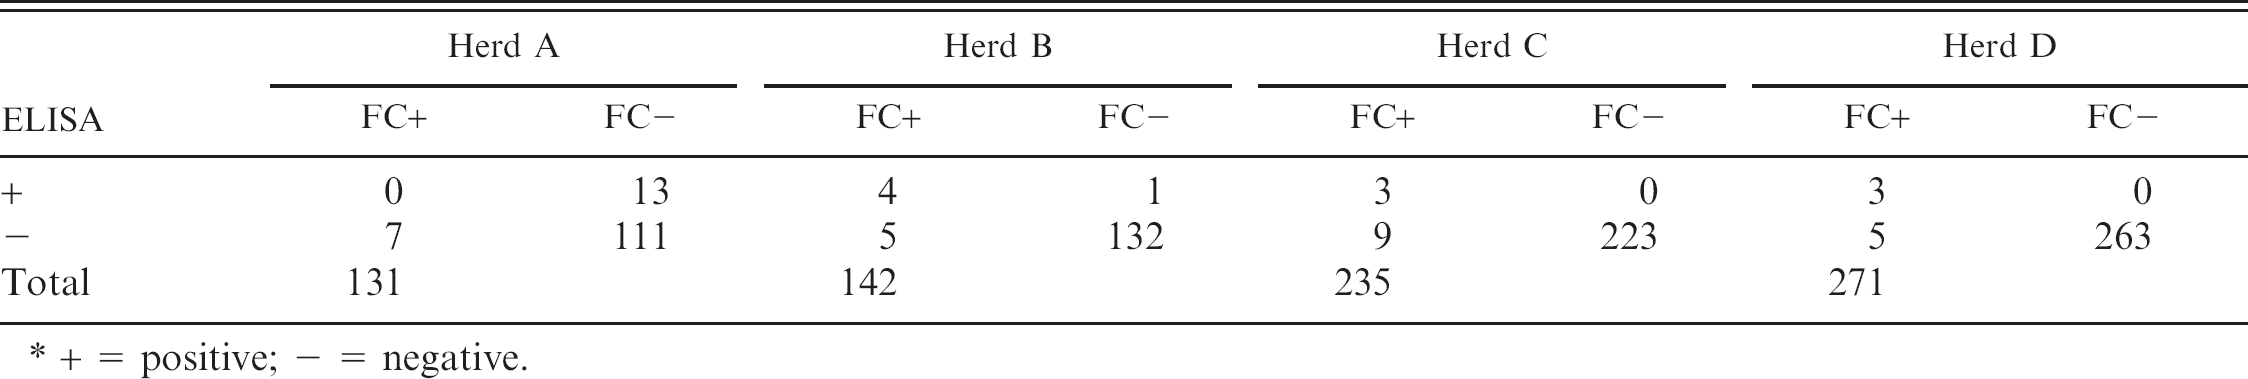
+ = positive; − = negative.
Prior information for the sensitivity of the enzyme-linked immunosorbent assay (ELISA) and fecal culture (FC) test for Johne's disease at each parity, for early and late lactation, and for herd level prevalence.
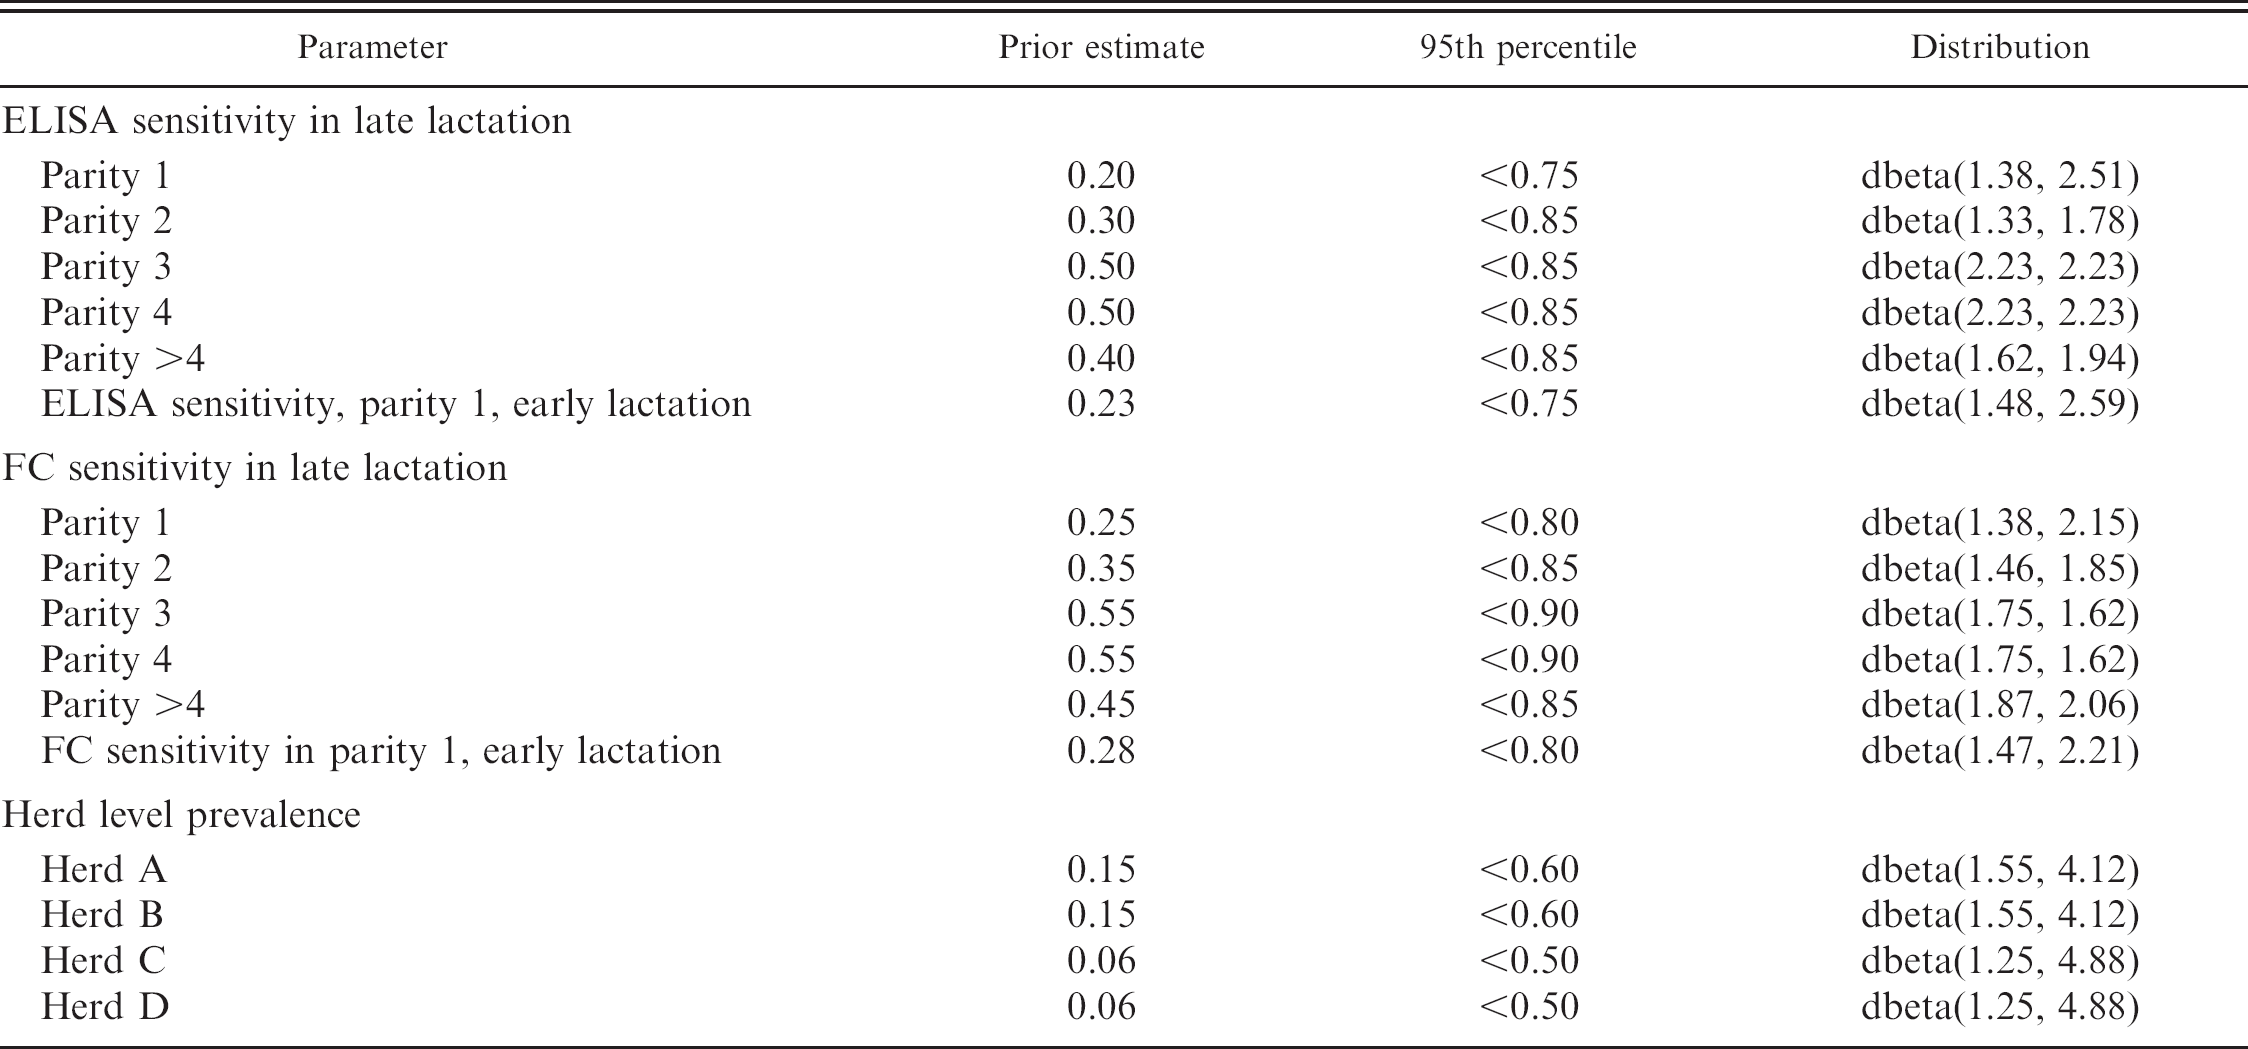
Priors describing ELISA sensitivity in different parity groups were represented by only slightly informative beta distributions after considering previous studies. 14,15,18,36 Priors for FC sensitivity were assigned similarly but reflected the assumption that it is more sensitive than the ELISA, based on a study occurring under dairying conditions similar to those used in New Zealand. 14 The prior for the effect on sensitivity of lactation stage reflected the belief that sensitivity would be slightly higher in early lactation, due to the heightened stress associated with parturition and the onset of lactation.
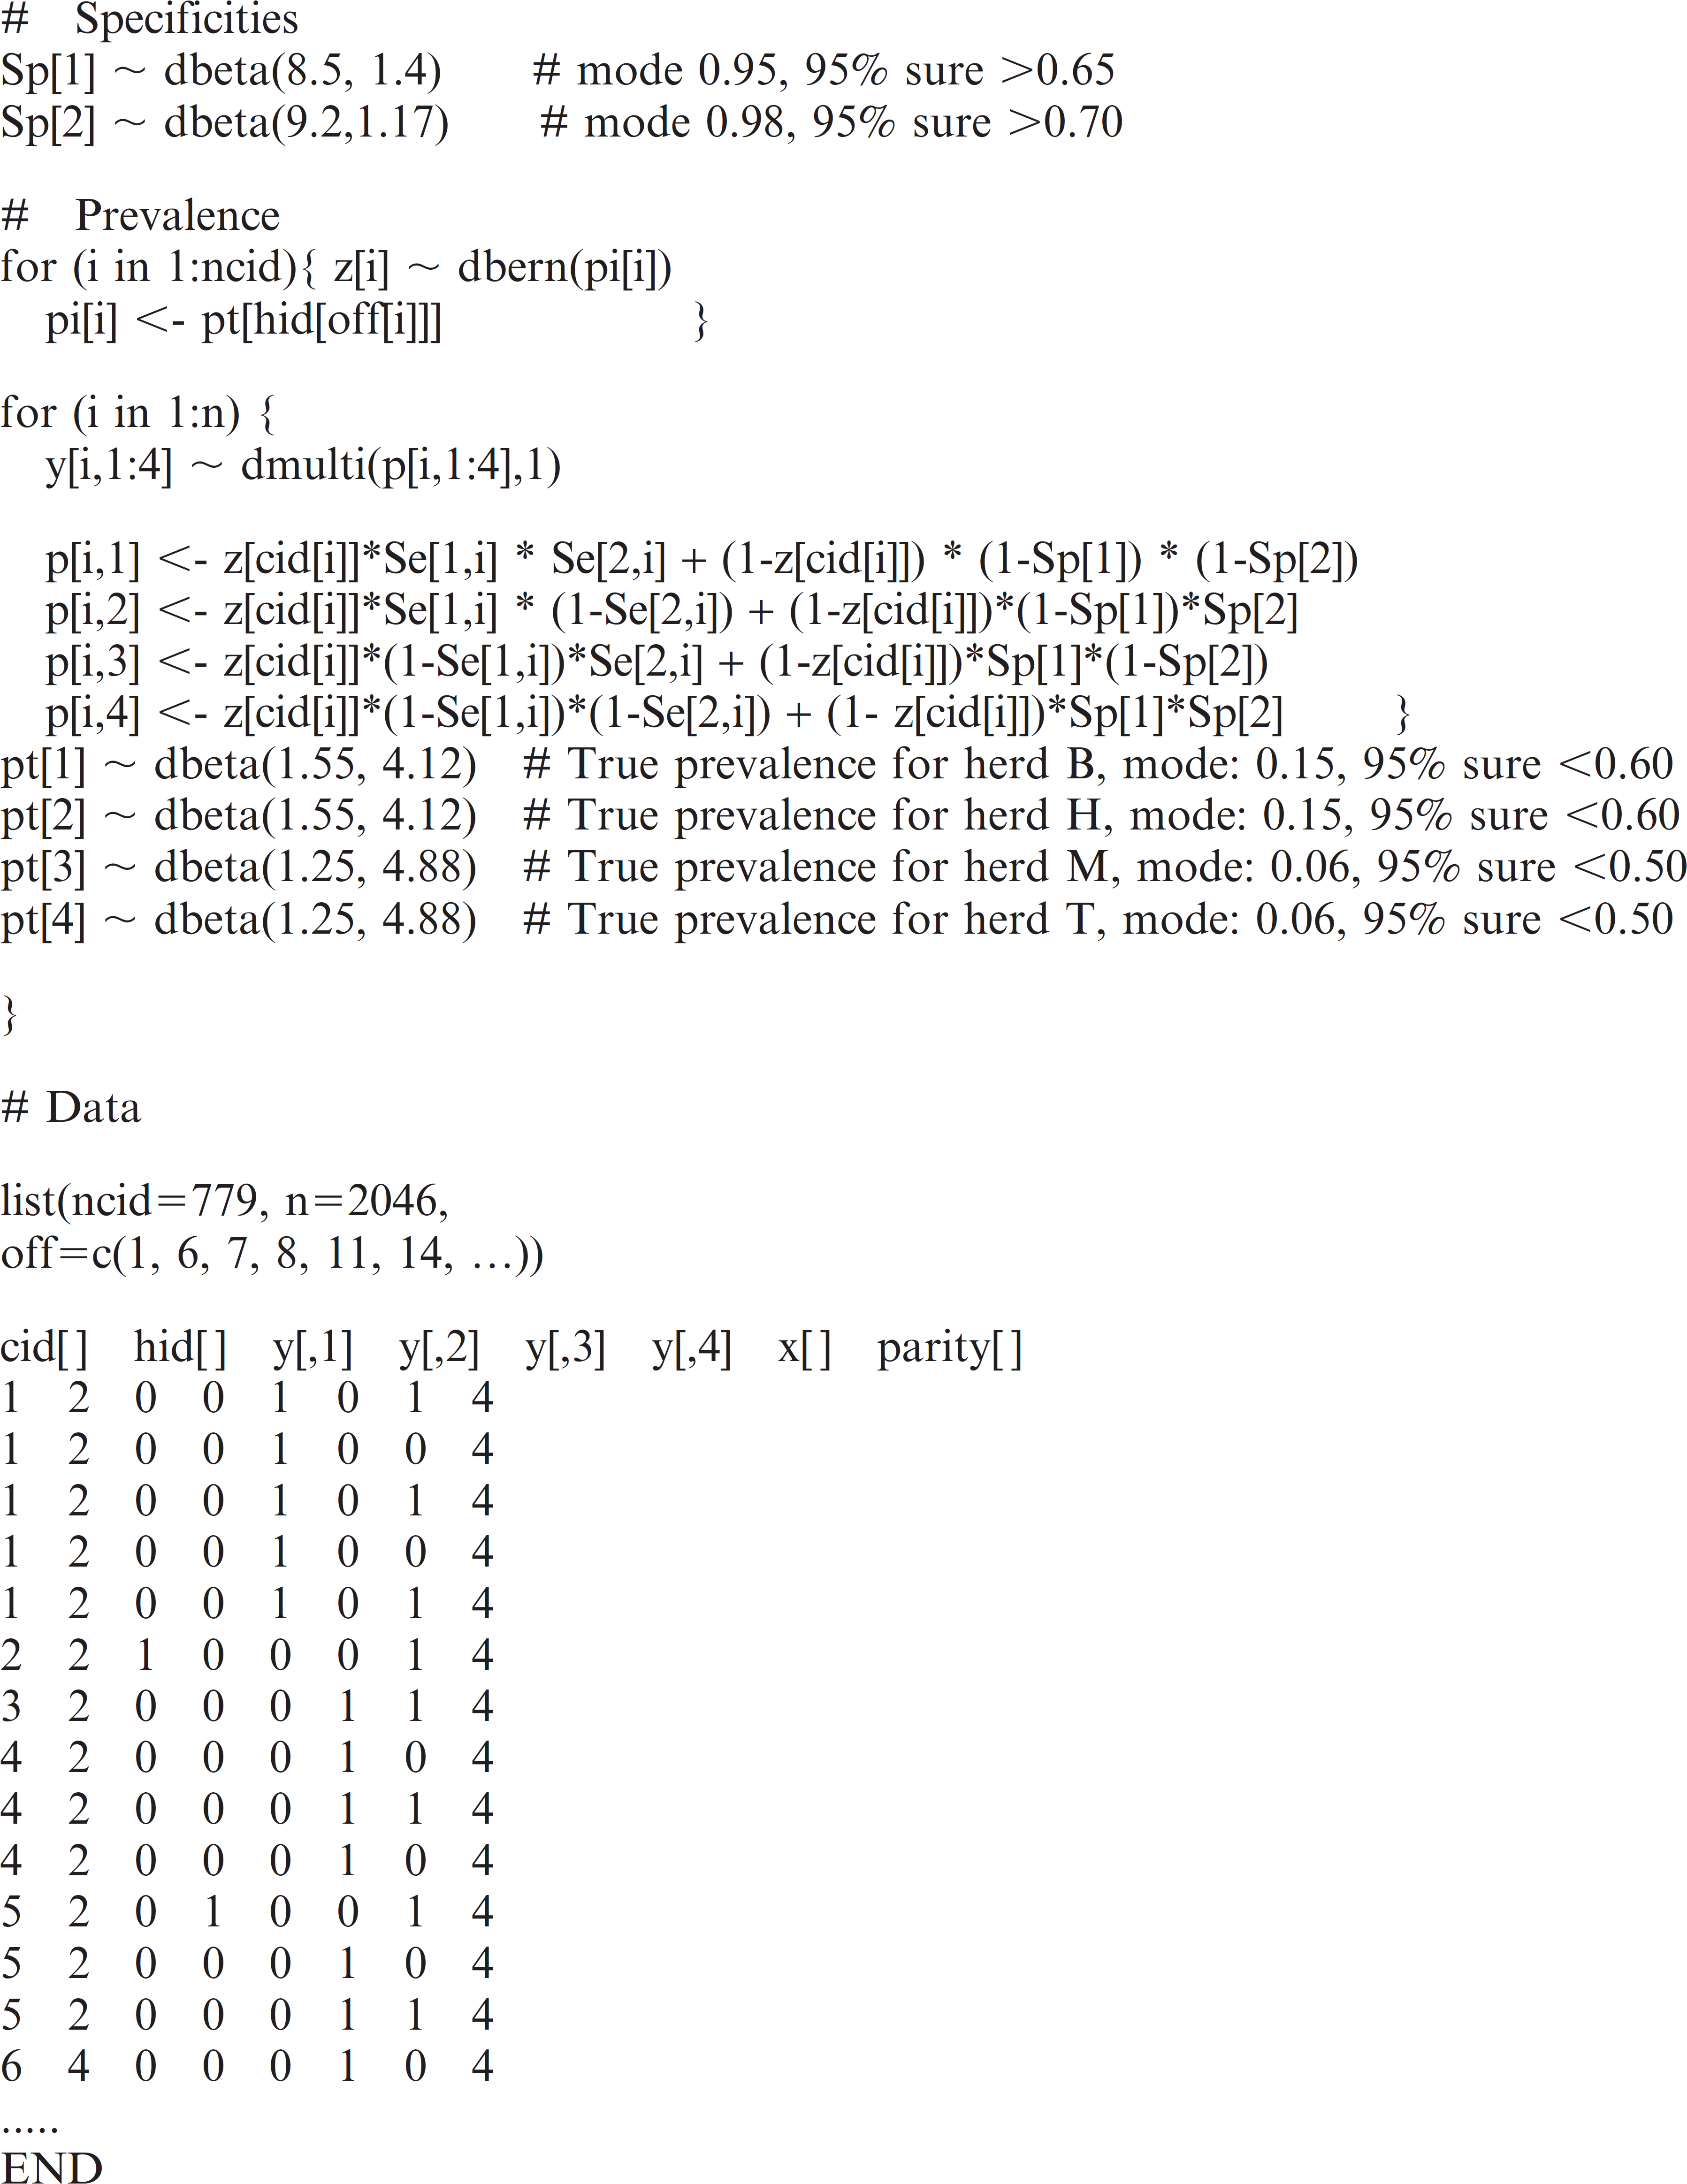
The prior estimate for ELISA specificity was determined after reviewing available literature 4,6,18,29,31,36 to be 0.95 (and 95% confident that it was greater than 0.65). Fecal culture specificity was 0.98 (and 95% confident that it was greater than 0.70).
Beta distributions used to describe the prevalence in each herd are given in Table 3. Information on the within-herd prevalence was obtained before data collection based on the farmers' perception of the annual incidence of clinical cases of JD.
Method 2: Repeated test events (complete data). In using the complete data, multiple test events for each cow (repeated measures) are available. Thus the formulae in Equation 2 now apply at the test event level, rather than the cow level, since a particular cow's covariate values will change over time. Because test events were repeated at 5- to 7-month intervals, it was assumed that observations on the same cow would be “practically” independent, conditional on disease status.
Taking j now to denote the test event rather than the cow, the outcome for test event j is modeled as a multinomial with n = 1 and corresponding probabilities:
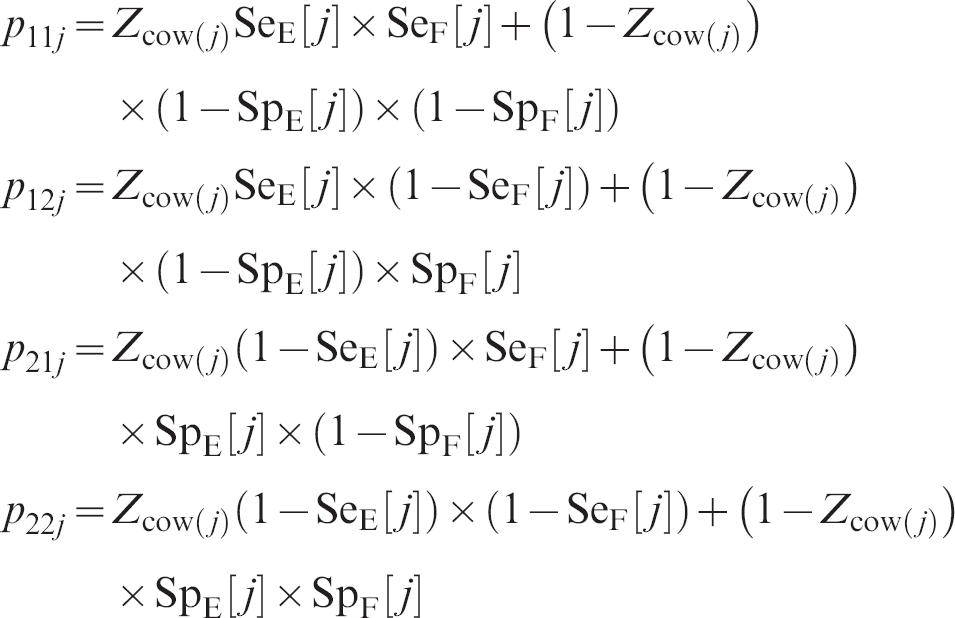
Recall that the disease status of an individual is presumed to be constant during the study period. Z cow(j) represents the infection status of the cow tested in event j; this will be fixed (1 for infected, 0 for noninfected) for all test events on a particular cow. As before, it was assumed that Z cow(j) has a Bernoulli distribution with probability pi k , where k denotes the herd to which this cow belongs. The WinBUGS code is given in Appendix 1. Note that the sensitivities and specificities are now allowed to vary for each cow across test events because lactation stage and parity vary with time.
Method 3: Pseudo gold standard. A PGS was created in which any cow with a positive test at any time during the follow-up period was considered infected with JD. The prevalence was defined for each herd as the proportion of cows that had a positive test of either type at any time divided by the total number of cows present during the period that herd was observed.
Descriptive information for study farms and diagnostic testing.
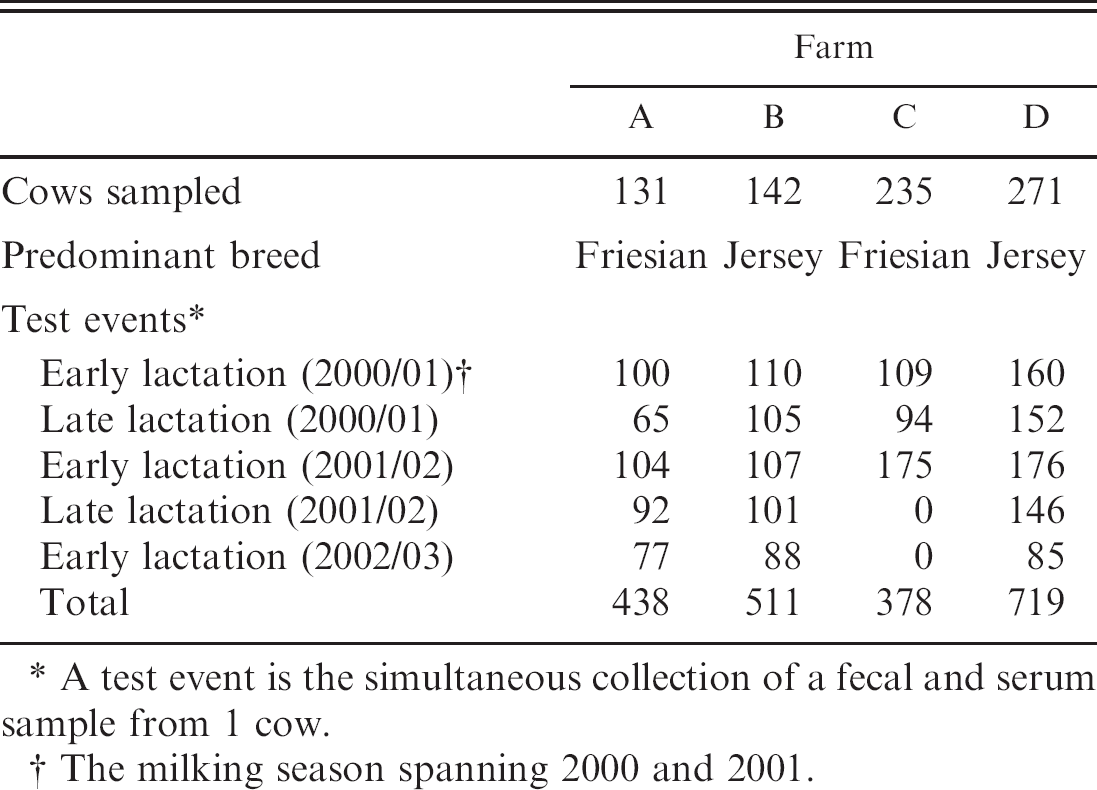
A test event is the simultaneous collection of a fecal and serum sample from 1 cow.
The milking season spanning 2000 and 2001.
The ELISA sensitivity was calculated using only the first ELISA for each cow. The number of positive tests in this group was divided by the number of cows that were positive to either test at any point during the study to give ELISA sensitivity. A similar approach was used to determine the sensitivity of FC, using only the first culture result for each cow. Non-Bayesian confidence intervals were calculated using standard methods based on binomial proportions. By definition of this method, specificities were assumed to be perfect. The covariance and confidence interval for the covariance between ELISA and FC test results within the infected population was estimated using a formula from a previous study. 16
Assessment of convergence and sensitivity analysis
The models for methods 1 and 2 were run for 100,000 iterations after discarding an initial 5,000 as a burn-in period. Convergence to the posterior distribution was checked by monitoring 3 sets of starting values and the corresponding Brooks-Gelman-Rubin plots, in WinBUGS. Posterior distributions of interest were described using the median and 95% probability intervals. Sensitivity, specificity, and prevalence values were reported as percentages.
To ensure the models were stable, sensitivity analyses were conducted. The models were re-run after a single prior was changed within biologically sensible limits. This process was repeated for 4 priors in total: 2 for diagnostic test sensitivity, 1 for specificity, and 1 for JD prevalence.
Results
Summary of the data
A summary of the data is given in Table 4. In all, 779 cows were tested. For these cows, there were 2,046 test events, that is, when both ELISA and FC tests were used on the same animal simultaneously. Two hundred and fifty cows had 1 test event, 146 had 2 test events, 151 had 3 test events, 109 had 4 test events, and 123 had 5 test events. In herds A-D, there were 131, 142, 235, and 271 cows tested, respectively. Sixty-five cows had at least 1 positive test. Ninety-eight of 2,046 test events were positive for 1 or both tests.
Performance of the ELISA test
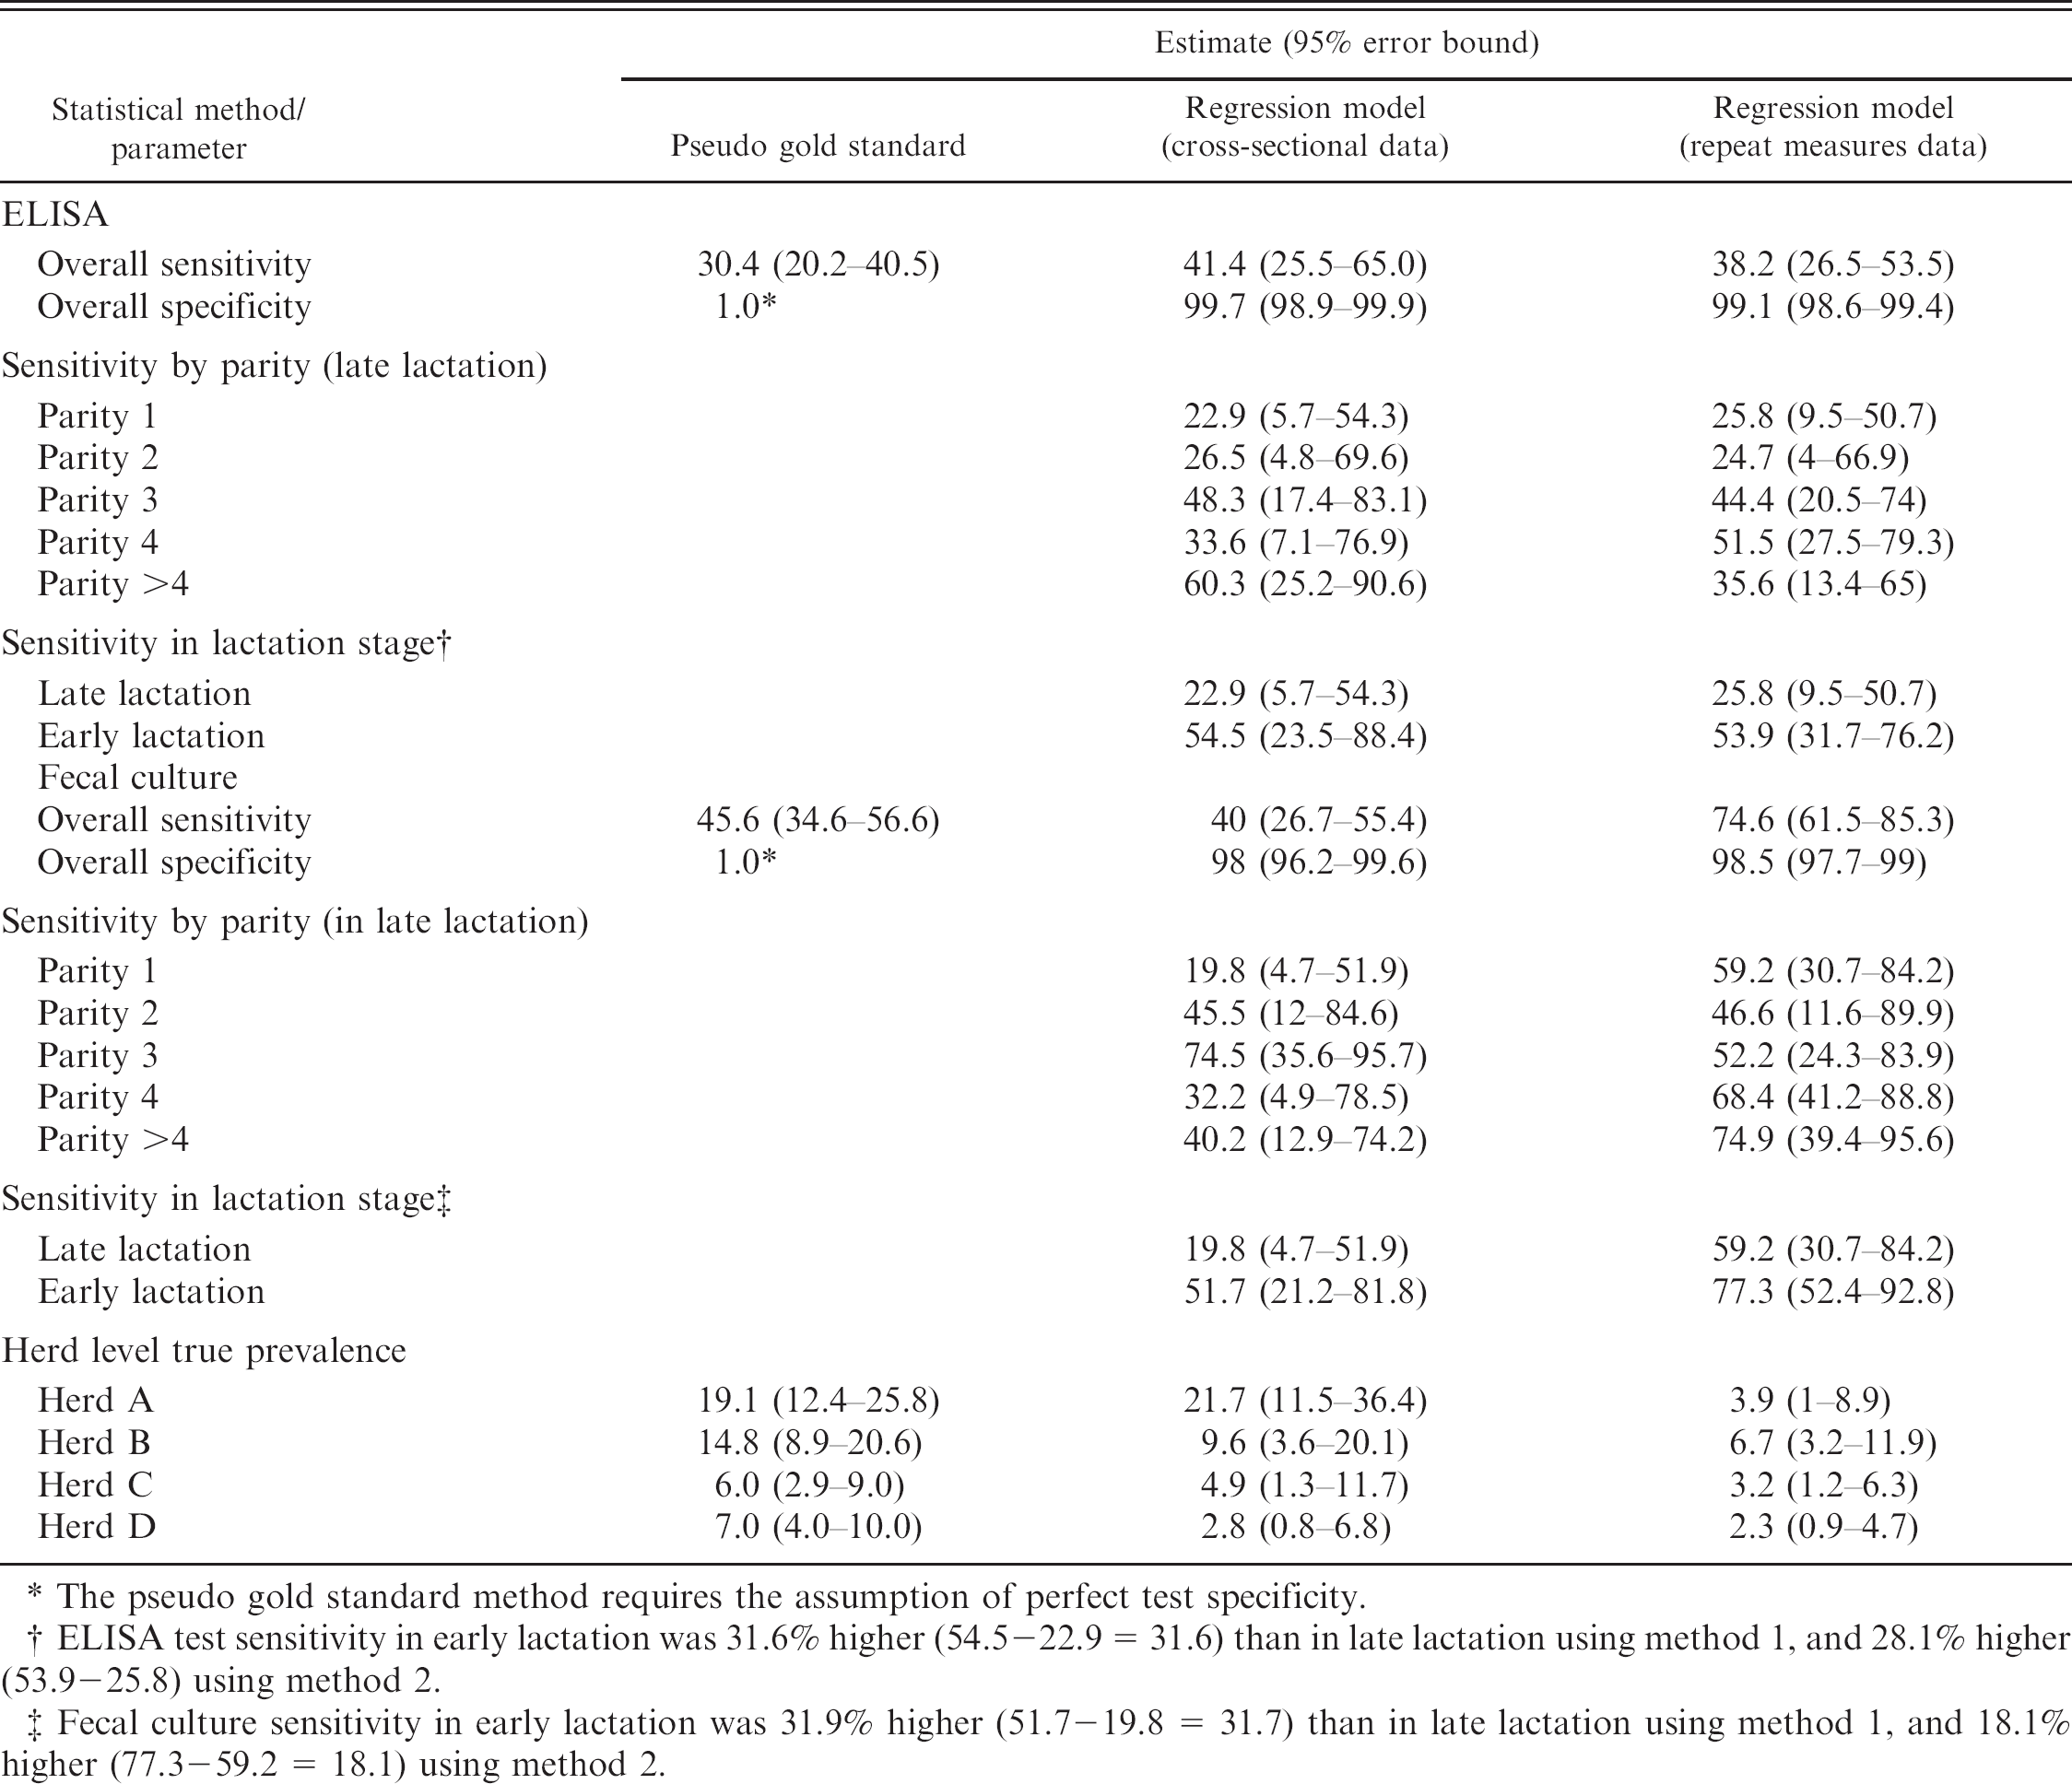
The point estimate for overall sensitivity of the ELISA (Table 5) was 38.2% using repeat measure data and 41.4% using cross-sectional data. The PGS method estimate was lower at 30.4%. The error bounds for each estimate were wide. Estimates of the specificity of the ELISA (Table 5) were similar when using cross-sectional data (97.7%) and repeat measure data (99.5%).
When considering ELISA sensitivity within covariate levels, the general trend was for sensitivity to be lowest in parities 1 and 2, and higher in parities 3 and above (Table 5). It was higher in early lactation than in late lactation, by a similar magnitude using cross-sectional data (increase of 31.6%) and repeat measure data (increase of 28.1%).
Performance of the fecal culture test
The point estimates for the overall sensitivity of the FC test (Table 5) was 40.4%, using cross-sectional data, and exceptionally high (74.6%), using repeat measure data. The PGS method estimate was 45.6%. Again, the error bounds for all estimates were wide. Estimates of the specificity were lower for the FC test (Table 5) than for the ELISA, at 98% (cross-sectional data) and 98.5% (repeat measure data), respectively.
No trend in the sensitivity of the FC test was evident across parity groups. It was higher in early lactation than in late lactation by 31.9% (cross-sectional data and 18.1% (repeat measure data). The error bounds associated with these estimates were wide (Table 5).
Prevalence
Estimates of the true herd-level prevalence (Table 5) varied in herd A, being 3.9% using repeat measure data, 21.7% using cross-sectional data, and 19.1% by the PGS method. In the other 3 herds, prevalence estimates were highest by the PGS method, which was to be expected as this method assumed no false-positive results occurred, and similar between the 2 Bayesian models.
Covariance between the ELISA and fecal culture test in the infected population
Covariance between the ELISA and FC test in the positive population was estimated to be very small, but positive using the PGS method (0.011, 95% confidence interval: 0.005–0.020). This finding supports the assumption made in the Bayesian analyses that there was negligible dependence between the 2 tests in the data set in the present study.
Estimates of overall and covariate level sensitivity and specificity for enzyme-linked immunosorbent assay (ELISA) and fecal culture, and herd level prevalence, using a Bayesian model and either a single simultaneous application of both tests to 779 dairy cows (method 1) or repeated applications of both tests (method 2).
The pseudo gold standard method requires the assumption of perfect test specificity.
ELISA test sensitivity in early lactation was 31.6% higher (54.5–22.9 = 31.6) than in late lactation using method 1, and 28.1% higher (53.9-25.8) using method 2.
Fecal culture sensitivity in early lactation was 31.9% higher (51.7-19.8 = 31.7) than in late lactation using method 1, and 18.1% higher (77.3-59.2 = 18.1) using method 2.
Infection status of individuals
In the Bayesian analyses, the probability of infection was predicted for selected cows by monitoring their infection status Z cow(j) in the WinBUGS output. These cows were chosen because they had both positive and negative test results, either initially or in the subsequent repeated measures. The additional information provided by repeated measurements changed significantly the probability that an individual cow was infected compared with the cross-sectional analysis (Table 6). Cows with 1 initial positive result (cows 1, 2, 4, and 5) tended to have a high predicted probability of infection in the cross-sectional analysis, although this was influenced by lactation stage, parity at testing, and the within-herd prevalence. Multiple subsequent negative tests reduced this probability drastically (cows 1, 2, and 4), whereas a subsequent positive test (cow 5) gave a much higher probability. When both initial tests were negative (cows 3 and 6), subsequent positive results gave, as expected, a significantly higher probability of infection. These decisions on the status of individual animals have, in turn, an effect on the estimates of sensitivities and specificities. For example, the initial results for cow 2 would be interpreted as a false negative for FC in the cross-sectional analysis but as a false positive for ELISA in the full-data analysis. Thus the assumption that infection status is a constant for each animal provides more information for evaluating test performance.
The probability that individual cows with varying test result combinations were infected with Johne's disease estimated by the regression model using cross-sectional data and longitudinal data.
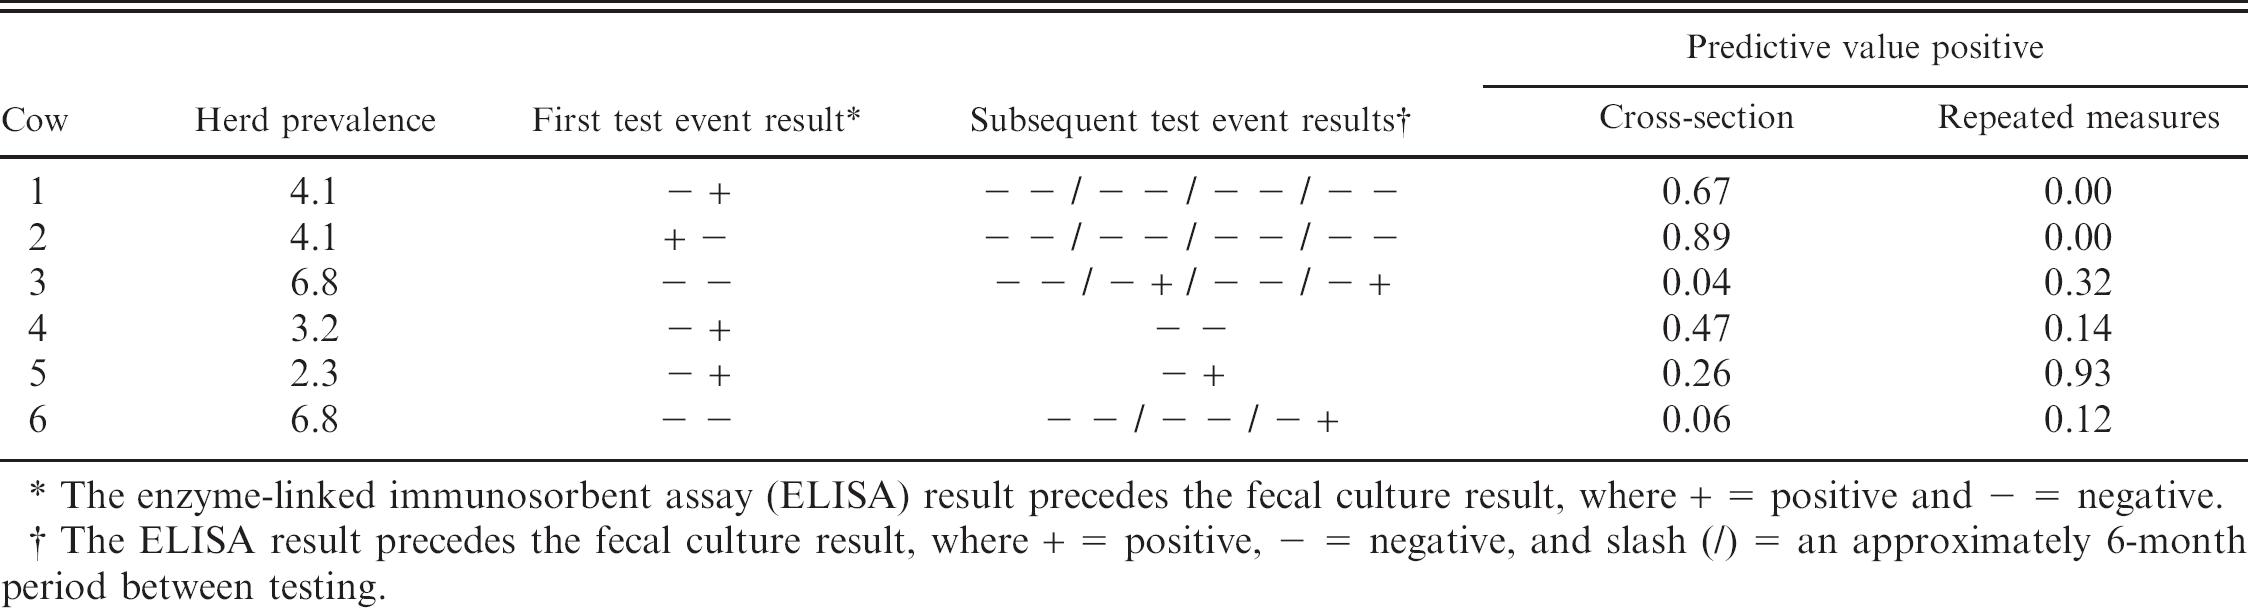
The enzyme-linked immunosorbent assay (ELISA) result precedes the fecal culture result, where + = positive and − = negative.
The ELISA result precedes the fecal culture result, where + = positive, − = negative, and slash (/) = an approximately 6-month period between testing.
Sensitivity analysis
The model remained stable in response to changes in 4 prior values. Only the posterior value associated with the altered prior showed any change. The greatest change was a decline of 6% to the sensitivity of FC for cows in parities greater than 4 of 34.3. This change and the others observed during the sensitivity analyses were small in comparison to the error bounds surrounding the point estimates. All Markov chains converged consistently to the same distributions when initiated from different starting values. Autocorrelation had generally disappeared completely after a lag of between 10 and 20 iterations, and there was no evidence of poor mixing.
Discussion
In the current study, the sensitivity and specificity of the ELISA and FC tests for JD in dairy cattle was estimated. A Bayesian regression model was applied to a repeated test events data set for 779 cows and to a cross-sectional subset of this data set that included only the first test event for each of these cows. Results from a PGS approach were also included for comparison with the results from the Bayesian method.
The strength of the Bayesian model was that it provided an estimate of the sensitivity for the ELISA and for the FC test across the sampled population and for subgroups of that population of different age and lactation stage. The strength of applying this model to a repeated measure data set was that up to 5 test events (i.e., simultaneous ELISA and FC on 5 occasions) were available per cow. It has previously been concluded that only repeated serial testing of cattle will enable detection of the true infection rates of JD. 26
For the ELISA test, estimated overall sensitivity was higher by the Bayesian method than by the PGS method. Within covariate levels, sensitivity was lowest in parities 1 and 2 with no clear trend apparent in higher parity groups. This finding was consistent with previous research 21,25 and the understanding that animals in the early stages of infection cannot necessarily be identified by ELISA because months or even years may elapse before they seroconvert. 23
For the FC test, estimated overall sensitivity was comparable between the Bayesian method applied to cross-sectional data and the PGS method, given the breadth of their error bounds, but it was unusually high (74.6%, error bound: 61.5–81.3) when estimated using repeat measure data. This high sensitivity interpreted in light of the low prevalence and high specificity estimates suggests, from a biological point of view, that the latently infected population, or the base of the JD “iceberg” discussed in a previous study, 36 is smaller than those authors suggest. For the 4 herds in this study, at least, this may be a more accurate reflection of the true situation than offered by the cross-sectional analysis. There was no clear trend in FC sensitivity across parity levels.
Each test was estimated to be more sensitive in early rather than late lactation. The priors for both ELISA and FC sensitivity described them as 3% higher in early lactation. The posterior values were 28.1% and 18.1% higher in early lactation. This finding was consistent with the understanding that the high levels of stress associated with calving and peak milk production may cause infection with JD to worsen and positive tests for JD to be more common as a consequence. However, it conflicts with previous research that found a positive serum ELISA result was more likely at the end than in early lactation. 18
The specificity of FC was estimated to be 98% (cross-sectional data) or 98.5% (longitudinal data), which conflicts with the common assumption that it is 100%. 4,6,31 Transient infection of cattle with JD has been demonstrated, 35 while a previous study 36 mentions the pass-through phenomena in which cattle in an environment heavily contaminated with MAP may ingest and excrete the organism without being detectably infected. Under these conditions, the assumption of perfect specificity is called into question, and while the likelihood of the true specificity being as low as 98% seems low it remains difficult to quantify. Estimates of ELISA specificity in this study were consistent with previous studies in which it was generally 99% or greater. 29–31,36
The point estimates of sensitivity must be interpreted with attention to their error bounds, which were wide in some cases. Nevertheless, they illustrate trends that were consistent with the current biological understanding of JD. The wide error bounds were probably due to the very small percentage (4.8%) of positive test results, and a data set with a higher percentage of positive tests may enable test performance to be determined with greater precision. For example, it would be interesting to apply this model to the Australian data set with up to 7 annual test events for cows in over 500 herds in Victoria. 21
The results of this study stand to benefit both veterinary practitioners and the makers of policy for controlling JD. Veterinarians, when considering the test results for a possible case of JD, can refine their diagnosis depending on the age and lactation stage of the cow. Policy makers can use these results to support a testing program that focuses on older cows in early lactation, to assist in developing a cost-effective approach to large-scale control.
Estimates of prevalence followed a trend for herds B-D. The PGS value was slightly higher than the Bayesian model with cross-sectional data, which was in turn slightly higher than the Bayesian model with repeat measure data. The PGS method was expected to give the highest estimates of prevalence because it assumed that there were no false negative tests. It seems counterintuitive that repeatedly testing a population for a disease results in a lower prevalence than when the population is tested in a cross-sectional manner. However, this result can be readily explained with reference to the data on individual cows in Table 6. Despite high test specificity, the low prevalence meant that cows with a single positive test and multiple negative tests were considered more likely to be uninfected than infected. Most of the cows in this study had predominantly negative test results and consequently a lower probability of infection considering multiple test events than when considering a single test event, leading to a lower herd-level prevalence estimate after repeated testing. The low estimate of prevalence obtained when using repeat measure data was especially evident in herd A. Cows in this herd that tested positive usually did so only once and usually had multiple negative test results. Consequently, the probability that they were infected was higher when using cross-sectional data, than when using the complete data set. These singly positive tests may indicate temporarily elevated anti-body levels in infected cows, or they may be due to cross-reaction with antigen from sources other than MAP, thus generating genuinely false positive results. It is conceivable that an organism present on farm A but not on the other 3 farms caused cross-reaction of the test. The prevalence results in this study are of value because they illustrate how repeated testing may lead to a lower probability of infection in many individuals within a population (herd).
A weakness of the regression model in the present study was that it did not account for dependence between the ELISA and FC tests. Such a simplification may have been acceptable in this data set because dependence was found to be very low (0.01, 95% confidence interval: 0.005–0.020). Insignificant impact on results has been reported when dependence was of this order of magnitude. Nevertheless, it is acknowledged that analysis of the performance of diagnostic tests with moderate accuracy and measuring the same biological response should, in general, attempt to adjust for dependence between the tests. 17 Ignoring dependence between the 2 tests in the noninfected population is generally considered acceptable because both tests have high specificity.
Dependence may also exist between subsequent tests in an individual. 16 The inclusion of a random effect to account for such dependence impaired Markov chain convergence, possibly owing to the low frequency of positive tests; however, its omission was recognized as undesirable. A data set containing a larger number of observations for each cow or a greater proportion of positive test results may have facilitated addition of the random effect. Given that testing occurred at 6-month intervals, the assumption of independence between test results for an individual cow was perhaps not unreasonable, and when tested, correlation between subsequent tests within cow was slightly positive but not significant (except tests 2 and 3, which were slightly negatively correlated [correlation coefficient = −0.01, P = 0.837]).
It was assumed in this analysis that cows became infection with JD at a young age and that infection persisted for life, based on the experimental evidence available. 13,22,28,33 While experimental infection studies indicate that, on occasion, the host may eliminate infection 33 or that transient infection may occur, 35 it was not believed these cases were sufficiently frequent to warrant representation in the model. If they were frequent, estimates of sensitivity and specificity would be erroneously low and high, respectively, while prevalence estimates would be higher than their true values.
A PGS based on serial testing of each individual (up to 5 test events [i.e., 5 ELISA tests and 5 FC tests] per cow over 3 years) was considered a useful contrast for the results of the Bayesian model in the present study. Previously it had been concluded that only repeated serial testing of cattle would enable detection of the true infection rates of JD. 25 Two aspects of the PGS method require justification. First, it assumed that the tests were perfectly specific (specificity = 1.0), and while this is a simplification of reality, the high specificities (>98%) suggest it was acceptable. Second, all cows tested for JD were included in the analysis, with their infection status defined using all available testing information. This approach maximized analytical power, ensured data were consistent across the analytical approaches, and avoided bias between test-positive and test-negative populations. For example, if cows with 4 or more tests had been selected as the test-negative population, PGS results would have been biased toward older animals.
The performance of the Bayesian model remained stable under sensitivity analysis. There was little autocorrelation between subsequent iterations during the Gibbs sampling process, and posterior distributions remained the same when sampling was initiated from different starting values.
In conclusion, the Bayesian regression model described in the current study offered improved precision in the diagnosis of JD because, when estimating test sensitivity, it incorporated cow-level information such as age, lactation stage, and, when using repeated measure data, previous test results. Results were consistent with the current understanding of the disease process and previous research. Also, results demonstrated that prevalence estimates in a population may decline as test frequency increases, compared with when the population is tested in a cross-sectional manner. This model represents a tool to assist in the diagnosis of JD in individual cows, and to assist development of cost-efficient, large-scale disease control programs in which diagnostic testing plays a role.
Acknowledgements
Staff and students of the EPICentre, Massey University assisted with data collection. Livestock Improvement Corporation and Meat New Zealand provided project funding. Funding for the author's PhD (SN) was provided by the Agricultural Marketing and Research Development Trust, New Zealand (project number 20383).
Footnotes
a.
CSL ELISA, CSL Pty Ltd., Parkville, Victoria, Australia.