
Abstract
Background
The optimal positioning range for the femoral component in unicompartmental knee arthroplasty (UKA) performed in osteoporotic bone remains undefined. Most existing biomechanical studies have been established using normal bone quality models, whereas limited evidence addresses abnormal bone conditions. Complications involving the operative-side compartment are closely associated with the high revision rates after UKA.
Methods
CT and MRI scans of the right knee of a volunteer without pathological changes were used to construct a three-dimensional finite element model. A normal bone quality UKA model (NB group) was created, and an osteoporotic model (OP group) was generated by reducing the elastic modulus of bone tissue proportionally. Femoral component alignment was set at 0°, as well as 3°, 6°, and 9° of varus and valgus. Stress changes within operative-side structures were quantified and compared between the two models.
Results
(1) In both models, peak stress on the femoral component increased progressively with greater varus alignment, with the OP group consistently demonstrating higher stress values than the NB group. Compared to their respective 0° neutral position, the peak von Mises stress on the femoral component surface increased by 71.8% and 70.8% at 9° of varus in the NB and OP groups, respectively. (2) Peak stresses on the PE insert and on the cortical bone beneath the tibial component increased with both varus and valgus malalignment; the increase was more pronounced under varus. The OP group exhibited higher peak stresses and greater incremental changes than the NB group. Compared to their respective 0° neutral position, the peak von Mises stress on the cortical bone surface beneath the tibial component increased by 50.0% in the NB group and 40.8% in the OP group at 9° varus, and by 14.2% and 27.0%, respectively, at 9° valgus.
Conclusion
Even small coronal-plane deviations (±3°) in femoral component positioning during medial UKA may substantially elevate stresses within the operative-side compartment. Strict control of coronal alignment is essential to avoid varus or valgus and prevent abnormal stress concentrations around the implant. Additionally, the impact of osteoporosis on postoperative biomechanical stability warrants careful consideration to optimize implant design and surgical technique, thereby reducing the risks of aseptic loosening, periprosthetic fracture, and improving long-term outcomes.
Keywords
Introduction
Knee osteoarthritis (KOA) is a common degenerative joint disease, with the majority of patients exhibiting lesions primarily confined to the medial compartment.1,2 For these patients, unicompartmental knee arthroplasty (UKA) has emerged as an effective alternative to total knee arthroplasty, offering advantages such as reduced surgical trauma, lower blood loss, faster recovery, and the preservation of native knee proprioception and normal biomechanics. 3 As surgical techniques and implant designs have improved, and patient expectations for postoperative quality of life have increased, the clinical adoption of UKA has grown, with long-term implant survival and functional outcomes receiving increasing attention.
Studies have shown that the long-term success of UKA is closely associated with the precise positioning of the implant. Among these, the positioning of the femoral component is a key factor influencing postoperative biomechanical performance.4,5 Suboptimal femoral component positioning can lead to various complications. However, a consensus on the “optimal” femoral alignment has not yet been fully established. Furthermore, patients undergoing UKA, particularly elderly women, often present with varying degrees of osteoporosis. Bone density is a key factor influencing stress distribution at the bone-implant interface and overall implant stability.5–7 Under identical mechanical loads, osteoporotic bone is more susceptible to stress concentration or microfractures, potentially resulting in early implant subsidence or loosening. The adverse biomechanical effects resulting from malpositioned femoral components are likely amplified in the presence of osteoporosis. However, the majority of current literature is predicated on the assumption of normal bone quality, with scant investigation into the interplay between femoral component positioning and the patient’s native bone condition.
Traditional biomechanical studies have primarily relied on cadaver experiments or clinical retrospective analyses, making it challenging to noninvasively quantify detailed stress distributions within the bone surrounding the implant. Three-dimensional finite element analysis (FEA), as a powerful computational modeling technique, enables precise reconstruction of bones, implants, and soft tissues in three dimensions, and allows simulation of their mechanical responses under physiological loading. This approach facilitates refined, quantitative evaluation of stress distributions at the bone-implant interface and within surrounding bone tissue.8,9 Using this technology, the biomechanical outcomes of different variable combinations can be systematically investigated.
Therefore, this study aimed to establish a three-dimensional finite element model of medial unicompartmental knee arthroplasty, incorporating the femur, tibia, implant components, and major ligaments, to systematically analyze the effects of varying femoral component positions on postoperative stress distributions and peak stresses in operative-side structures under different bone quality conditions (normal vs osteoporotic). Particular attention was given to the femoral component–bone interface, the surface of the polyethylene (PE) insert, and the cortical bone beneath the tibial component. By providing quantitative biomechanical data, this study seeks to inform optimized femoral component placement strategies in UKA for patients with differing bone quality, with the ultimate goal of reducing long-term complication risk and improving clinical outcomes.
Materials and methods
Imaging data acquisition and volunteer information
To construct a high-fidelity three-dimensional finite element (FE) model, imaging data of the lower limb were acquired from a healthy male volunteer. The volunteer was 34 years old, had no history of knee joint disease, and physical examination and radiographs confirmed the absence of skeletal deformities or joint pathology in both lower limbs. The study protocol was approved by the institutional ethics committee, and written informed consent was obtained from the volunteer.
The imaging data acquisition process was as follows: CT Scanning: A 128-slice spiral CT scanner was used to perform continuous full-length scans of both lower limbs. The slice thickness was set to 0.6 mm to ensure precise capture of the bone microarchitecture. The CT data served as the basis for reconstructing accurate geometrical models of the femur, tibia, and fibula. MRI Scanning: A 3.0 T MRI scanner was used to image the right knee joint. The scanning range extended 15 cm above and below the midpoint of the patella, with a slice thickness of 1 mm. These data were primarily used to identify intra-articular soft tissue structures, including ligaments and menisci, as well as the articular cartilage morphology. Data storage: All raw CT and MRI images were stored in DICOM format for subsequent three-dimensional geometrical model reconstruction.
Software and hardware platforms
Finite element simulations were performed on a Dell Precision 5820 workstation equipped with an Intel Core i9-10920X CPU, 512 GB RAM, and an NVIDIA T400 (4 GB) graphics card. Software: Mimics 20.0 (Materialise, Belgium): Utilized for initial three-dimensional reconstruction of bones, cartilage, and soft tissues based on CT and MRI DICOM data. Geomagic Studio 2014 (3D Systems, USA): Applied for reverse engineering processing of Mimics-generated models, including smoothing, sealing, and denoising, to generate precise NURBS surface models. NX 1911 (Siemens, Germany): Used for implant modeling, assembly, and adjustment of femoral component positions, enabling the creation of different experimental model configurations. Ansys Workbench 2019 (ANSYS, USA): Employed for assignment of material properties, mesh generation, and application of loading and boundary conditions in finite element analysis. Implant Model: The study utilized the Sled fixed-bearing medial unicompartmental knee arthroplasty system (LINK, Germany), which includes a femoral component, tibial insert, and tibial tray.
Medial unicompartmental knee arthroplasty models with varying femoral component positions in normal and osteoporotic bone
Construction of knee joint models with different bone quality
Material parameters of knee joint and implants.


Finite element modeling of the normal bone knee joint.
A parametric modeling approach was employed to construct the osteoporotic knee joint model. This method was informed by established finite element modeling practices for osteoporotic bone in the hip, humerus, and spine.18,19 The key aspect of model construction involved adjusting the material properties of bone to reflect the pathological characteristics of osteoporosis. Specifically, osteoporosis is primarily characterized by reduced bone density. Based on reported quantitative relationships between bone density and elastic modulus, and relative to normal bone, the material parameters of the osteoporotic model were defined as follows: the elastic modulus of cancellous bone was reduced by 67%, and that of cortical bone was reduced by 34% (Table 1).
Construction of medial UKA models with varying femoral component positions
The implant geometry was scanned using a FreeScan X5 3D scanner and imported into Ansys Workbench 2019 for simulated osteotomy and implant assembly. Boolean operations were applied to position the femoral component strictly according to standard medial UKA surgical guidelines. The implant was initially placed at 0° alignment. Any gaps between the implant and osteotomy surfaces were assumed to be filled with bone cement to achieve a press-fit stabilization.20,21 The implant structural parameters are summarized in Table 1.
Fourteen loading conditions were established by varying femoral component coronal alignment (0°, 3°, 6°, and 9° of varus, and 3°, 6°, and 9° of valgus). Using these configurations, two model groups were generated: the normal bone quality UKA group (NB group) and the osteoporotic UKA group (OP group) (Figure 2). Finite element models of different varus and valgus angles of femoral prosthesis for unicompartmental knee arthroplasty.
Loading conditions and outcome measures
A vertical load of 1000 N was applied at the center of the femoral condyle. 9 The observational metrics comprised the high-stress values and the peak von Mises stress on the surfaces of the femoral component, the PE insert, and the cortical bone. Statistical analyses were performed using Graphpad Prism10. Equivalent peak stress values were determined by averaging the three highest stress points. Comparisons were made between different femoral component inclination angles and the 0° reference within each group, as well as between the NB and OP groups. The results were visually presented using bar charts.
For the analysis of stress trends (increase or decrease), the high-stress regions were considered, specifically the top three points with the highest stress values. To quantify the specific magnitude of stress, the peak von Mises stress was used. It is crucial to note that the comparisons in this study are based on deterministic mechanical responses derived from finite element model computations. The reported stress differences between groups (e.g., between different alignment angles or bone quality conditions) are direct computational outputs. Therefore, these comparisons constitute a descriptive analysis aimed at quantifying the influence trends of parameter variations, rather than statistical inference based on random samples.
Results
Validation of the normal bone knee joint model
The finite element model of the normal bone knee consisted of 528,624 nodes and 517,335 elements. Under axial loading, the peak equivalent stresses of the medial and lateral menisci were 15.76 MPa and 7.95 MPa, respectively. The peak equivalent stresses of the medial and lateral femoral cartilage were 3.77 MPa and 3.28 MPa, respectively, while the medial and lateral tibial cartilage experienced peak stresses of 4.10 MPa and 3.37 MPa. The load distribution between the medial and lateral compartments was 58.6% and 41.4%, respectively, consistent with previously reported experimental data, confirming the validity of the model.9,17 In the simulated anterior drawer test, the anterior displacement at the midpoint of the tibia was 4.93 mm, closely matching literature values, further validating the biomechanical accuracy of the model.
Outcome measures
Within-group comparisons
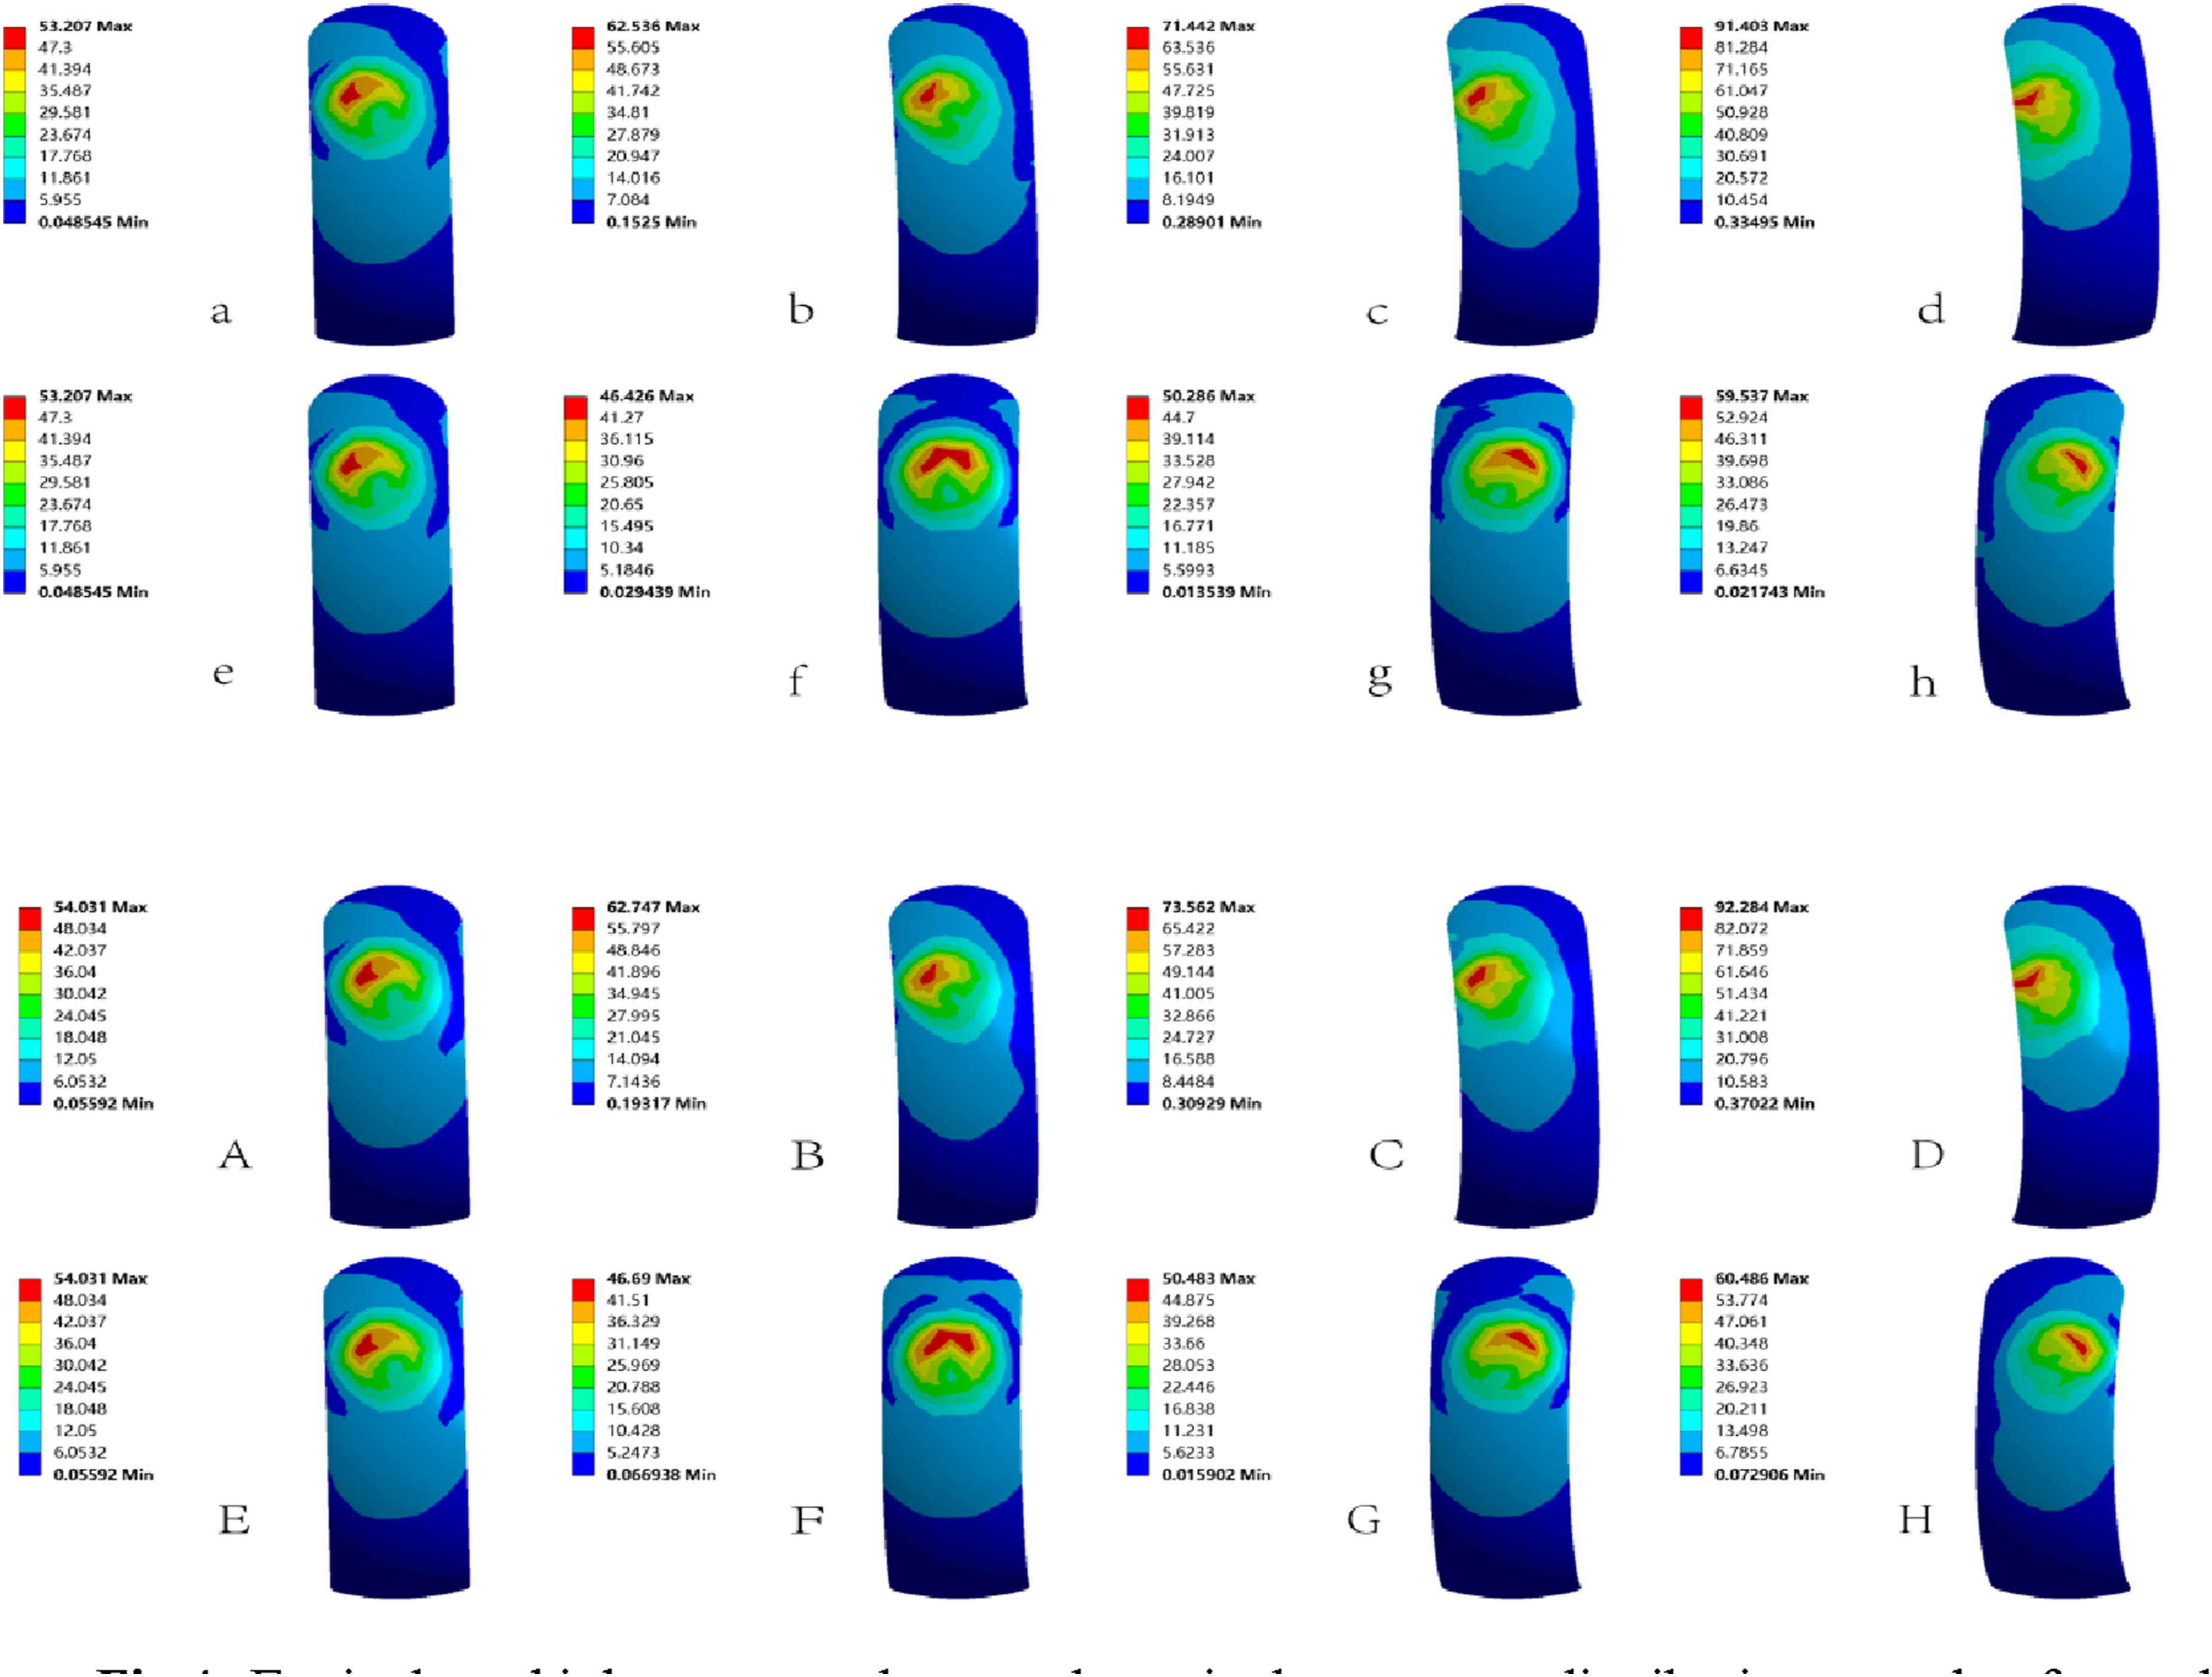
In both model groups, the peak equivalent stresses on the femoral component surface increased with greater varus inclination of the femoral component. Under 3° and 6° of valgus alignment, peak stresses were lower than those at 0°. Whereas at 9° of valgus, peak stresses exceeded the 0° reference, showing an overall increasing trend with valgus inclination. Compared with the 0° baseline, peak equivalent stresses in the NB group increased by 17.5%, 34.3%, and 71.8% at 3°, 6°, and 9° of varus, respectively, while in the OP group, the corresponding increases were 16.2%, 36.1%, and 70.8%. The high-stress regions on the femoral component were primarily concentrated around the contact surface interfacing with the polyethylene (PE) insert and varied with changes in varus-valgus alignment (Figures 3 and 4). Variation of high stress values for different structures. Equivalent high stress values and equivalent stress distribution on the femoral prosthesis surface. NB group: a–d: 0°-varus9°, e–h: 0°- valgus9°; OP group: A–D: 0°-varus9°, E–H: 0°- valgus9°.
In both model groups, the peak equivalent stresses on the polyethylene (PE) insert surface increased with greater varus or valgus inclination of the femoral component. The rate of stress increase was more pronounced under varus alignment than under valgus, with high-stress regions primarily concentrated on the contact surface interfacing with the femoral component (Figure 3).
In both model groups, peak equivalent stresses on the cortical bone beneath the tibial component increased with greater varus or valgus inclination of the femoral component, with stress increments being more pronounced under varus alignment than valgus. Compared with the 0° baseline, peak stresses in the NB group increased by 27.9%, 35.2%, and 50.0% at 3°, 6°, and 9° of varus, and by 6.6%, 9.2%, and 14.2% at 3°, 6°, and 9° of valgus. In the OP group, corresponding increases were 29.5%, 34.8%, and 40.8% for varus, 22.2%, 24.9%, and 27.0% for valgus. High-stress regions were mainly concentrated at one area along the medial edge and two regions on the anterior and posterior aspects of the lateral edge beneath the tibial component (Figures 3 and 5). Equivalent high stress values and equivalent stress distribution on the surface of cortical bone under tibial prosthesis. NB group: a–d: 0°-varus9°, e–h: 0°- valgus9°; OP group: A–D: 0°-varus9°, E–H: 0°- valgus9°.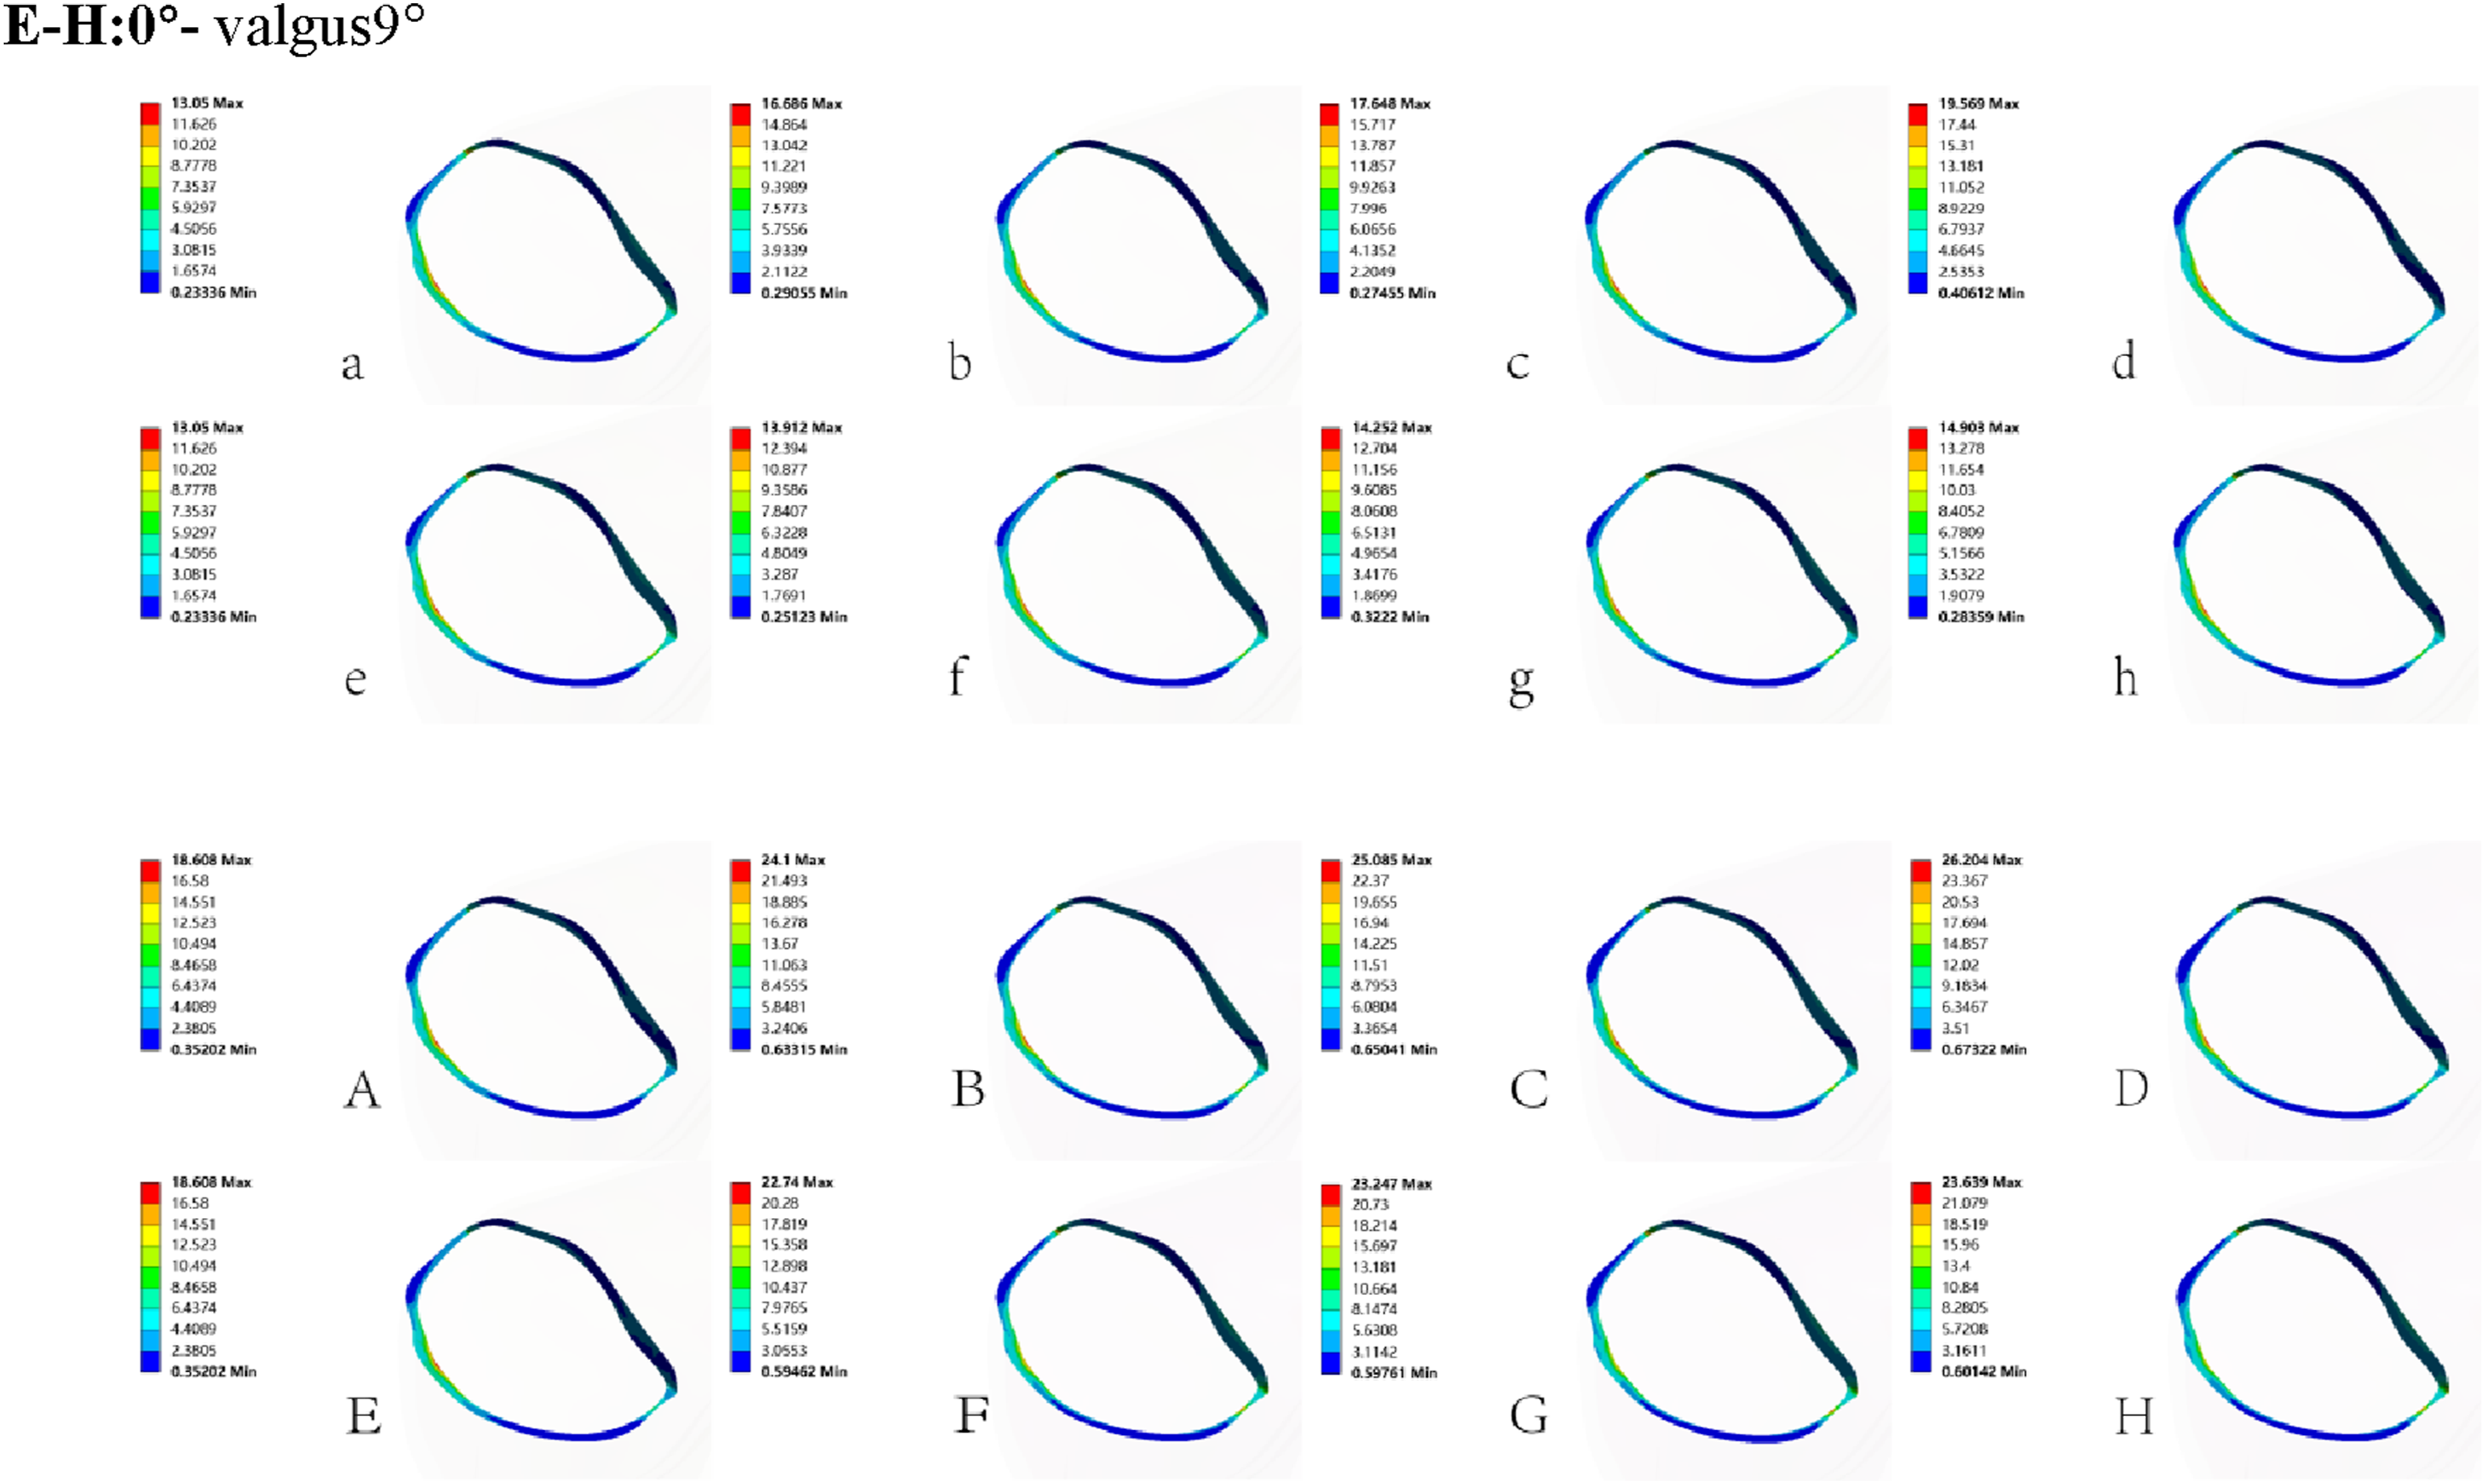
Between-group comparisons
Between-group comparisons were performed for the same structures at identical femoral component inclination angles. On the femoral component surface, peak stresses were consistently higher in the OP group than in the corresponding NB group models across all inclination angles (Figures 3 and 4). Similarly, peak stresses on the polyethylene (PE) insert surface were higher in the OP group than in the NB group at all inclinations, although the magnitude of the increase was relatively modest (Figure 3). For the cortical bone beneath the tibial component, peak stresses in the OP group were markedly higher than those in the NB group at all inclinations. Specifically, for varus alignments of 0°, 3°, 6°, and 9°, peak stresses increased by 42.6%, 44.4%, 42.1%, and 33.9%, while for valgus alignments of 3°, 6°, and 9°, increases were 63.5%, 63.1%, and 58.6%, respectively. These findings indicate that osteoporosis significantly amplifies stress on the cortical bone beneath the tibial component (Figures 3 and 5).
Discussion
This study aims to investigate the biomechanical interplay between femoral component positioning and osteoporosis, two established risk factors for revision UKA, to elucidate their underlying mechanisms. Our finite element analysis provides clear insights: these factors do not simply act additively, but rather interact to form a vicious cycle in which osteoporosis functions as an “amplifier” and malalignment of the implant acts as a “trigger.” On one hand, varus or valgus malalignment of the femoral component leads to abnormal stress distribution within the knee joint regardless of bone quality. On the other hand, in the presence of osteoporosis, the detrimental effects of such abnormal stress distribution are dramatically magnified. Specifically, varus malalignment increases stresses on the femoral component surface, while peak stresses on the polyethylene insert and the cortical bone beneath the tibial component are elevated across the board.9,22 This finding explains why patients with osteoporosis are at higher risk of UKA failure: their bone–implant system has a reduced “tolerance margin” for implantation errors. Abnormal stresses act directly on already fragile bone and on the polyethylene insert, which bears the majority of the load, substantially increasing the likelihood of early revision due to mechanical complications such as insert wear, tibial fracture, or implant loosening.23–25 The results of this study translate clinically observed risk factors into a visualized and quantifiable biomechanical pathological process, bridging the gap between clinical observation and mechanistic understanding.
The distribution of equivalent stress on the femoral component provides a critical perspective for understanding the direct impact of malalignment. Our analysis indicates that varus malalignment of the femoral component is the primary risk factor for stress concentration on the implant itself. As the varus angle increases, peak equivalent stresses on the femoral component surface rise markedly, with approximately a 70% increase observed at 9° varus in both the NB and OP groups. This phenomenon arises from altered biomechanics: varus alignment shifts the knee joint’s load-bearing center medially, substantially increasing contact stress. Such elevated local stresses not only accelerate wear of the polyethylene (PE) insert, generating deleterious wear debris, but may also elevate the risk of fatigue-related fracture of the femoral component itself.13,26–28 Notably, although valgus alignment at 3° and 6° produced lower stresses, at 9° valgus, stresses became positive and began to increase, indicating that extreme valgus positioning can similarly disrupt normal mechanical balance. Furthermore, the magnitude of stress increase across different angles was highly similar between the OP and NB groups, suggesting that the femoral component’s stress state is primarily determined by its spatial alignment rather than the patient’s bone quality. Therefore, to minimize high stresses and related complications, surgeons should exercise particular caution to avoid excessive varus placement of the femoral component and maintain alignment within a safe range.
As the primary load-bearing element in medial unicompartmental knee arthroplasty, the polyethylene (PE) insert plays a critical role in determining the long-term durability of the implant. Our results demonstrate that peak stresses on the PE insert increase with greater varus or valgus inclination of the femoral component, with varus malalignment producing particularly pronounced stress escalation. First, this may be attributed to the fact that inclination of the femoral component changes the contact between the implant and PE insert from an ideal surface contact to more unfavorable line or point contact, thereby reducing the contact area. Under the same joint load, a smaller contact area leads to higher contact stress. 9 Second, varus malalignment is more detrimental than valgus because it shifts the contact center toward the anatomically narrower medial compartment, concentrating stresses over a smaller region and resulting in greater stress increases under varus conditions.29,30 Sustained high stresses on the PE insert surface are a key mechanical driver of sub-millimeter wear particle generation, periprosthetic bone resorption, as well as fatigue fracture and deformation of the insert. 25 Although peak stresses in the OP group were higher than in the NB group across all angles, the magnitude of the increase was modest. This is likely because once implant malalignment occurs, the resulting abnormal mechanical environment becomes the primary source of high PE insert stress, with differences in bone quality having only a minor modulatory effect. This may be explained by the fact that, as joint loads are transmitted through the rigid implant and insert, the magnitude of contact stress is relatively insensitive to variations in the underlying bone’s mechanical properties, such as elastic modulus. 6 Biomechanically, even minor malalignment of the femoral component, especially in varus, can significantly elevate stress on the PE insert, underscoring the importance of precise alignment to ensure implant longevity and reduce the likelihood of revision.
The stress distribution in the cortical bone beneath the tibial component is a critical indicator for evaluating load transfer through the implant and the risk of tibial plateau fracture. Our study demonstrates that femoral component malalignment, particularly varus positioning, significantly increases stresses in the tibial cortical bone via a “lever-arm effect,” and this detrimental impact is further amplified in osteoporotic (OP) bone. Femoral component alignment acts as the “trigger” for abnormal stress. Data show that varus malalignment produces greater increases in cortical bone stress (up to 50.0% in the NB group and 40.8% in the OP group) compared with valgus alignment (up to 14.2% in NB and 27.0% in OP). This likely occurs because varus placement shifts the knee’s load-bearing center medially and posteriorly. This shift generates substantial compressive stress concentrations along the medial edge of the tibial component, while tensile stresses concentrate in the relatively thin lateral cortical regions, particularly in the anterior and posterior aspects. Osteoporosis plays a key role as a “stress amplifier.” Across nearly all inclination angles, cortical bone stresses in the OP group were consistently higher than those in the NB group. This can be explained by alterations in the stress transmission pathway. In normal bone, the robust cancellous structure effectively distributes loads transmitted through the tibial component. In osteoporotic bone, however, the weakened cancellous bone exhibits a reduced or reversed “stress-shielding” effect, forcing a greater proportion of load through the cortical shell of the tibial plateau.7,31,32 Consequently, the additional load imposed by malalignment superimposes on already overstressed cortical bone, sharply increasing peak stresses and markedly elevating the risk of cortical microfractures or incomplete fractures in osteoporotic patients. These findings underscore the critical importance of preoperative assessment of bone quality and meticulous intraoperative alignment, particularly in patients with osteoporosis, to minimize excessive cortical stress and reduce the risk of early tibial plateau complications.
This study has several notable strengths. First, three-dimensional finite element analysis allowed for precise and quantitative evaluation of stress distributions within the implant components and the surrounding bone, providing insights that are difficult to obtain through clinical or experimental studies. Second, this is among the first systematic investigations of the interaction between femoral component malalignment and patient bone quality in medial unicompartmental knee arthroplasty. By constructing both osteoporotic and normal bone models, we provide a biomechanical explanation for why surgical precision is particularly critical in specific patient populations, such as those with osteoporosis. Finally, seven different varus–valgus alignment scenarios were simulated in each bone quality model, allowing for a comprehensive analysis across a clinically relevant spectrum of malalignment.
This study has several inherent limitations. First, the finite element model was constructed based on the geometry of a single individual. Although parametric variations in alignment were systematically investigated, the results may still be influenced by individual anatomical characteristics (e.g., femoral condyle size, curvature, and bone morphology) and may not fully represent the variability within the general population. Second, a simplified static loading condition (single-leg stance) was applied. This cannot replicate the complex, dynamic multi-axial loads and muscle forces present during activities such as walking, stair climbing, or deep flexion. Finally, and most critically, this study examined isolated varus/valgus malalignment of the femoral component, rather than combined malalignment involving both the femoral and tibial components. In clinical practice, malalignment frequently occurs in combined patterns (e.g., femoral varus with tibial valgus). The interactive effects of such combined malalignments on stress distribution and joint kinematics have not been assessed in the current model and represent an important direction for future research.
Conclusion
This study demonstrates, through finite element analysis, that femoral component malalignment substantially increases abnormal stresses across the structures of the medial compartment following unicompartmental knee arthroplasty (UKA), and that the presence of osteoporosis (OP) further exacerbates these detrimental effects. Therefore, precise implantation of the femoral component is of critical importance in UKA. It is recommended that coronal plane inclination be maintained within a neutral range of ±3° varus/valgus and that the component be positioned at the distal center of the femoral condyle. Moreover, the negative biomechanical impact of osteoporosis on postoperative stability should be carefully considered, with targeted strategies applied during preoperative assessment, intraoperative decision-making, and implant selection. By optimizing both alignment accuracy and bone quality management, the risk of complications such as aseptic loosening and periprosthetic fractures can be effectively reduced, ultimately enhancing the long-term clinical outcomes of UKA.
Footnotes
Acknowledgements
This statement does not include mandatory confirmation.
Consent to participate
Informed consent was obtained from all individual participants included in the study.
Author Contributions
Mengfei Liu and Xiaochen Ju participated in the experimental design, Mengfei Liu and Yupeng He and Haiwen Lu in the experimental implementation, Yaozong Qin and Chuanlin Mei in the data collection, Mengfei Liu and Gang Chen in the writing of the article, and Xiaochen Ju and Haiwen Lu in the proofreading of the article.
Funding
The authors received no financial support for the research, authorship, and/or publication of this article.
Declaration of conflicting interests
The authors declared no potential conflicts of interest with respect to the research, authorship, and/or publication of this article.
Data Availability Statement
The data in this study are transparent and available through the corresponding author.