
Abstract
Keywords
Introduction
Osteoporosis (OP) is a systemic bone disease marked by reduced bone mass and deteriorating bone microarchitecture, resulting in increased fragility and a higher risk of fractures. It is a worldwide public health issue, with its occurrence differing across the globe. One study reported a 14.5% prevalence in developed nations and up to 22.1% in developing nations. 1 OP is now considered one of the pandemics of the 21st century, affecting approximately 200 million people, especially the elderly population. 2 Global population aging is accelerating, with projected annual direct healthcare costs for OP reaching $25.3 billion by 2025. 3 Osteoporotic fractures can greatly impact physical function, lead to complications that reduce quality of life, and elevate mortality and healthcare costs. This presents a significant global public health challenge, underscoring the need for early identification and prevention strategies to alleviate healthcare burdens.
In recent years, significant attention has been drawn to the intricate relationship between type 2 diabetes mellitus (T2DM), obesity, and OP. A substantial proportion of patients diagnosed with T2DM are also obese, and increased skeletal fragility is observed in both obesity and T2DM. 4 Patients with obesity combined with T2DM often present with normal or even elevated bone mineral density (BMD); however, they also face an increased risk of fragility fractures, making it difficult to understand the skeletal health of these individuals. 4 In patients with T2DM, the presence of obesity leads to an increase in BMD due to higher mechanical loads on the skeleton, but this does not translate into an improvement in bone quality or a reduction in fracture risk, a phenomenon that may be attributed to factors such as impaired bone microarchitecture and altered bone conversion, which are prevalent in the diabetic population.5,6 Insulin, which is frequently elevated in T2DM, has been shown to have an anabolic effect on bone and may enhance BMD. 7 However, chronic hyperinsulinemia associated with obesity may also lead to a low-grade inflammatory state, which can negatively impact bone health by promoting osteoclast activity and inhibiting osteoblast function. 8 Thus, there are many challenges in exploring the effects of obesity and T2DM on bone health.
Body roundness index (BRI), a recently developed anthropometric indicator, utilizes a multifaceted approach to assess body size by integrating both height and waist circumference. In comparison to conventional indicators such as the body mass index, BRI offers a more nuanced understanding of body fat distribution.9–11 A study on a Chinese population showed that BRI was positively associated with low eGFR. 12 A study by Cai et al. found that BRI was significantly associated with the risk of cardiovascular disease in hypertensive patients with obstructive sleep apnoea at a median follow-up of 6.8 years. 13 Another study that employed meta-analysis discovered that BRI was more efficient than body mass index, waist-hip ratio, and the anthropometric indices of body adiposity in predicting metabolic syndrome. 14 A recent cross-sectional study revealed a significant negative correlation between BRI and BMD. Specifically, each unit increase in BRI was associated with a 0.0313 g/cm2 decrease in total BMD, and this relationship persisted even after adjusting for confounders. 15 This shows that BRI is strongly associated with a variety of health conditions, including osteoporosis, suggesting that BRI can be a valuable assessment of OP risk in diabetic populations.11,16 However, studies linking BRI to OP in patients with T2DM remain limited, highlighting the need for further investigation.
The aim of this study was to elucidate the relationship between BRI and the risk of OP in patients with T2DM using data from the National Health and Nutrition Examination Survey (NHANES) to provide new insights into the prevention of OP.
Methods
Survey description
This cross-sectional study utilized data from the NHANES National Survey, which was conducted biennially by the National Center for Health Statistics (NCHS) from 2005 to 2018. The goal of the survey is to analyze the health and nutrition status of individuals in the United States (US). All individuals involved in the study signed written informed consent forms, and the NCHS Institutional Review Board approved the study. This data offers researchers the opportunity to investigate diverse health trends and associations using the available public health information.
Study population
The data for our study were obtained from the NHANES 2005-2018 database, as data on BRI and OP in patients with diabetes were available during these periods. The study included a total of 50,543 participants. The following exclusion criteria were used: (1) ageless than or equal to 20 years; (2) not diabetic; (3) missing BMD; and (4)missing height and waist circumference (WC). The study flow chart is shown in Figure 1. Flow chart of study participant selection from NHANES 2005-2018.
Identification of diabetes
The diagnostic guidelines for diabetes mellitus currently in use are based on international research and earlier investigations. 17 Individuals who have been previously diagnosed with diabetes or who exhibit a fasting blood glucose level ≥126 mg/dL or a glycated hemoglobin level ≥6.5% are included in the diagnostic criteria.
Calculation of BRI
Height and WC are two important body measurements that are combined to create the BRI.
9
The measurements are taken by skilled medical technicians at the Mobile Examination Centre. The following formula is used to determine the BRI:

Definition of OP
This study employed the Hologic Discovery Model A densitometer to assess BMD through dual-energy X-ray absorptiometry in the total femur, femoral neck, trochanter, and intertrochanter regions, with routine scanning of the left hip (with the exception of specific cases). The definition of OP was based on reference values from individuals aged 20–29 in the NHANES III dataset. 18 In this study, OP was defined as BMD values more than 2.5 standard deviations below the reference group mean, with specific thresholds being: total femur (females <0.64 g/cm2, males <0.68 g/cm2), femoral neck (females <0.56 g/cm2, males <0.59 g/cm2), trochanter (females <0.46 g/cm2, males <0.49 g/cm2), and intertrochanter (females <0.74 g/cm2, males <0.78 g/cm2). A diagnosis of complete OP was made if any region met these criteria.
Covariates
In an endeavor to account for potential confounding variables with the potential to affect both outcome and exposure variables, this study incorporated a range of covariates within the analytical procedures. The collection of basic population information and the conducting of experimental measurements were conducted by professionals in accordance with the technical standards that have been posted on the NHANES website. All data and experimental methods can be downloaded from the NHANES website. The laboratory work was conducted at a facility in Minnesota. The demographic data collected included sex, age, race, household income, education, and other relevant categories. The examination data comprised measurements of height, WC, BMD, and other pertinent metrics. The laboratory data encompassed fasting blood glucose, glycosylated hemoglobin, alanine aminotransferase, aspartate aminotransferase, blood urea nitrogen, blood calcium, serum creatinine, and serum phosphorus. The questionnaire data included smoking, exercise, diabetes, and arthritis, among other variables. Further information pertaining to the assessment of these covariates can be found on the NHANES website.
Statistical analysis
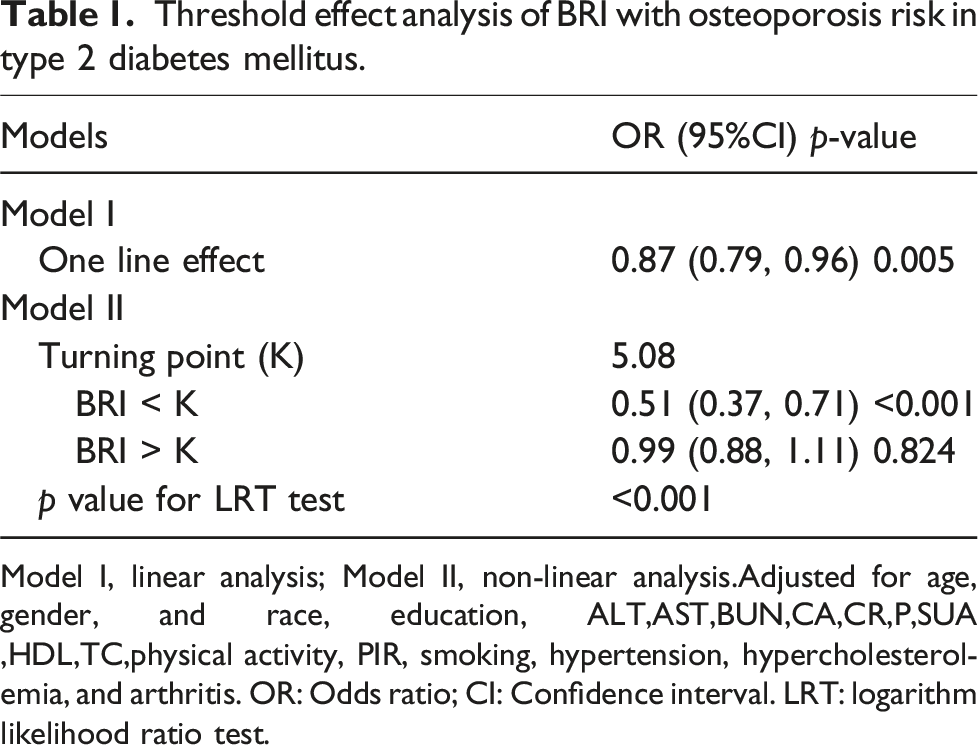
Continuous variables were described as mean ± standard deviation, and categorical variables were expressed as numbers and percentages. The differences in baseline characteristics between groups stratified by OP status were assessed using one-way analysis of variance for continuous variables and chi-square tests for categorical variables. Generalized additive modeling was used to investigate the dose-response relationship between BRI and OP in the T2DM population (Figure 2). Logistic regression models were used to estimate the association between BRI and OP risk, with results expressed as odds ratios (ORs) and 95% confidence intervals (95% CIs). Two linear regression models were employed to examine the threshold effect of BRI on OP risk (Table 1). Furthermore, a log-likelihood ratio test was conducted to compare the performance of two distinct models: a one-line linear regression model and a two-piecewise linear model. Subgroup analyses and interaction tests were conducted to assess the different populations by age, sex, race, education, poverty-to-income ratio, exercise, and smoking relationship between BRI and OP. EmpowerStats (https://www.empowerstats.com, X&Y Solutions, Inc., Boston, MA) and R version 4.2.0 (R Foundation) were used to conduct the statistical analyses for this study. A statistical significance level of p < .05 was predetermined. Relationship between BRI and osteoporosis. Solid rad line represents the smooth curve fit between variables. Blue bands represent the 95% of confidence interval from the fit. Adjusted for age, gender, and race, education, ALT,AST,BUN,CA,CR,P,SUA,HDL,TC,physical activity, PIR, smoking, hypertension, hypercholesterolemia, and arthritis. OR: Odds ratio; CI: Confidence interval. Threshold effect analysis of BRI with osteoporosis risk in type 2 diabetes mellitus. Model I, linear analysis; Model II, non-linear analysis.Adjusted for age, gender, and race, education, ALT,AST,BUN,CA,CR,P,SUA ,HDL,TC,physical activity, PIR, smoking, hypertension, hypercholesterolemia, and arthritis. OR: Odds ratio; CI: Confidence interval. LRT: logarithm likelihood ratio test.
Results
Baseline characteristics
Baseline characteristics of study participants.

Statistics are expressed as the mean ± SD, the median (interquartile range), or as percentages. PIR, Poverty income ratio; ALT, Alanine aminotransferase; AST, Aspartate aminotransferase; BUN, Blood urea nitrogen; Ca, Calcium; Cr, Creatinine; P: Phosphorus; SUA, Serum uric acid; HDL-C, High-density lipoprotein cholesterol;TC, Total cholesterol; WC, Waist circumference; BRI, Body roundness index.
Association between BRI and prevalence of OP
Multivariate logistic regression analysis of the association between BRI and osteoporosis risk.

Model 1: Unadjusted; Model 2: Adjusted for age, gender, and race; Model 3: Adjusted for variables in Model 2 plus education, ALT,AST,BUN,CA,CR, P, SUA,HDL,TC,physical activity, PIR, smoking, hypertension, hypercholesterolemia, and arthritis. OR: Odds ratio; CI: Confidence interval; BRI: Body roundness index.
Identification of nonlinear relationship
A non-linear dose-response relationship between the BRI and OP risk was observed (Figure 2 and Table 1). Smoothed curve-fitting methodology revealed an L-shaped association between BRI and OP risk in patients with T2DM (Figure 2). Threshold effect analysis identified a turning point at BRI = 5.08 (Table 1). In the context of BRI <5.08, an enhanced correlation between BRI and diminished OP risk was observed, as evidenced by the calculated OR of 0.51 (95% CI: 0.37-0.71, p < .001). Conversely, when BRI >5.08, no significant association was observed between BRI and OP risk (OR = 0.99, 95% CI: 0.88-1.11, p = .824). A comparison of the linear regression model with the two-piecewise linear regression model yielded a p-value for the log-likelihood ratio test of less than 0.001. Consequently, the evidence supports the use of the two-piecewise linear regression model for the fitting of the model.
Subgroup analysis
The role of other covariates on the correlation between BRI and OP risk was further explored. Subgroup analyses were conducted to assess the association between BRI and OP risk while examining the interaction of different covariates (Figure 3). The sex subgroup demonstrated that the association was more significant in women (OR = 0.82, 95% CI: 0.73-0.92) and non-significant in men (OR = 0.98, 95% CI: 0.84-1.15). However, sex interaction did not reach statistical significance (P-interaction = 0.064). Subsequent analyses of the age subgroups revealed significant associations in the <60-year-old group (OR = 0.77, 95% CI: 0.63-0.96) and the ≥60-year-old group (OR = 0.86, 95% CI: 0.76-0.96). However, the interaction was not statistically significant (P-interaction = 0.338). In the race subgroup, the association was more important for non-Hispanic blacks (OR = 0.72, 95% CI: 0.54-0.96) and other races (OR = 0.84, 95% CI: 0.58-0.96), and the interaction of race reached statistical significance (P-interaction = 0.033). Subgroup analyses of education level, poverty-to-income ratio, physical activity, and smoking status did not show significant interactions (P-interaction > 0.050). Subgroup analysis of BRI and osteoporosis risk in patients with type 2 diabetes mellitus. Adjusted for age, gender, and race, education, ALT,AST,BUN,CA,CR, P,SUA,HDL,TC,physical activity, PIR, smoking, hypertension, hypercholesterolemia, and arthritis. The model is not adjusted for the stratification variable itself. OR: Odds ratio; CI: Confidence interval.
Discussion
This study is the first to investigate the relationship between BRI and OP risk in T2DM patients, revealing an L-shaped nonlinear relationship based on analysis of 3,178 patients from the NHANES database. The study found that when BRI was below 5.08, each unit increase reduced OP risk by 49% (OR = 0.51, 95% CI: 0.37-0.71), but this protective effect weakened and became statistically insignificant above 5.08. This association remained stable across most population subgroups but varied among different races.
T2DM, obesity, and OP constitute a significant group of disorders that are increasing in prevalence and frequently co-occur, particularly among the elderly population. 4 Although individuals with obesity and T2DM often exhibit normal or elevated BMD, their bone mass is frequently compromised, resulting in an elevated risk of fragility fractures. The interrelationship between T2DM, obesity, and OP is intricate and variable, with different populations and obesity assessment metrics potentially influencing the associations among these conditions, thereby leading to divergent conclusions. The BRI, an innovative tool for assessing obesity, provides an accurate measurement of visceral adipose tissue and body fat distribution. 19 The BRI demonstrates extensive clinical utility, with a substantial body of scientific evidence supporting its superiority over traditional anthropometric measures in evaluating risk for various clinical outcomes.12–14 In light of this, our study investigated the association between the BRI and OP risk in patients with T2DM.
In the present study, an L-shaped relationship between BRI and OP risk was identified in a cohort of 3,178 patients with T2DM. Specifically, a 49% decrease in OP risk was observed for each unit increase in BRI when the value of BRI was below 5.08. After the BRI went beyond this threshold, its protective effect ceased to be significant, implying that the benefit of increased BRI against OP lessened after a certain level. A study by Zhang et al. involving 8,899 U.S. people aged 50 years and older also demonstrated a significant L-shaped negative correlation between BRI and OP. 20 In their study, the threshold for BRI was determined to be 5.29, and for each unit increase in BRI, the risk of OP was reduced by 36%. This suggests that a negative association between BRI and OP risk was found in both studies, despite the different sample characteristics and populations. The study also noted that appropriate weight gain was effective in reducing the risk of OP, which is consistent with the findings of the present study and further emphasises the importance of weight management in bone health. Our study also revealed racial differences in the relationship between BRI and OP, which provides new insights into understanding the relationship between BRI and OP in patients with T2DM. Furthermore, a study by Ding et al. utilized BRI to evaluate the correlation between BRI and BMD in the US population over the age of 20 years. 15 The findings indicated that higher BRI might be associated with lower BMD, which consequently increases the risk of OP. Notably, subgroup analyses confirmed the consistency of this relationship across the majority of the population, except for individuals with a BMI below 25 kg/m2, further supporting the validity of BRI as an indicator of OP risk assessment. A more recent study of a Chinese population with T2DM found that the weight-adjusted waist circumference index exhibited a non-linear positive association with the risk of OP. 21 Despite the absence of a significant interaction in the subgroup analyses, this finding contrasts with our findings. Our study showed that BRI showed a nonlinear negative association with the risk of OP in T2DM, which may be related to differences in the characteristics of the study population, the choice of indicators for obesity assessment, and how confounders were adjusted.
Despite the existence of several potential mechanisms associated with the development of OP, the exact mechanism linking BRI and OP in patients with T2DM remains unclear. The negative association between BRI and OP may be influenced by several factors. Firstly, higher BRI is usually accompanied by increased abdominal adiposity, and these adipocytes not only store energy but also secrete a variety of hormones and cytokines, such as leptin and Adiponectin, which are important for bone metabolism.22–24 Obese individuals have higher leptin levels, and elevated leptin may regulate the secretion of bone metabolism-related hormones by affecting the hypothalamic-pituitary-adrenal axis, which in turn affects bone formation, whereas Adiponectin has anti-inflammatory and insulin resistance-improving effects, and excess visceral fat reduces Adiponectin secretion, which indirectly affects OP risk.25,26 Secondly, abnormal glucose metabolism and oxidative stress are prevalent in patients with T2DM. With poor glycaemic control, the accumulation of advanced glycosylation end products activates oxidative stress, which damages osteoblasts and promotes osteoclast activity, accelerating bone resorption and further exacerbating the risk of OP.27,28 In addition, inflammatory response is also a key factor. Individuals with higher BRI have increased secretion of inflammatory factors (e.g., TNF-α and IL-6) from abdominal adipose tissue, which not only directly inhibit osteoblast activity but also reduce the blood supply to the bone tissue by affecting the function of the vascular endothelium, which further affects the supply of nutrients to the skeleton and metabolism.29,30 T2DM is associated with a state of chronic inflammation throughout the body, and hyperglycemia can induce oxidative stress and inflammatory responses in tissues throughout the body. 31 The systemic inflammatory state interacts with local inflammation in the adipose tissue, leading to an increased systemic inflammatory load in patients with higher BRI and a more pronounced destructive effect on bone. In addition to this, we know that individuals with higher BRI usually weigh more, and the mechanical load exerted on the bone by increased body weight increases, and moderate mechanical loads contribute to bone growth and remodeling and promote bone density.32,33 However, when the weight is too heavy, it may lead to the overloading of joints and bones, which in turn affects bone health. 15
Our study has several strengths. Previous studies have focused on bone health in the general population, and relatively little research has been conducted on the relationship between BRI and OP risk in patients with T2DM. Therefore, our study focused on adult T2DM patients and aimed to delve into the key issues in this relationship. To improve the reliability of our findings, we adjusted for potential confounders, including demographic characteristics, laboratory test results, and chronic disease status. In addition, subgroup analyses were conducted in the study to explore the relationship between BRI and OP in different populations, which further emphasizes the need for more precise OP prevention strategies. However, there are some limitations to this study. Firstly, due to the cross-sectional study design, it was not possible to establish a causal relationship between BRI and OP in patients with T2DM; secondly, the study population was limited to the US population, resulting in conclusions that may not be able to be extrapolated to other populations; and lastly, although a variety of potential confounders have been adjusted for, there may still be unidentified factors that may have affected the results of the study. Therefore, future research should consider broader populations and prospective studies to further validate these findings and enhance their generalisability.
Conclusion
Our findings suggest that there is a negative association between BRI and OP risk in the US T2DM population and that this relationship is nonlinear. Specifically, the prevalence of OP does not consistently decrease as BRI increases. Maintaining appropriate and healthy levels of BRI may play a key role in preventing OP. Based on our findings, people with T2DM who have a BRI >5.08 may need to be concerned about bone health.
Footnotes
Acknowledgments
The authors are grateful for the time and dedication shown by the study participants during the NHANES project's data collection phase.
Declaration of conflicting interests
The author(s) declared no potential conflicts of interest with respect to the research, authorship, and/or publication of this article.
Funding
The author(s) received no financial support for the research, authorship, and/or publication of this article.