
Abstract
Background
The prevalence of both type 2 diabetes mellitus (T2DM) and osteoporosis has been increasing among older individuals, with these two health conditions often coexisting. Our aim in this study was to evaluate the association between T2DM status and bone mineral density (BMD) of the femoral neck among older adults in the United States.
Methods
This was a retrospective analysis of the data from 5695 adults, 60–80 years of age. The data were obtained from the National Health and Nutrition Examination Survey, for the following years: 2005–2006, 2007–2008, 2009–2010, 2013–2014, and 2017–2018. Weighted multivariable regression analyses, with subgroup analyses as appropriate, were performed to identify an association between T2DM/prediabetes status and femoral BMD and mediating factors.
Results
There was a significant positive association between T2DM/prediabetes status and femoral neck BMD among older women, but not men, after adjusting for body mass index (BMI). On subgroup analysis, stratified by BMI, the significant positive association was retained for T2DM women with a BMI of 25–29.9 kg/m2 (β, 0.030; 95% CI, 0.007–0.052) or ≥30 kg/m2 (β, 0.029; 95% CI, 0.007–0.05), and for prediabetes women with a BMI of 25–29.9 kg/m2 (β, 0.016; 95% CI, 0.001–0.030).
Conclusions
The association between a positive T2DM/prediabetes status and femoral neck BMD differed by sex among older individuals, with the association being further modulated by BMI. For women with a BMI of 25–29.9 kg/m2 or ≥30 kg/m2, T2DM was associated with a significantly higher femoral neck BMD, compared to the non-diabetes group.
Keywords
Introduction
Type 2 diabetes mellitus (T2DM) and osteoporosis are two aging-related health conditions that are increasing in prevalence and often coexist among older individuals. 1 In the United States (US), the prevalence rate of T2DM is estimated at 22% among older adults. 2 An adverse effect of T2DM on bone health has previously been reported, known as diabetes-induced osteoporosis, 3 with epidemiologic data having confirmed an increased risk of fracture in patients with T2DM.4–6
The pathophysiology of diabetes-induced osteoporosis is multifactorial in nature, although the underlying mechanisms remain to be fully elucidated. 7 Specifically, although type 1 diabetes mellitus (T1DM) has consistently been associated with decreased bone mineral density (BMD), findings on the association between T2DM and BMD have been inconsistent. 8 Studies indicate an association between Type 2 Diabetes Mellitus (T2DM) and increased Bone Mineral Density (BMD), contradicting the typical osteoporotic pattern. 9 Nevertheless, this seeming contradiction could be deceptive. The elevated risk of fractures in diabetic patients implies that factors other than BMD, like bone quality, may also be compromised. 10 The importance of cortical porosity and the effects of collagen crosslinking on bone material properties have been highlighted as significant factors influencing bone strength and fragility in T2DM.9,11 Clarifying this association would be important considering the increased focus on diabetes-induced osteoporosis among older adults.12,13 Accordingly, our aim in this study was to evaluate the association between T2DM status and femoral neck BMD among adults ≥60 years of age in the US, using data from the National Health and Nutrition Examination Survey (NHANES), from 2005 to 2018.
Methods
Data sources
The NHANES is a large, population-based, cross-sectional survey providing health and nutrition data for the national population of the US. These surveys were conducted by the National Center for Health Statistics (NCHS). For our study, we used the NHANES data from the following years (2005–2006, 2007–2008, 2009–2010, 2013–2014, and 2017–2018), as femoral neck BMD was not available for the 2011–2012 and 2015–2016 cycles.
Study population
Our study population included individuals from 60 to 80 years of age. After screening, the data from 5695 participants were included in our final analysis (Figure 1). Flowchart of participants included into analysis.
Statement of ethics
Our study methods were approved by the research ethics review board of the NCHS, with all participants providing informed consent for the use of their data for research and publication.
Study variables
The exposure variable was the T2DM status, where the presence of T2DM was defined by the following criteria: an HbA1c level ≥6.5% or diagnosis by a doctor for patients ≥30 years of age. A prediabetes status was defined by an HbA1c level of 5.7%–6.4% or diagnosis by a doctor.
The outcome variable was the femoral neck BMD, quantified by dual-energy X-ray absorptiometry (DXA; Hologic QDR-4500A fan-beam densitometer, Hologic, Bedford, MA). The following variables were entered as covariates: age, sex, ethnicity, body mass index (BMI), educational level, ratio of family income to poverty, fractured at hip, wrist or spine, moderate recreational activities, blood urea nitrogen, total protein, serum uric acid, serum glucose, serum phosphorus, and serum calcium. Detailed information on how these variables were collected can be found at https://www.cdc.gov/nchs/nhanes/.
Statistical analyses
Sampling weights were included in our analyses, as per the NCHS guidelines. Weighted multivariable regression analyses were performed to evaluate the association between T2DM status and femoral neck BMD. The following four regression models were evaluated: model 1, no adjustment for covariates; model 2, adjusted for age, sex, and ethnicity; model 3, adjusted as model two plus BMI; model 4, adjusted as model three plus all other covariates. Subgroup analyses were also performed to identify independent factors for significant models. All statistical analyses were performed using R software (version 3.4.3) and EmpowerStats software, with statistical significance set at a p-value <0.05.
Results
Weighted characteristic of study sample according to diabetes status.

Mean ± SD for continuous variables: p value was calculated by weighted linear regression model. % for categorical variables: p value was calculated by weighted chi-square test.
Association between diabetes status and femoral neck bone mineral density (g/cm2).

Model 1: No covariates were adjusted. Model 2: Age, sex, and race were adjusted. Model 3: Age, sex, race, and body mass index were adjusted. Model 4: Age, sex, race, body mass index, educational level, ratio of family income to poverty, ever fractured at hip, wrist or spine, moderate recreational activities, blood urea nitrogen, total protein, serum uric acid, serum glucose, serum phosphorus, and serum calcium were adjusted. *p < 0.05, **p < 0.01, ***p < 0.001.
Association between diabetes status and femoral neck bone mineral density (g/cm2), stratified by sex.
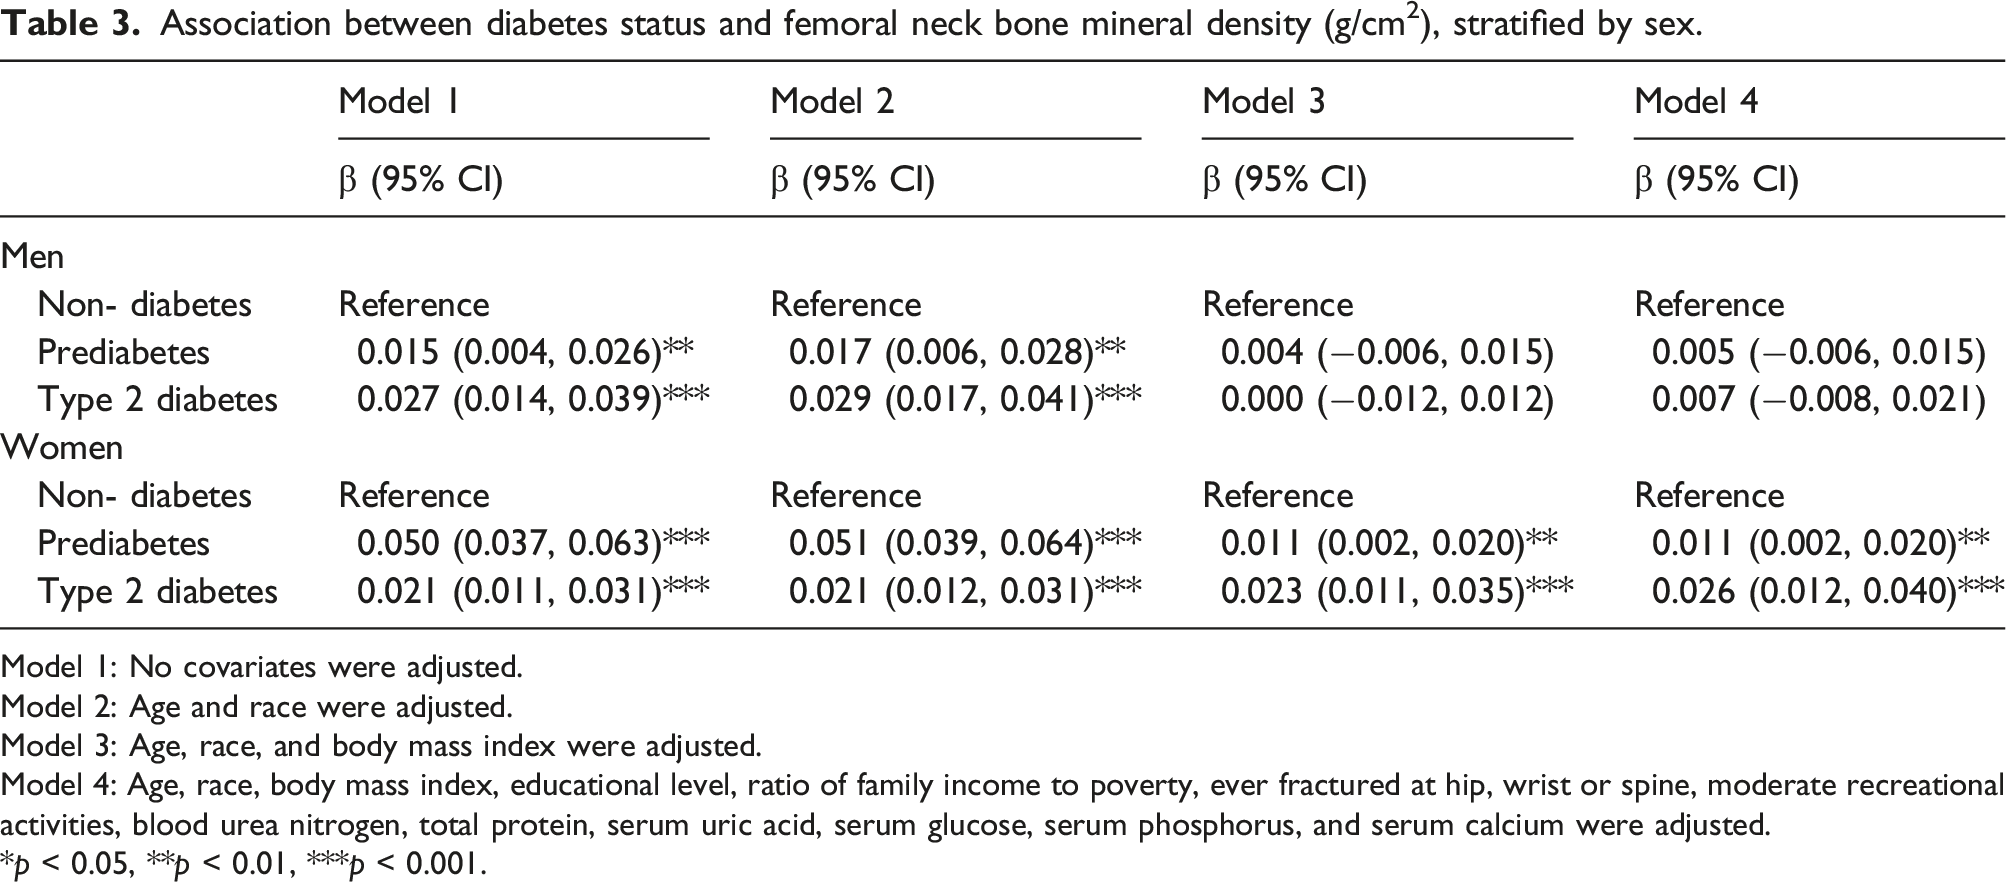
Model 1: No covariates were adjusted. Model 2: Age and race were adjusted. Model 3: Age, race, and body mass index were adjusted. Model 4: Age, race, body mass index, educational level, ratio of family income to poverty, ever fractured at hip, wrist or spine, moderate recreational activities, blood urea nitrogen, total protein, serum uric acid, serum glucose, serum phosphorus, and serum calcium were adjusted. *p < 0.05, **p < 0.01, ***p < 0.001.
Association between diabetes status and femoral neck bone mineral density (g/cm2), stratified by race.

Model 1: No covariates were adjusted. Model 2: Age and sex were adjusted. Model 3: Age, sex, and body mass index were adjusted. Model 4: Age, sex, body mass index, educational level, ratio of family income to poverty, ever fractured at hip, wrist or spine, moderate recreational activities, blood urea nitrogen, total protein, serum uric acid, serum glucose, serum phosphorus, and serum calcium were adjusted. *p < 0.05, **p < 0.01, ***p < 0.001.
Association between diabetes status and femoral neck bone mineral density (g/cm2), stratified by body mass index (kg/m2).

Model 1: No covariates were adjusted. Model 2: Age, and race were adjusted. Model 3: Age, race and body mass index were adjusted. Model 4: Age, race, body mass index, educational level, ratio of family income to poverty, ever fractured at hip, wrist or spine, moderate recreational activities, blood urea nitrogen, total protein, serum uric acid, serum glucose, serum phosphorus, and serum calcium were adjusted. *p < 0.05, **p < 0.01, ***p < 0.001.
Discussion
Herein, we evaluated the association between the T2DM status and femoral neck BMD among older individuals, with findings of a positive association between T2DM, prediabetes, and femoral neck BMD among women, but not among men.
The relationship between Type 2 Diabetes Mellitus (T2DM) and Bone Mineral Density (BMD) has garnered significant research attention. Prior studies have offered varied insights into this association. For instance, some research14–19 has suggested that individuals with T2DM tend to have higher BMD than non-diabetics, which initially appears paradoxical given the increased fracture risk observed in the diabetic population. However, these studies often did not account for critical variables such as sex differences and BMI, which can significantly impact BMD. In contrast, other studies have reported a neutral20–23 or even negative24,25 association between T2DM and BMD, particularly when considering the quality of bone rather than just density. These inconsistencies across various studies highlight the complexity of the relationship between diabetes and bone health, influenced by diverse factors ranging from the pathophysiology of diabetes to the effects of therapeutic interventions. BMI exerts a significant effect on this association, as individuals with T2DM commonly have a higher BMI, 26 which, itself, is associated with a higher BMD. A novel contribution of our study is the finding that the association between T2DM status and femoral neck BMD in older adults differed by sex, being significant only in women, after adjusting for BMI. Therefore, inconsistent conclusions from previous studies may reflect effects of sex, age, ethnicity, and other confounding variables, and BMI in particular.
The exact mechanisms underlying the association between T2DM and bone health remains to be fully clarified. It is known that BMD increases as a function of increasing levels of insulin. 14 Higher levels of insulin may stimulate osteoblasts and, indirectly, decrease collagen degradation, thus playing an important role in maintaining normal bone formation. 27 Paradoxically, while T2DM is associated with an increased BMD, it is also associated with an increased risk for skeletal fractures. 28 This risk for fractures can be partly explained by bone fragility and microfractures resulting from microvascular complications. 29 Other researchers suggest a “diabetes paradox” in type 2 diabetes, where increased fracture risk exists despite normal or high bone density. 30 This paradox stems from diabetes-related changes in bone physiology, leading to decreased bone remodeling and formation, resulting in bone with normal density but poor quality and altered microarchitecture. Thus, the negative effect of T2DM on bone health might be more closely related to poor bone quality, rather than solely on bone mass. As such, measurement of BMD by DXA alone may not be accurate to diagnose diabetes-induced osteoporosis.
A strength of our study is the large sample size and nationally representative dataset used. However, the limitations of our study must also be acknowledged. First, owing to the cross-sectional nature of the NHANES data, a cause-effect relationship between T2DM and bone health cannot be confirmed. Second, T2DM status was determined, in part, by self-report, which might be susceptible to bias. Of note, however, the interview and examination processes in the NHANES are completed using standardized protocols. Third, to minimize the number of participants with T1DM, we excluded participants with DM onset before age of 30 years, as previously reported.31,32 Fourth, this study included BMD at only at site of femoral neck, it is possible that different associations would be observed at other sites. Last, data regarding additional potential confounders were not included in this study, such as medication use, particularly thiazolidinediones, and co-morbidity like chronic obstructive pulmonary disease. Prospective studies are warranted to further confirm the influence of T2DM on bone health.
Conclusion
Our findings suggest that the association between T2DM status and femoral neck BMD differs by sex among older individuals and is influenced by BMI. After adjusting for covariates, we identified that older women with a positive T2DM or prediabetes status with a higher BMI had significantly higher femoral neck BMD compared to women with a non-diabetes status. Based on our findings, screening for bone health might be indicated for older women with a positive T2DM status who have a BMI ≥25 kg/m2.
Footnotes
Acknowledgements
The authors appreciate the time and effort given by participants during the data collection phase of the NHANES project.
Author contributions
B.W., C.H.S., and Z.X.Z. contributed to data collection, analysis and writing of the manuscript. Z.X.Z. contributed to study design and editing of the manuscript.
Declaration of conflicting interests
The author(s) declared no potential conflicts of interest with respect to the research, authorship, and/or publication of this article.
Funding
The author(s) received no financial support for the research, authorship, and/or publication of this article.