
Abstract
Purpose
This study aimed to investigate the association between weight-adjusted waist index (WWI) and trabecular bone score (TBS) and to assess the ability of WWI to identify individuals with degraded bone microarchitecture (DBMA).
Methods
This cross-sectional study included participants aged 20 and older from the National Health and Nutrition Examination Survey. Furthermore, WWI was calculated by waist circumference and body weight. In addition, linear regression models were employed to investigate the association between WWI and TBS, while logistic regression models were employed to determine the association between WWI and the risk of DBMA. Finally, the performance of WWI in identifying individuals with DBMA was using the receiver operating characteristic (ROC) curves with area under the ROC curve.
Results
A total of 4,179 participants with a mean age of 49.90 years were included in the final analysis. WWI was negatively associated with TBS and positively associated with an increased risk of DBMA. Furthermore, the associations between WWI and TBS, as well as DBMA risk, were stable regardless of stratification by age, sex, race, or body mass index (BMI). Moreover, WWI achieved good performances in identifying individuals with DBMA or low TBS. In addition, the combination of WWI and BMI showed better performances in identifying individuals with DBMA or low TBS than WWI or BMI alone.
Conclusion
WWI established a negative association with TBS and a positive association with the risk of DBMA. Clinicians should be alert to the potential risk of DBMA among individuals with high WWI. Moreover, WWI, alone or in combination with BMI, has the potential to serve as an early screening strategy in identifying individuals with DBMA.
Keywords
Brief introduction
Osteoporosis, a common chronic disease of aging, has been a profound public health issue with the increase of an aging population. 1 Osteoporosis has recently been considered one of the most challenging and unsolved problems due to its high prevalence and the associated cost related to public health services.2–5 Besides these reasons, fracture, a severe clinical outcome resulting from osteoporosis because of the reduction of bone mass and the deterioration of bone microarchitecture, has caused significant morbidity and mortality, especially in the middle-aged and elderly population.6,7 Therefore, the exploration of the effective approach to the prevention of fractures has attracted more and more attention and has become important in the management of osteoporosis.8,9
Bone mineral density (BMD) is a common indicator used to reflect bone health in clinical practice. 10 Several previous studies have shown that the reduction of BMD was an essential factor associated with the increased risk of fracture.11,12 However, a large number of studies observed that individuals with normal or even high BMD levels, such as subjects with type 2 diabetes, might present an increased risk of fracture.13,14 In other words, the ability of BMD to identify and predict the risk of fracture is limited in many cases. Trabecular bone score (TBS), measured through dual-energy X-ray absorptiometry (DXA), has been demonstrated to be a valuable indicator to reflect bone microarchitecture, in which the reduction of TBS has a strong association with degraded bone microarchitecture (DBMA).15,16 Moreover, several studies have indicated that TBS has a strong association with the risk of fracture and can serve as a better predictor for fracture risk than BMD.17,18 Therefore, the identification of the modifiable risk factors and/or early predictors associated with the reduction of TBS might have great clinical and public health significance in the prevention of fractures.
Obesity status is tightly related to bone health. 19 Body mass index (BMI), the commonly used measure to reflect body fatness, has been demonstrated to be associated with TBS, in which individuals with higher BMI showed lower TBS than those with lower BMI.20,21 Weight-adjusted waist index (WWI), a novel anthropometric index to assess adiposity, has been proven to be uniquely valuable in the prediction of disease risk compared with BMI, such as cardiometabolic disease or kidney stone.22,23 Furthermore, several previous studies observed that WWI was associated with BMD and the risk of osteoporosis.24–27 However, the relationship between WWI and TBS is still unknown, and it remains unclear whether WWI can serve as an early predictor for DBMA.
Therefore, the purpose of the present study was to investigate the association between WWI and TBS, as well as the risk of DBMA. Moreover, this study aimed to assess the ability of WWI to identify individuals with DBMA. We hypothesized that WWI established a negative association with TBS and a positive association with the risk of DBMA.
Materials and methods
Study design and population
The cross-sectional study included participants from the National Health and Nutrition Examination Survey (NHANES) 2007-2008. NHANES,
28
conducted by the National Center for Health Statistics (NCHS) of the Centers for Disease Control (CDC) in the United States (US), was designed to evaluate the health and nutritional status of US residents, with data being released biennially. Moreover, the NHANES protocol has been granted approval by the ethics review board of the NCHS.
29
In addition, all individuals participating in the NHANES study have been provided with and have duly signed the informed consent document.
30
In this study, the inclusion criteria for participants were set as follows: (i) age 20 years and older; (ii) with complete TBS data; and (iii) with complete WWI data. Furthermore, subjects were further excluded if they had missing covariates data (see details in the Covariates section). Finally, 4,179 eligible participants were included in the subsequent analysis (Figure 1). Flowchart of the study population selection. NHANES, National Health and Nutrition Examination Survey; TBS: trabecular bone score; WWI: weight-adjusted waist index.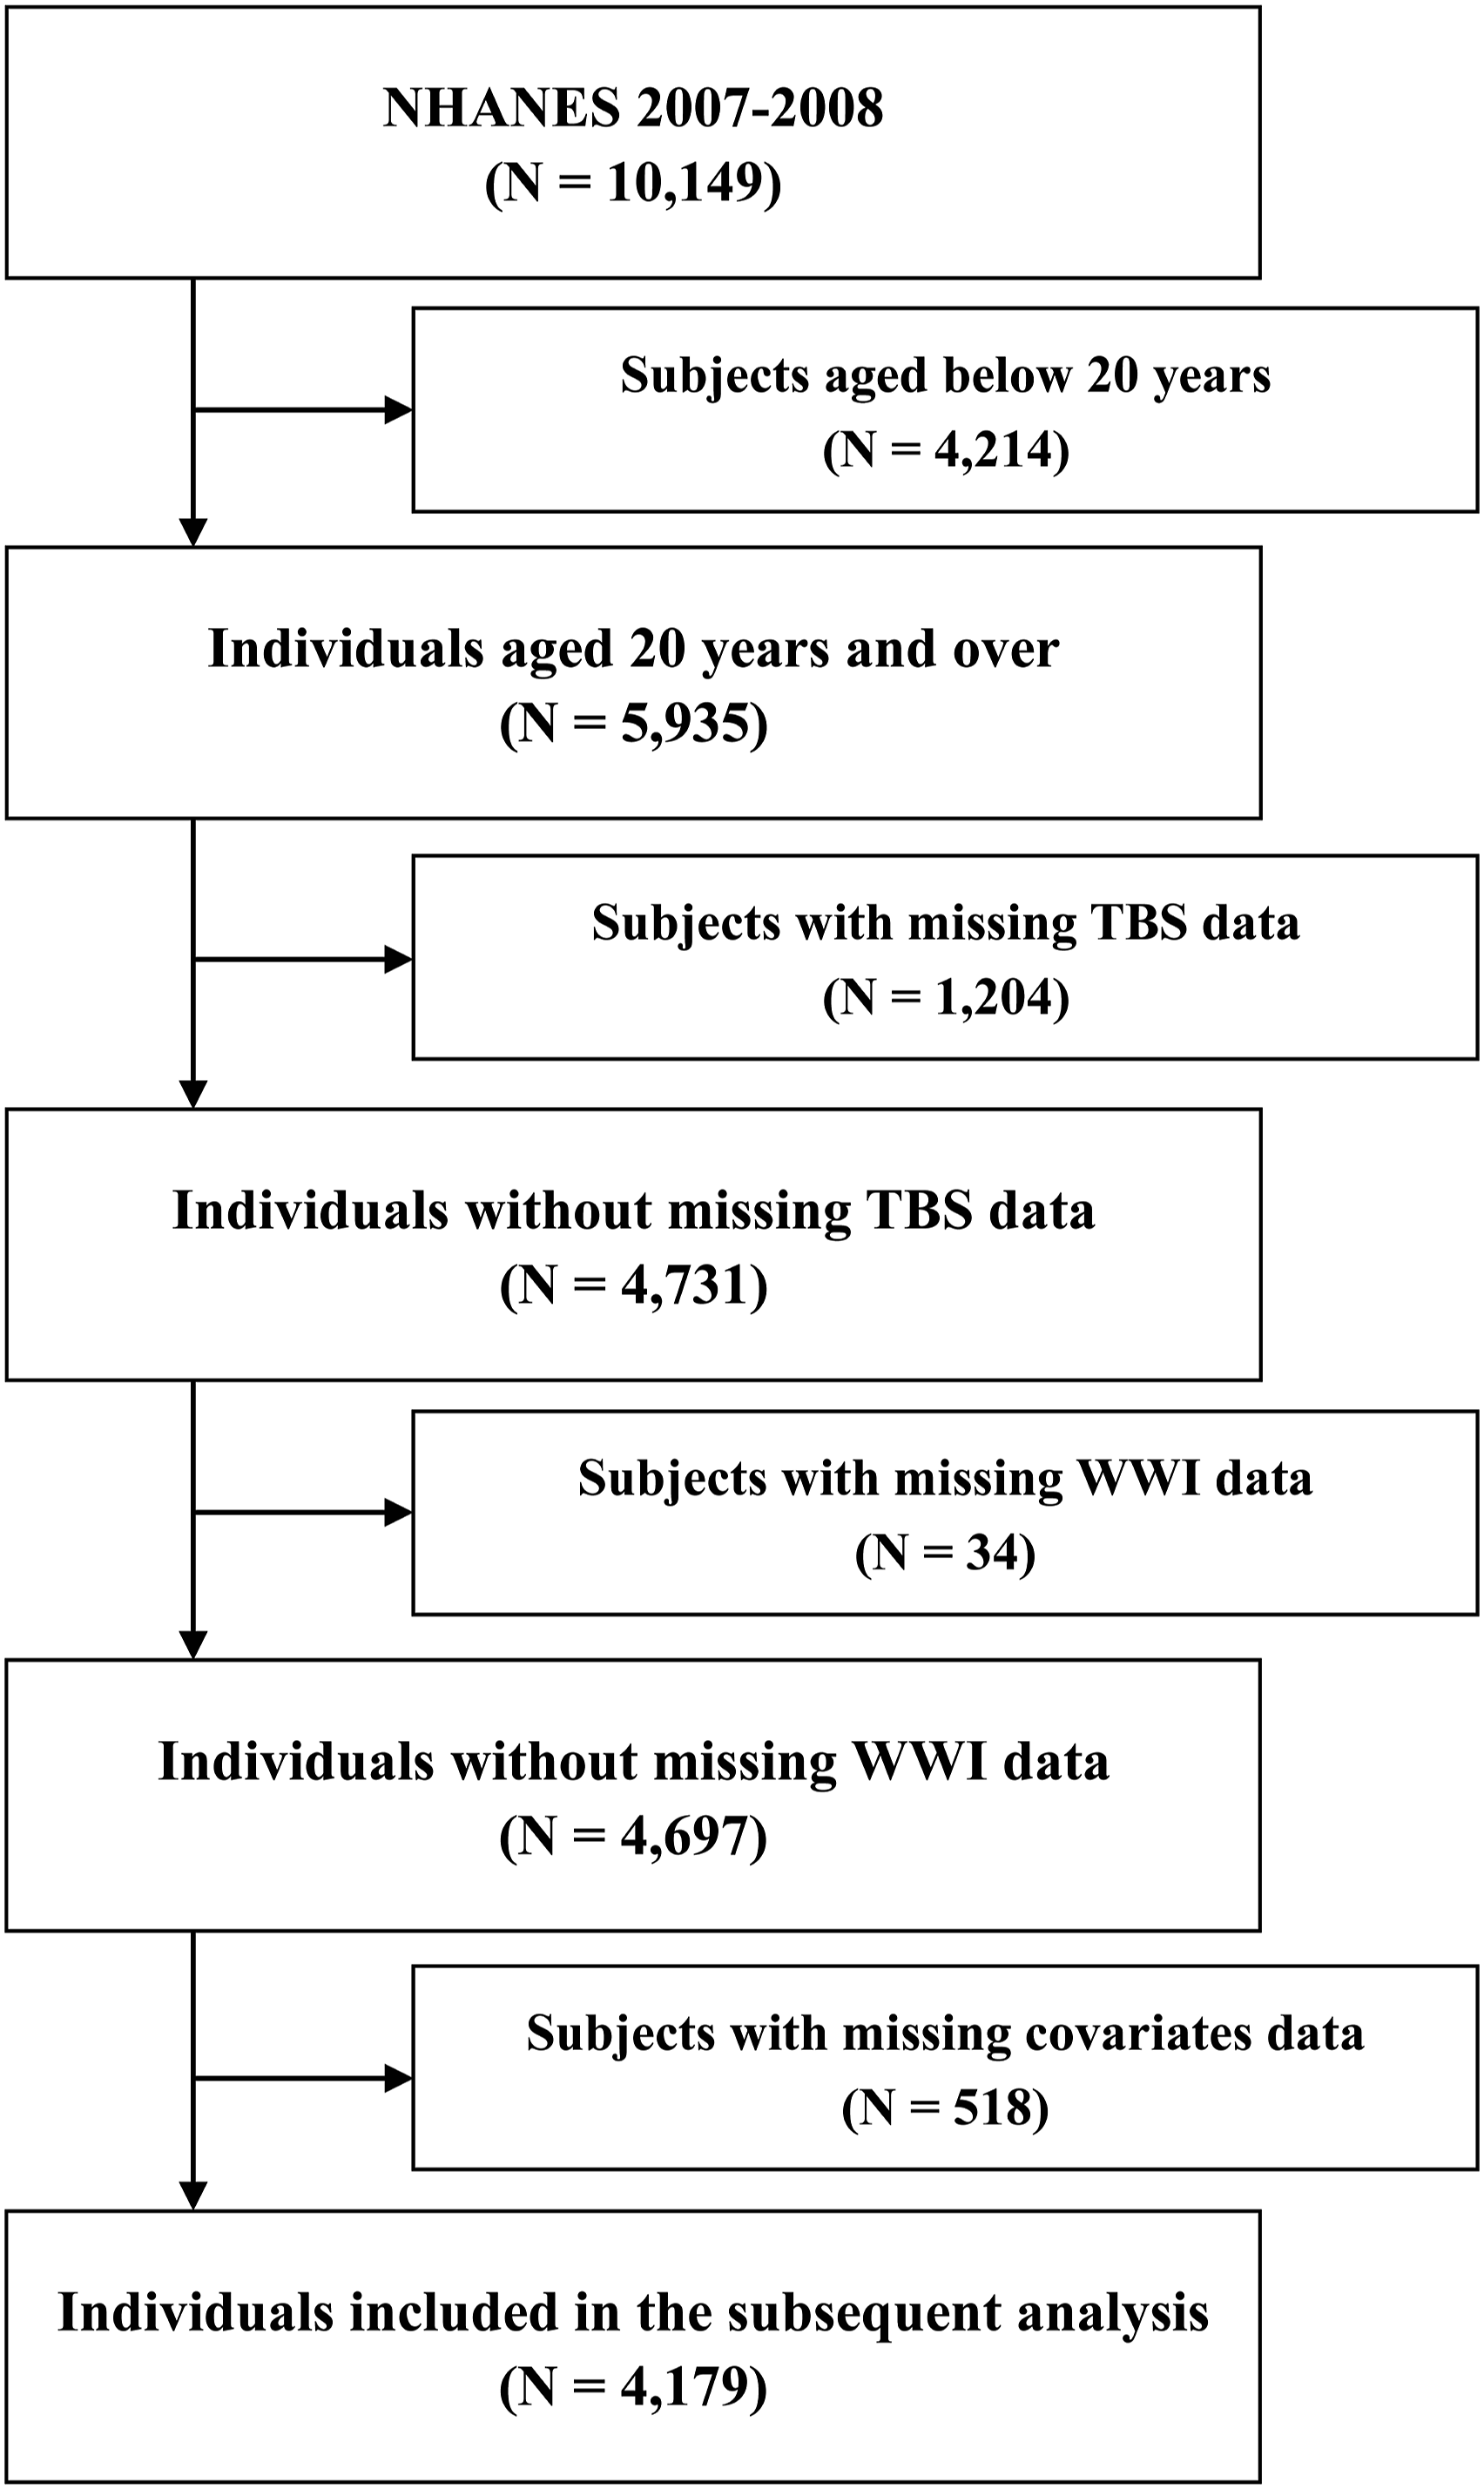
WWI assessment
WWI was assessed by body weight and waist circumference (WC), which were measured through physical examinations. Moreover, WWI was calculated as WC (in centimeters) divided by the square root of body weight (in kilogram).22,27 In addition, detailed procedures to assess body weight and WC are provided on the NHANES website. 31
TBS measurement
All eligible participants underwent TBS measurements using DXA spine scans performed by experienced radiology technologists. Moreover, all participants were categorized into two groups as follows: (i) individuals with DBMA (TBS ≤ 1.230); (ii) individuals with partially DBMA (PDBMA) (1.310 > TBS > 1.230); and (iii) individuals with normal microarchitecture (NBMA). 16 In addition, participants with DBMA or PDBMA were considered participants with low TBS. Other detailed information regarding TBS measurements can be found on the NHANES website. 32
Covariates
This study included several covariates in the subsequent analysis, considering the potential associations between covariates and TBS, which were reported by previous studies.15,33 Finally, age, sex (and menopausal status) (postmenopausal women, premenopausal women, and men), race, education level, BMI, smoking status, drinking status, calcium intake, vitamin D intake, milk product consumption, physical activity levels, history of hypertension, history of diabetes, history of arthritis, history of cancer, history of fractures, history of glucocorticoids use, albumin (Alb), alanine aminotransferase (ALT), aspartate aminotransferase (AST), blood urea nitrogen (BUN), serum creatine, and C-reaction protein (CRP) were considered as the potential covariates. In addition, detailed information regarding covariates is listed in Supplemental Table S1.
Statistical analysis
Baseline characteristics of the study population grouped by WWI (tertile 1, 2, or 3) were expressed as means ± standard deviation (SD) (for continuous variables) and number (percent) (for categorical variables). Covariates with a p-value below 0.1 in univariate analysis were selected to be adjusted in the subsequent regression analysis. Furthermore, multi-collinearity was evaluated by the variable inflation factor (VIF), in which a VIF value above five indicated the existence of multi-collinearity. Moreover, univariate and multivariate linear regression models were employed to investigate the association between WWI and TBS, while univariate and multivariate logistic regression models were employed to determine the association between WWI and the risk of DBMA. In addition, receiver operating characteristic (ROC) curves were plotted, and the areas under the ROC curve (AUC) were calculated to evaluate the performances of WWI in identifying individuals with DBMA, in which AUC ≥ 0.90, 0.80 ≤ AUC < 0.90, and 0.70 ≤ AUC < 0.80 were considered excellent, good, and fair discriminatory ability, respectively. AUC differences were calculated using the DeLong test. The optimal cutoff value was determined by the maximized Youden index (Youden index = sensitivity + specificity − 1). Additionally, sensitivity, specificity, positive predictive value (PPV), and negative predictive value (NPV) were calculated. Finally, subgroup analyses were performed based on stratification factors, including age, sex (and menopausal status), race, and BMI. All statistical analyses were conducted using R version 4.2.1 (https://cran.r-project.org/) and EmpowerStats version 4.2 (http://www.empowerstats.com). A p-value below 0.05 was considered statistically significant.
Results
Baseline characteristics
Baseline characteristics of the study population.
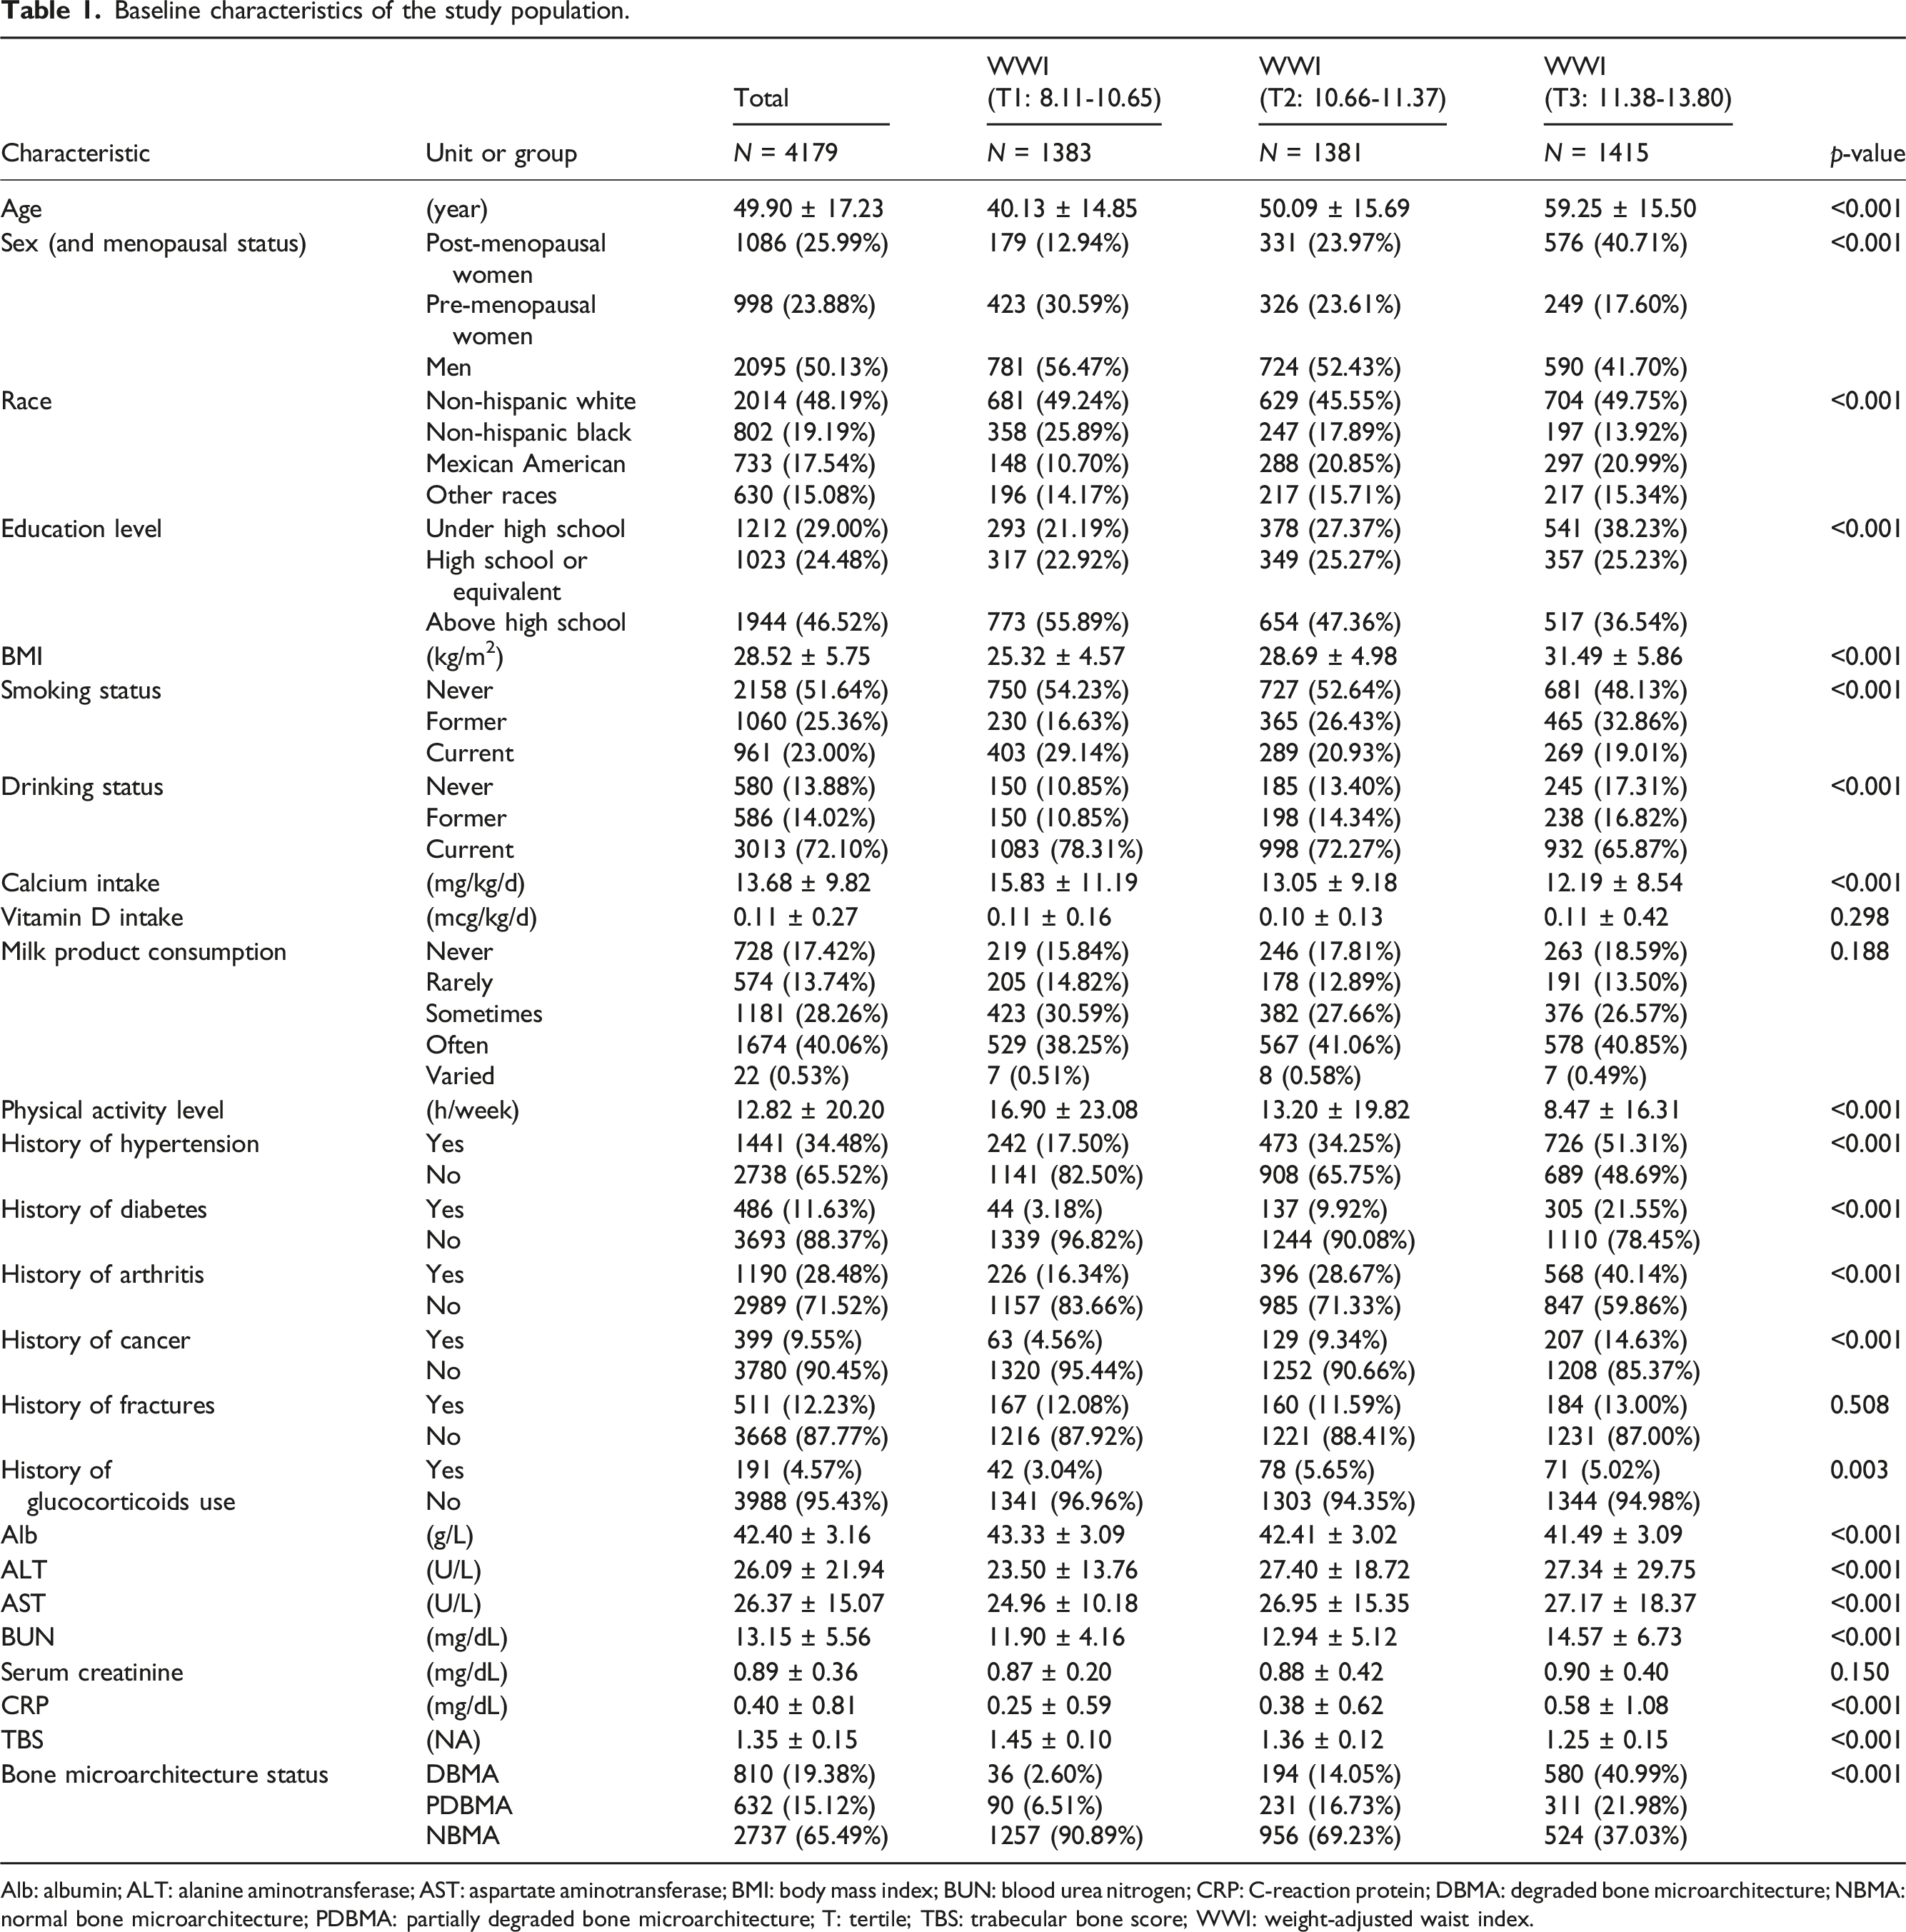
Alb: albumin; ALT: alanine aminotransferase; AST: aspartate aminotransferase; BMI: body mass index; BUN: blood urea nitrogen; CRP: C-reaction protein; DBMA: degraded bone microarchitecture; NBMA: normal bone microarchitecture; PDBMA: partially degraded bone microarchitecture; T: tertile; TBS: trabecular bone score; WWI: weight-adjusted waist index.
Selection of covariates
The univariate linear regression model was employed to assess the association between covariates and TBS (Supplemental Table S2). All covariates except vitamin D intake (p-value = .448) were included in the subsequent regression analysis. In addition, there was no evidence of multi-collinearity between WWI and covariates, which were included in the subsequent regression analysis (Model three in regression analysis. See below) (Supplemental Table S3).
Association between WWI and TBS
Association between WWI (continuous variable) and TBS.

Normal weight: BMI < 25 kg/m2; Overweight: 25 ≤ BMI < 30 kg/m2; Obesity: BMI ≥ 30 kg/m2.
BMI: body mass index; CI: confidence interval; TBS: trabecular bone score; WWI: weight-adjusted waist index.
Association between WWI and DBMA
Association between WWI (continuous variable) and DBMA.
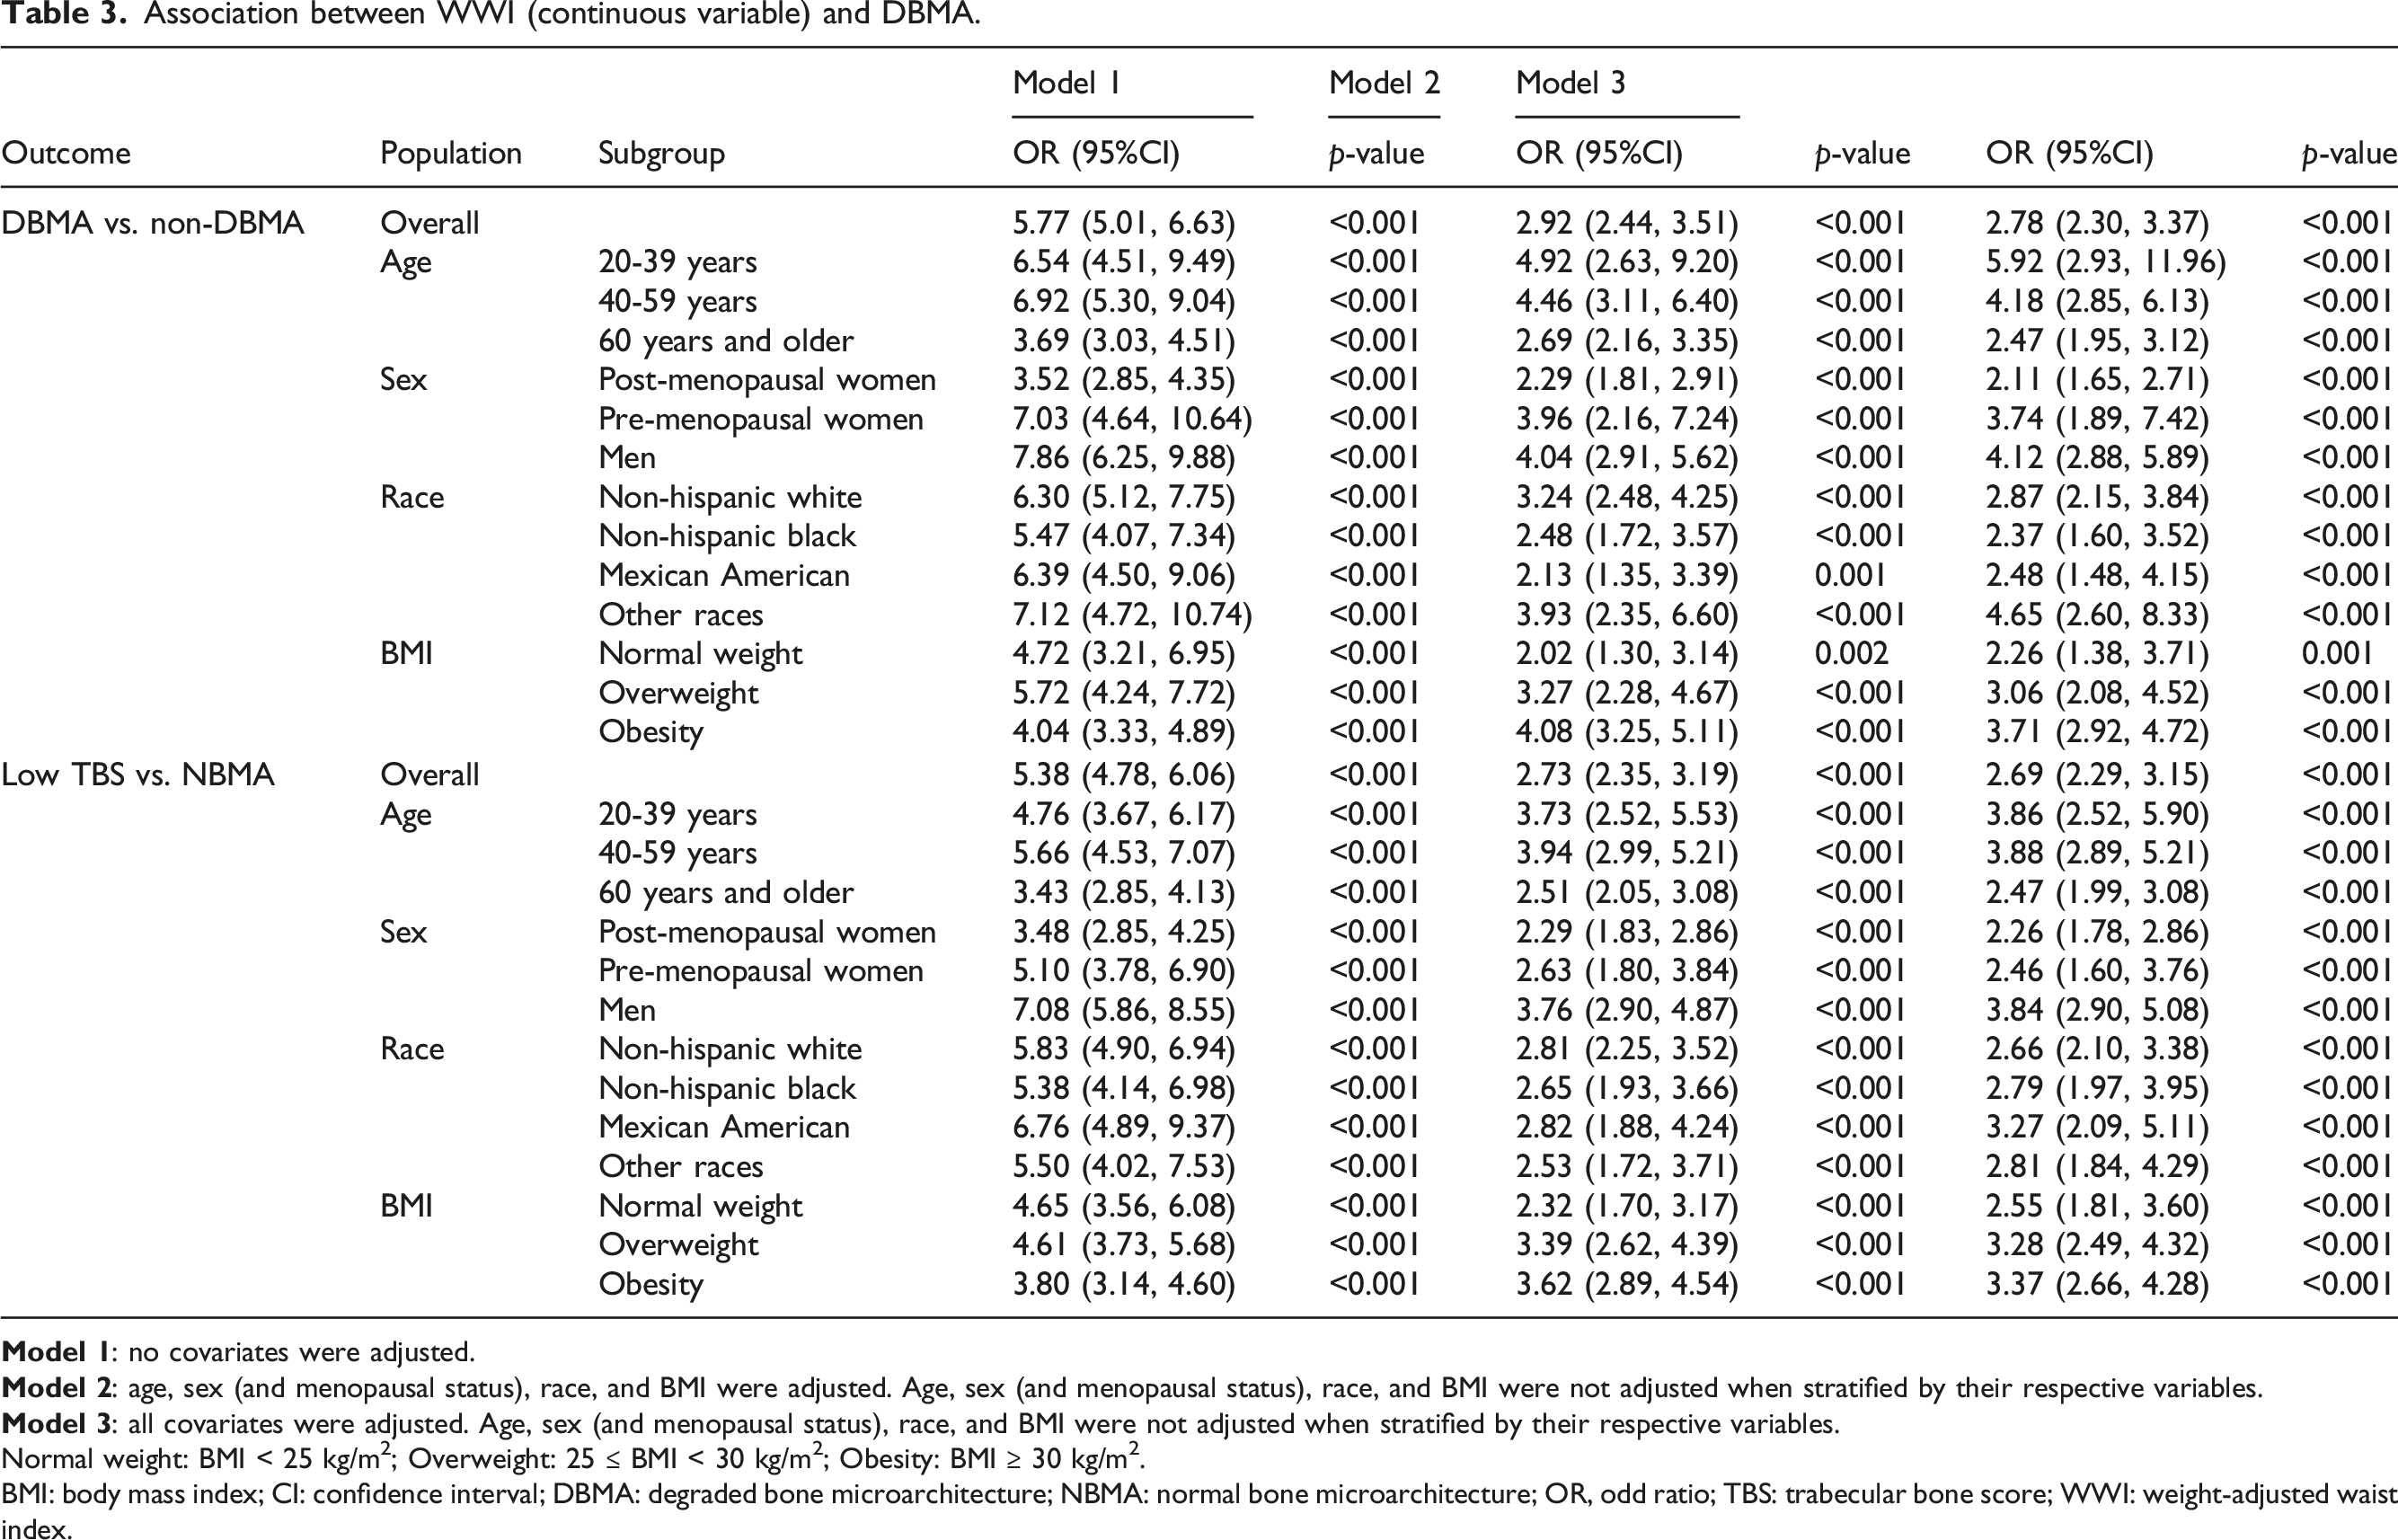
Normal weight: BMI < 25 kg/m2; Overweight: 25 ≤ BMI < 30 kg/m2; Obesity: BMI ≥ 30 kg/m2.
BMI: body mass index; CI: confidence interval; DBMA: degraded bone microarchitecture; NBMA: normal bone microarchitecture; OR, odd ratio; TBS: trabecular bone score; WWI: weight-adjusted waist index.
Performances of WWI in identifying individuals with DBMA
Performances of WWI in identifying individuals with DBMA.

Normal weight: BMI < 25 kg/m2; Overweight: 25 ≤ BMI < 30 kg/m2; Obesity: BMI ≥ 30 kg/m2.
BMI: body mass index; DBMA: degraded bone microarchitecture; NPV: negative predictive value; PPV: positive predictive value; TBS: trabecular bone score; WWI: weight-adjusted waist index.
This study compared the performances in identifying individuals with DBMA or low TBS between WWI and BMI (Figure 2). There were no statistical differences in AUC (outcome: DBMA) between WWI and BMI. However, WWI showed a significantly higher AUC value than BMI for identifying individuals with low TBS. In addition, the combination of WWI and BMI had significantly higher AUC values than WWI or BMI (outcome: DBMA or low TBS). Performances for identifying individuals with DBMA or low TBS between WWI and BMI. AUC, area under curve; BMI: body mass index; DBMA: degraded bone microarchitecture; TBS: trabecular bone score; WWI: weight-adjusted waist index.
Discussion
This cross-sectional study investigated the association between WWI and TBS and evaluated the ability of WWI to identify individuals with DBMA among adults aged 20 years and older. Finally, the main findings of the present study indicated that WWI showed strong negative associations with TBS and positive associations with DBMA and low TBS risk. Furthermore, this study demonstrated that WWI or the combination of WWI and BMI achieved good discrimination in identifying individuals with DBMA or low TBS. Therefore, WWI has the potential to be a useful indicator for identifying individuals at high risk for DBMA or low TBS.
The present study observed that WWI had a negative association with TBS and a positive association with the risk of DBMA. There were several possible reasons for these findings, as follows. Firstly, high WWI might suggest fat mass accumulation, especially increased visceral adiposity.34,35 Excessive visceral fat was demonstrated to be associated with metabolic disturbances, such as insulin resistance. 36 Moreover, these factors mentioned above negatively affect the bone microarchitecture, as reflected by the reduction of TBS.37,38 Secondly, high WWI might suggest elevated levels of inflammation. The cumulative evidence indicated that elevated inflammation was associated with increased bone resorption and impaired bone formation, which might contribute to the reduction of TBS.39,40 Thirdly, WWI might be associated with unhealthy lifestyle habits, such as insufficient physical activity levels or inadequate calcium intake, which might be associated with the reduction of TBS. Furthermore, these lifestyle factors mentioned above have been demonstrated to play important roles in bone health.41,42 Although speculative, this study actually observed that participants with higher WWI had higher physical activity levels and calcium intake than those with lower WWI (Table 1). However, additional studies are required to support our hypothesis.
In this study, we observed that WWI (T2) in some subgroups was not associated with an increased risk of DBMA compared with WWI (T1). We consider the possible reasons as follows. On the one hand, the relationship between WWI and the risk of DBMA in some specific subgroups might be nonlinear. This study found that participants in the WWI (T3) group showed a significantly increased risk of DBMA compared with those in the WWI (T1) group, while there were no significant differences in the risk of DBMA between the WWI (T2) group and the WWI (T1) group within some subgroups, such as participants aged 60 years and older and women (Supplemental Table S6). Therefore, WWI may establish a nonlinear relationship with the risk of DBMA in some specific subgroups. Moreover, the findings above indicated that the population differences require further consideration when WWI is employed as an indicator to predict DBMA in future studies. On the other hand, the sample sizes of several subgroups were relatively small, such as Mexican American (N = 733, 17.54%), which might affect the accuracy of the results and also suggested additional studies with large sample sizes are required to confirm our results. Finally, it is essential to emphasize that the definitive reasons can only be ascertained through additional research and inquiry. The aforementioned hypotheses are conjectural and would necessitate more targeted investigations to explore the relationship between WWI and the risk of DBMA.
The potential differences in the discrimination of WWI in identifying individuals with DBMA in different populations were observed in subgroup analyses. For example, this study observed that WWI showed higher AUC values in identifying individuals with DBMA among pre-menopausal women than post-menopausal women. One possible explanation for this finding is as follows. WWI might be associated with several factors that were demonstrated to be linked to bone metabolism, such as inflammation levels and lifestyle factors, which might contribute to the good performances of WWI in identifying individuals with DBMA. However, the reasons for the cause of DBMA might be different between pre-menopausal women and post-menopausal women, in which the decline of endogenous estrogens might play a more important role among post-menopausal women than pre-menopausal women. 43 Therefore, WWI showed a limited ability to identify individuals with DBMA, and it might be meaningful to consider limiting the subject population when WWI was used to identify individuals with DBMA in clinical practice. In addition, this study observed that the sample sizes of individuals with DBMA were different between pre-menopausal women (N = 71) and post-menopausal women (N = 357), which might contribute to the differences in different populations.
This study demonstrated that the combination of WWI and BMI showed better performances in identifying individuals with DBMA or low TBS than WWI or BMI. One possible reason for this finding may be as follows. Although WWI and BMI were the indicators used to reflect obesity, WWI, calculated by body weight and WC, seemed to be a better indicator than BMI to reflect central obesity, especially visceral adiposity.44,45 Moreover, a weak correlation between WWI and BMI was taken into consideration when designing the formula for calculating WWI. 22 In addition, the finding observed in the present study suggested that WWI combined with other indicators (including, but not limited to, BMI) might have potential values in identifying individuals with DBMA or low TBS.
The main findings of the present study might have implications for clinical practice and future research. On the one hand, this study found that WWI was negatively associated with TBS and positively associated with the risk of DBMA, in which a high WWI might indicate an increased risk of DBMA. Therefore, clinicians should be vigilant of the risk of DBMA or even fracture among individuals with high WWI, and further evaluation of bone health might be warranted. On the other hand, WWI might serve as a potential indicator to identify individuals with decreased levels of TBS, considering DXA was costly and time-consuming. Moreover, the exploration of the value of WWI in combination with other indicators to predict the risk of DBMA or even fracture might be a practical topic for future research.
This study might have some strengths, as follows. To our knowledge, the present study was the first to comprehensively evaluate the association between WWI and TBS and the ability of WWI to identify individuals with DBMA. Furthermore, the generalization of the main findings to the general population might be facilitated, considering a nationally representative sample was included in the present study. This study had some limitations, as follows. The causal directionality between WWI and TBS cannot be drawn because of the cross-sectional study design. Furthermore, the sample size of individuals with DBMA was relatively small (N = 810). In addition, information on several covariates, such as the history of hypertension or diabetes, was collected based on self-reports, which might result in recall bias and influence the results. Finally, there might be time gaps between several clinical variables included in this study, which might lead to a potential risk of bias. Therefore, additional prospective studies with large sample sizes are required to strengthen the evidence.
Conclusion
WWI established a negative association with TBS and has been demonstrated reasonably good discrimination for DBMA. Therefore, clinicians should be alert for the potential risk of DBMA among individuals with high WWI, and WWI has the potential to serve as an early predictor in identifying individuals with DBMA.
Supplemental material
Supplemental material - Weight-adjusted waist index is a potential early predictor of degraded bone microarchitecture: A cross-sectional study of the national health and nutrition examination survey 2007-2008
Supplemental Material for Weight-adjusted waist index is a potential early predictor of degraded bone microarchitecture: A cross-sectional study of the national health and nutrition examination survey 2007-2008 by Baoguo Mi, Jitao Zhang, Kuo Jiang, Hailan Meng, Lequn Shan and Dingjun Hao in Orthopaedic Surgery
Footnotes
Acknowledgments
We thank for Dr Yuchen Tang for assistance with data analysis.
Declaration of conflicting interests
The author(s) declared no potential conflicts of interest with respect to the research, authorship, and/or publication of this article.
Funding
The author(s) disclosed receipt of the following financial support for the research, authorship, and/or publication of this article: This work was supported by the Key Project of the National Natural Science Foundation of China (81830077) and the Key Research and Development Program of Shaanxi Province (2023-YBSF-667).
Supplemental Material
Supplemental material for this article is available online.