
Abstract
Objective
The effect of iron on bone metabolism in children and adolescents remains largely unknown. This study examined the association of serum ferritin with bone mineral density and bone turnover markers in this population.
Methods
We used data from the 1999–2002 National Health and Nutrition Examination Survey, including serum ferritin, lumbar bone mineral density, bone turnover markers (serum bone alkaline phosphatase and urinary N-telopeptides), and relevant covariates. Weighted multivariate linear regression analyses and smooth curve fitting were conducted to investigate the association of ferritin with bone mineral density and bone turnover markers. Additionally, subgroup and threshold effect analyses were also performed.
Results
A total of 1527 participants were included in the study. Ferritin was positively correlated with bone mineral density only in the unadjusted model. In the overall population, all models showed negative correlations between ferritin and serum bone alkaline phosphatase and urinary N-telopeptides. In subgroup analyses, these associations remained significant in males but not in females. Smooth curve fitting demonstrated nonlinear relationships between ferritin and serum bone alkaline phosphatase and urinary N-telopeptides, with inflection points identified at 41 ng/mL and 16 ng/mL, respectively.
Conclusions
Our study demonstrated an inverse, nonlinear association between ferritin and bone turnover markers, primarily observed in males. The identified inflection points suggest a threshold effect, highlighting the importance of maintaining adequate iron levels for bone health, particularly in male children and adolescents.
Keywords
Introduction
Iron, an essential trace element, is crucial for cellular homeostasis and function. 1 Iron deficiency disrupts energy metabolism and oxygen delivery, resulting in anemia, weakness, immune dysfunction, and cognitive impairment. 2 In contrast, iron is also a transition metal that can catalyze the production of reactive oxygen species, which can cause substantial damage to nucleic acids, proteins, lipids, and other vital cellular components. 3 Previous studies have reported that excessive iron accumulation was involved in the pathogenesis of various diseases, including diabetes, liver disease, heart failure, and cancer.4–7
The relationship between body iron status and bone mineral density (BMD) has recently received increasing attention. Accumulating evidence indicates that excessive iron exerts detrimental effects on bone health. In vitro studies have revealed that excess iron can suppress osteoblastic differentiation 8 but enhance osteoclast activity. 9 Similarly, animal studies have shown that mice with iron overload exhibited increased oxidative stress and bone resorption, resulting in alterations in bone microarchitecture and material properties. 10 Consistently, several clinical studies have explored the relationship between BMD and iron storage status reflected by serum ferritin; however, the findings remain controversial. Two studies reported a negative association between serum ferritin and BMD among Korean women aged ≥45 years,11,12 whereas another study reported opposite results among older Korean men. 13 Chon et al. 14 revealed that elevated serum ferritin levels were significantly associated with BMD in premenopausal women but not in postmenopausal women. Peng et al. 15 found that negative correlation existed between serum ferritin and lumbar BMD predominantly in females aged ≥45 years but not in other groups. Regarding the effect of iron on bone turnover markers (BTMs), Abiri et al. 16 observed a significant increase in C-terminal telopeptides (CTXs) among participants receiving 12 weeks of vitamin D supplementation but not in those receiving vitamin D and iron supplementation. However, Toxqui et al. 17 reported no significant change in aminoterminal telopeptide of collagen I (NTx) levels after 16 weeks of iron supplementation in iron-deficient women. The reasons for these discrepancies remain unclear; however, differences in iron and hormonal status may play a role.
Unlike mid-aged and older populations, children and adolescents undergo a rapid phase of skeletal growth and accumulation. This phase represents a critical period for attaining peak bone mass and is a key determinant of lifelong skeletal health and osteoporosis risk in later adulthood. 18 Furthermore, iron status differs markedly across age groups. Data from the Canadian Health Measures Survey revealed the highest prevalence of iron deficiency among children and adolescents, whereas the prevalence of iron overload was highest in the older population. 19 To date, the relationship between body iron status and BTMs and BMD in children and adolescents remains largely unknown. Therefore, elucidating this relationship during this formative developmental window is crucial. It may identify modifiable factors influencing the trajectory of bone acquisition, thereby informing early-life nutritional and public health strategies aimed at optimizing peak bone mass and preventing adult-onset skeletal diseases, including osteoporosis. Therefore, we conducted this study to investigate the effect of serum ferritin on BTMs and BMD in this population.
Materials and methods
Data source
The National Health and Nutrition Examination Survey (NHANES) is a continuous cross-sectional survey conducted by the Centers for Disease Control and Prevention (CDC). It provides comprehensive information on the health and nutritional status of the noninstitutionalized US population across all age groups. The NHANES protocols were approved by the National Center for Health Statistics Ethics Review Board, and all participants provided written informed consent for the use of their data in research. 20
Study population
In the present study, we used data from two 2-year cycles of NHANES (1999–2000 and 2001–2002). The research was conducted in accordance with the Declaration of Helsinki, as revised in 2024. The inclusion criteria were as follows: (a) participants <20 years old; (b) availability of complete data on lumbar spine BMD, serum bone alkaline phosphatase (sBAP), urinary N-telopeptides (uNTx), and serum ferritin; (c) absence of conditions that can alter serum ferritin levels, including pregnancy, anemia, inflammation (C-reactive protein (CRP) > 5 mg/L), and liver conditions (alanine aminotransferase (ALT) or aspartate aminotransferase (AST) > 100 U/L). We excluded participants who were ≥20 years (n = 10,291); pregnant (n = 76); receiving treatment for anemia (n = 155); had ALT levels >100 U/L (n = 32), AST levels >100 U/L (n = 3), CRP levels >5 mg/L (n = 6); or had missing data for serum ferritin (n = 2905), lumbar BMD (n = 3178), sBAP (n = 47), and uNTx (n = 2784). The screening process is shown in Figure 1.

Participant selection flowchart.
Data on serum ferritin, lumbar BMD, sBAP, uNTx, and other confounding factors were extracted and analyzed for all included participants.
Study variables
Independent variable
The independent variable, serum ferritin (ng/mL), was obtained from laboratory examination data. Participants were not required to fast before specimen collection. Whole blood and serum samples were processed, stored, and shipped to the Inorganic Toxicology and Nutrition Branch, Division of Laboratory Sciences, National Center for Environmental Health for analysis. Serum ferritin concentrations were measured using the Bio-Rad Laboratories’ QuantImune Ferritin immunoradiometric assay (IRMA) kit, a single-incubation, two-site IRMA. 21 IRMA measures the most basic isoferritin, and the highly purified 125I-labeled antibody against ferritin serves as the tracer. Ferritin antibodies were immobilized on polyacrylamide beads as the solid phase. Serum or ferritin standards (prepared from human liver) were mixed with the combined tracer/solid-phase antibody reagent, and the mixture was incubated. During incubation, the immobilized and 125I-labeled antibodies bound to the ferritin antigen in the serum samples or standards, forming a “sandwich.” After incubation, the beads were diluted with saline, centrifuged, and decanted. The level of 125I-labeled ferritin in the pellets was measured using a gamma counter. The amount of endogenous ferritin in serum samples or standards was directly proportional to the radioactive levels of the pellets. A detailed description of the laboratory methods used is provided in the Laboratory Methods Documentation section (https://wwwn.cdc.gov/nchs/nhanes/continuousnhanes/labmethods.aspx?BeginYear=2001).
Dependent variables
Dependent variables included lumbar spine BMD (gm/cm2), sBAP (µg/L), and uNTx (nmol bone collagen equivalents (BCE)). Dual-energy x-ray absorptiometry (DXA) scan was used to measure the lumbar BMD. Tandem-MP Ostase immunoEnzymetric assay (NHANES 1999–2001) and Beckman Access Ostase assay (NHANES 2002) were used to measure serum sBAP. Competitive inhibition enzyme-linked solid-phase immunosorbent assay (Osteomark; NHANES 1999–2001) and Vitros Eci competitive assay (NHANES 2002) were used to quantitatively measure uNTx levels in human urine. 22
Covariates
According to previous studies, several important variables affecting bone metabolism, including demographic characteristics, nutritional status, and inflammatory status, were considered as covariates.15,22,23 Demographic data, including age (years), sex (male or female), and race or ethnicity (Hispanic, non-Hispanic White, non-Hispanic Black, and other races), were retrieved. Body mass index (BMI; kg/m2) was calculated from body measurements. Complete blood count with a five-part differential was used to measure white blood cell (WBC) count (SI) and hemoglobin levels (g/dL). Total protein (g/dL), albumin (g/dL), globulin (g/dL), ALT (U/L), AST (U/L), total cholesterol (mg/dL), high-density lipoprotein (HDL) cholesterol (mg/dL), total calcium (mg/dL), phosphorus (mg/dL), and uric acid (mg/dL) were measured using a Hitachi 704 analyzer (Boehringer Mannheim Diagnostics; Indianapolis, IN). CRP levels were quantified using latex-enhanced nephelometry. Glycohemoglobin was measured using the Primus automated high-performance liquid chromatography (HPLC) system (Primus I, Model CLC330).
Statistical analysis
The statistical packages R 3.4.3 (https://www.r-project.org/) and EmpowerStats 2.0 (http://www.empowerstats.com) were used for data analysis, and P <0.05 was considered statistically significant. All estimates were calculated after accounting for NHANES sample weights. A weighted linear regression model was used for continuous variables, and a weighted chi-square test was applied for categorical variables to compare the baseline characteristics of the included participants. Weighted multivariable linear regression analyses were conducted to investigate the associations between ferritin and lumbar BMD, sBAP, and uNTx. Subgroup analyses stratified by sex were also performed. Generalized additive models (GAMs) and smooth curve fitting were applied to detect nonlinear relationships. When nonlinearity was present, a two-piecewise linear regression model was used to analyze the threshold effect.
Results
Based on the inclusion and exclusion criteria, 1527 participants aged 8–19 years were included in the final analysis. Of these, 86.117% were males and 13.883% were females, with mean ages of 13.601 ± 3.443 years and 18.543 ± 0.498 years, respectively. Compared with females, males were more likely to exhibit higher levels of glycohemoglobin, hemoglobin, albumin, AST, ALT, total calcium, phosphorus, uric acid, serum ferritin, sBAP, and uNTx as well as lower levels of BMI, WBC count, CRP, globulin, total cholesterol, HDL cholesterol, and lumbar BMD (Table 1).
Baseline characteristics of study participants.
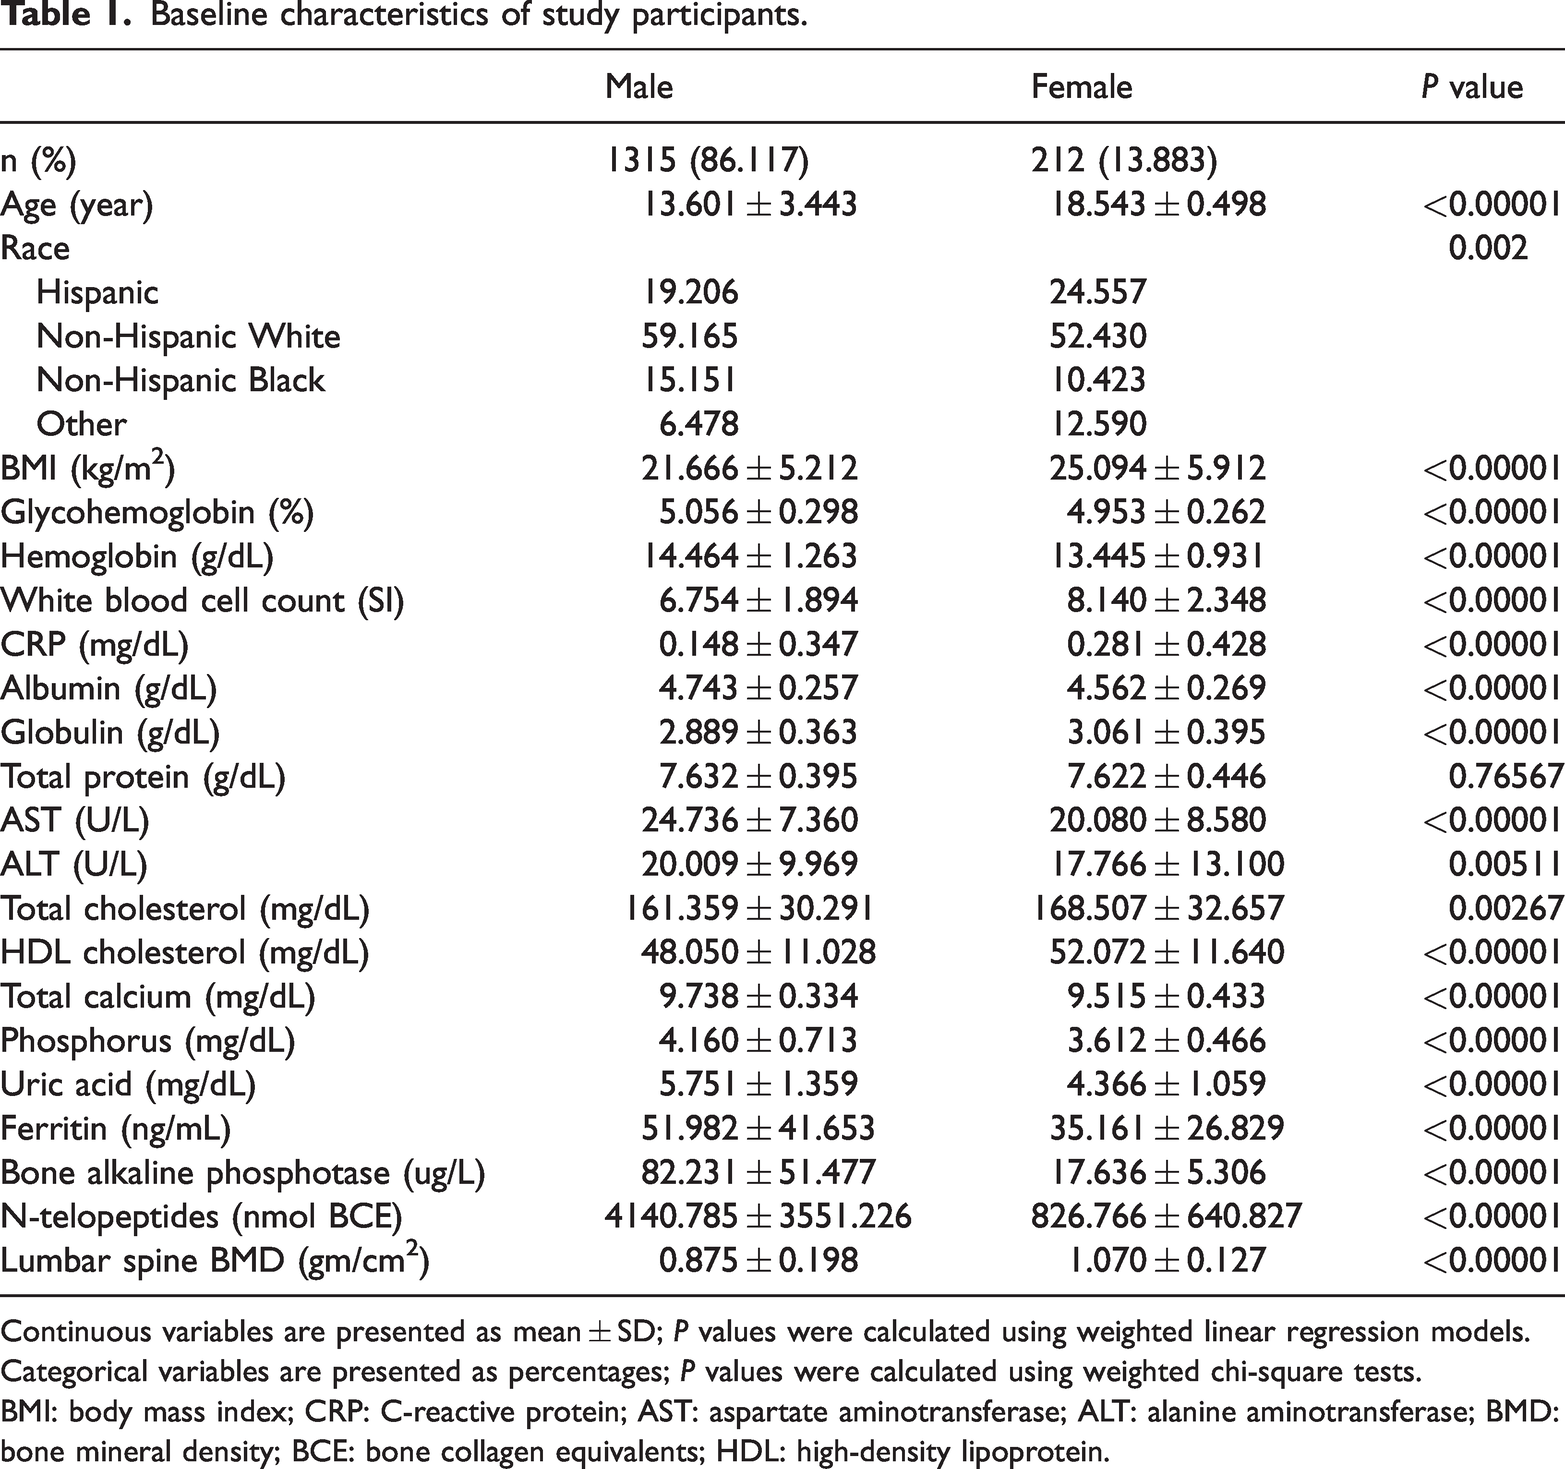
Continuous variables are presented as mean ± SD; P values were calculated using weighted linear regression models. Categorical variables are presented as percentages; P values were calculated using weighted chi-square tests.
BMI: body mass index; CRP: C-reactive protein; AST: aspartate aminotransferase; ALT: alanine aminotransferase; BMD: bone mineral density; BCE: bone collagen equivalents; HDL: high-density lipoprotein.
Association between serum ferritin and lumbar BMD
The association between serum ferritin and lumbar BMD was assessed using multivariate linear regression analysis. Unadjusted and adjusted results are presented in Table 2. In Model 1, serum ferritin was positively associated with lumbar BMD (β = 0.002, 95% confidence interval (CI): 0.001 to 0.002). However, after adjusting for covariates, we observed no significant associations in Model 2 (β = 0.000, 95%CI: −0.000 to 0.000) and Model 3 (β = −0.000, 95% CI: −0.000 to 0.000). In males, a positive association was observed between serum ferritin and lumbar BMD only in Model 1 (β = 0.002, 95% CI: 0.002 to 0.002), whereas in females, there was no significant correlation between serum ferritin and lumbar BMD.
Association between serum ferritin and lumbar BMD.

Model 1: no covariates were adjusted.
Model 2: age, sex, and race were adjusted.
Model 3: age, sex, race, BMI, WBC, hemoglobin, total protein, albumin, globulin, ALT, AST, total cholesterol, HDL cholesterol, glycohemoglobin, total calcium, phosphorus, uric acid, and CRP were adjusted.
BMD: bone mineral density; β: regression coefficient; CI: confidence interval; BMI: body mass index; WBC: white blood cell count; ALT: alanine aminotransferase; AST: aspartate aminotransferase; HDL: high-density lipoprotein; CRP: C-reactive protein.
Association between serum ferritin and sBAP
In the overall population, serum ferritin was negatively correlated with sBAP across all models. In addition, trends across serum ferritin tertiles remained statistically significant in all models (P for trend < 0.001). When stratified by sex, negative associations were observed between serum ferritin and sBAP in males across all models. Contrarily, in females, we identified a positive association in Model 1 (β = 0.034, 95% CI: 0.008 to 0.061) and Model 2 (β = 0.032, 95% CI: 0.007 to 0.058); however, this association was not significant in Model 3 (β = 0.026, 95% CI: −0.005 to 0.057) (Table 3).
Association between serum ferritin and sBAP.

Model 1: no covariates were adjusted.
Model 2: age, sex, and race were adjusted.
Model 3: age, sex, race, BMI, WBC, hemoglobin, total protein, albumin, globulin, ALT, AST, total cholesterol, HDL cholesterol, glycohemoglobin, total calcium, phosphorus, uric acid, and CRP were adjusted.
sBAP: serum bone-specific alkaline phosphatase; β: regression coefficient; CI: confidence interval; BMI: body mass index; WBC: white blood cell count; ALT: alanine aminotransferase; AST: aspartate aminotransferase; HDL: high-density lipoprotein; CRP: C-reactive protein.
Association between serum ferritin and uNTx
In the overall population, all models showed significant negative associations between serum ferritin and uNTx (Table 4). Higher serum ferritin levels were associated with lower uNTx levels (P for trend <0.001 in all models). Compared with the group with lowest ferritin, uNTx decreased by 471.824 nmol BCE and 813.441 nmol BCE in the intermediate and highest ferritin groups, respectively. In the subgroup analysis, the association between serum ferritin and uNTx remained significant only in males across all models.
Association between serum ferritin and uNTx.
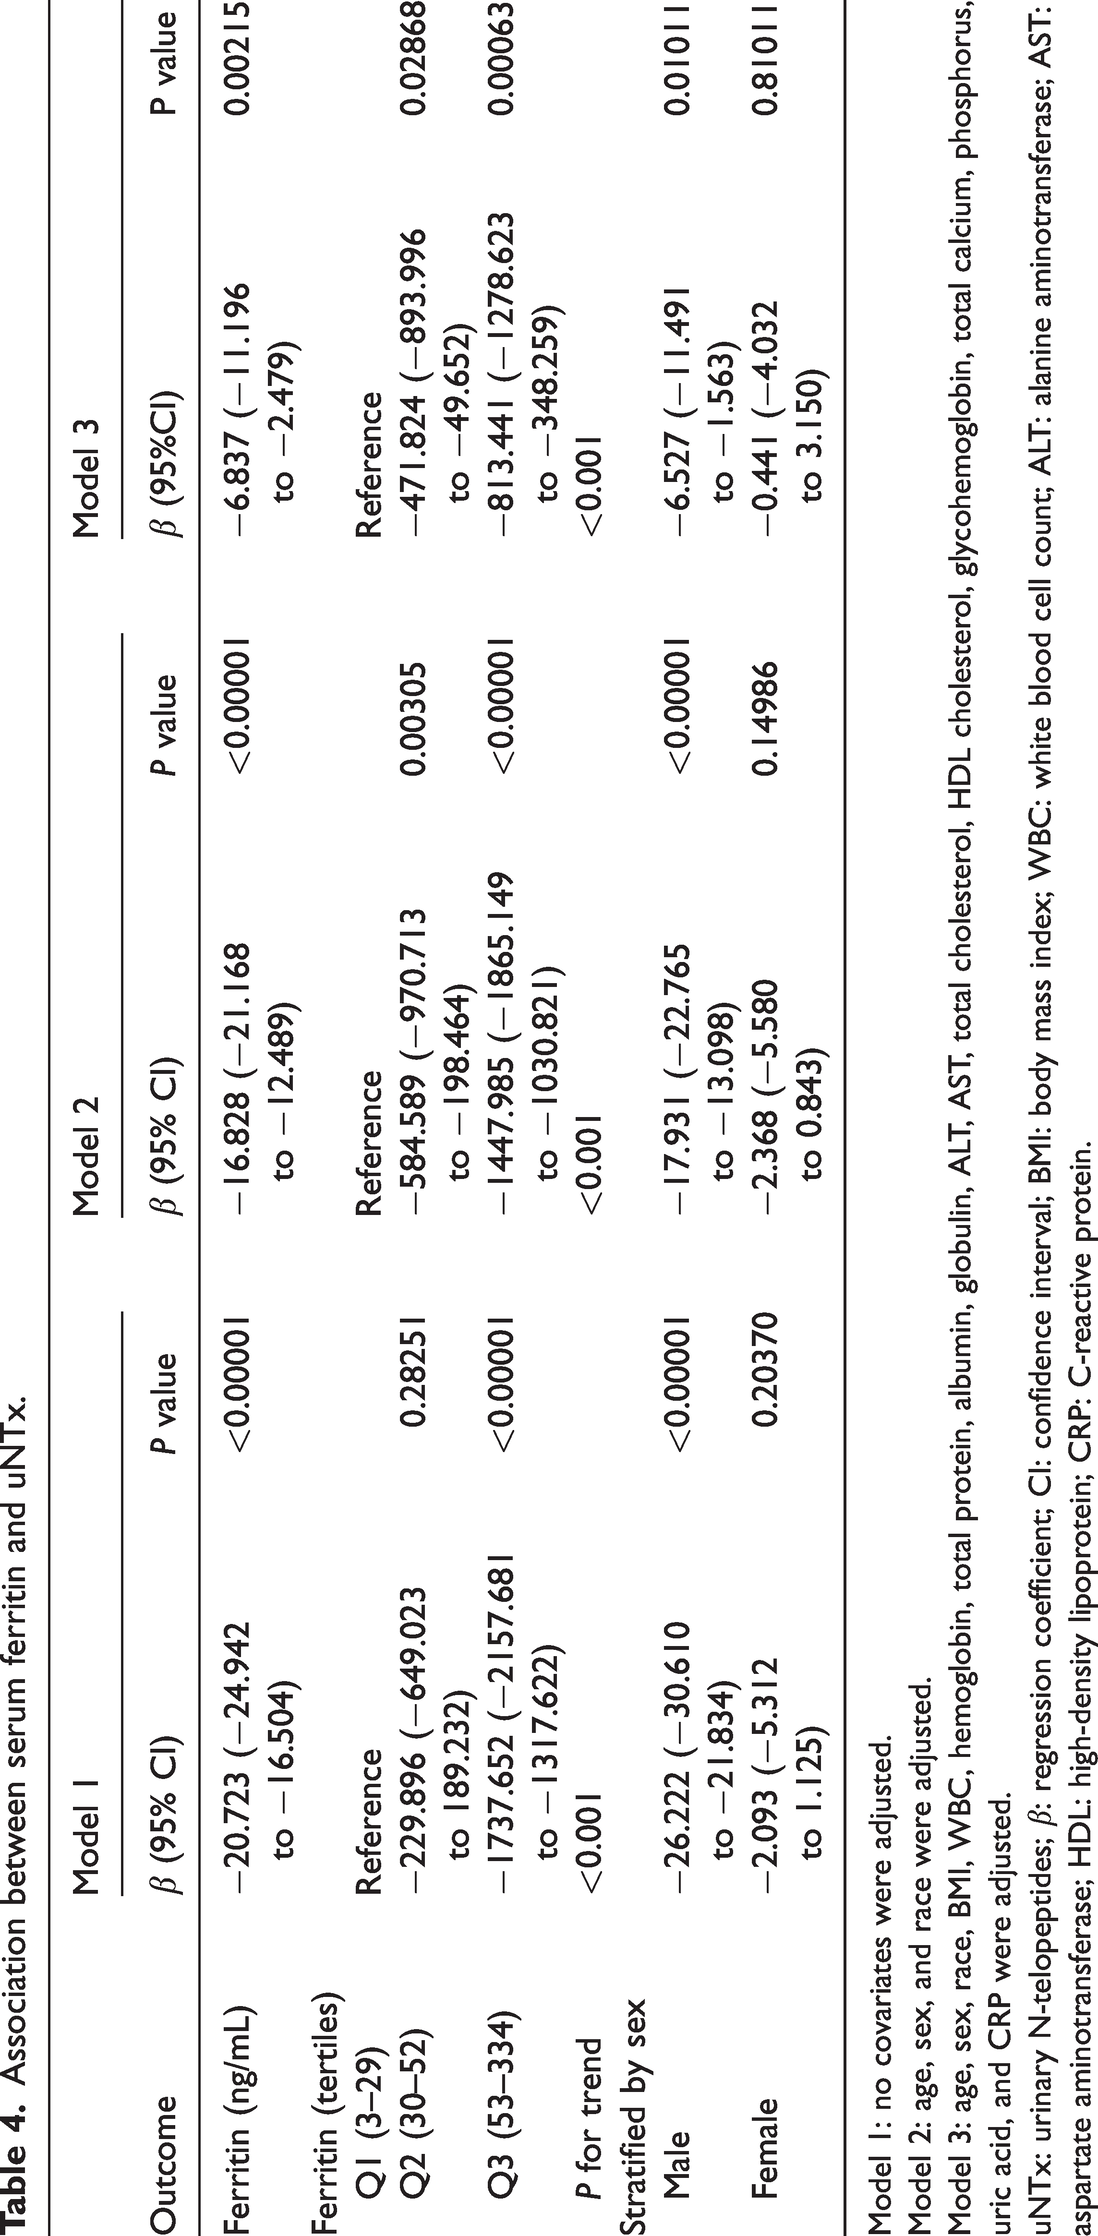
Model 1: no covariates were adjusted.
Model 2: age, sex, and race were adjusted.
Model 3: age, sex, race, BMI, WBC, hemoglobin, total protein, albumin, globulin, ALT, AST, total cholesterol, HDL cholesterol, glycohemoglobin, total calcium, phosphorus, uric acid, and CRP were adjusted.
uNTx: urinary N-telopeptides; β: regression coefficient; CI: confidence interval; BMI: body mass index; WBC: white blood cell count; ALT: alanine aminotransferase; AST: aspartate aminotransferase; HDL: high-density lipoprotein; CRP: C-reactive protein.
Threshold effect analysis
GAM and smooth curve fitting showed a nonlinear association between serum ferritin and sBAP (Figure 2). When stratified by sex, this nonlinear relationship remained significant in males, with the inflection point identified at 41 ng/mL. When serum ferritin levels were below 41 ng/mL, a one-unit increase in serum ferritin was associated with a 1.075-unit decrease in sBAP. However, when serum ferritin levels exceeded 41 ng/mL, no significant relationship was observed between serum ferritin and sBAP (Figure 3 and Table 5).

Association between serum ferritin and sBAP. (a) Each black point represents a sample and (b) The solid red line represents the smooth curve fit between the variables. Blue bands represent the 95% of confidence interval from the fit. sBAP: serum bone-specific alkaline phosphatase.

Association between serum ferritin and sBAP stratified by sex. sBAP: serum bone-specific alkaline phosphatase.
Threshold effect analysis of serum ferritin on sBAP in males using the two-piecewise linear regression model.
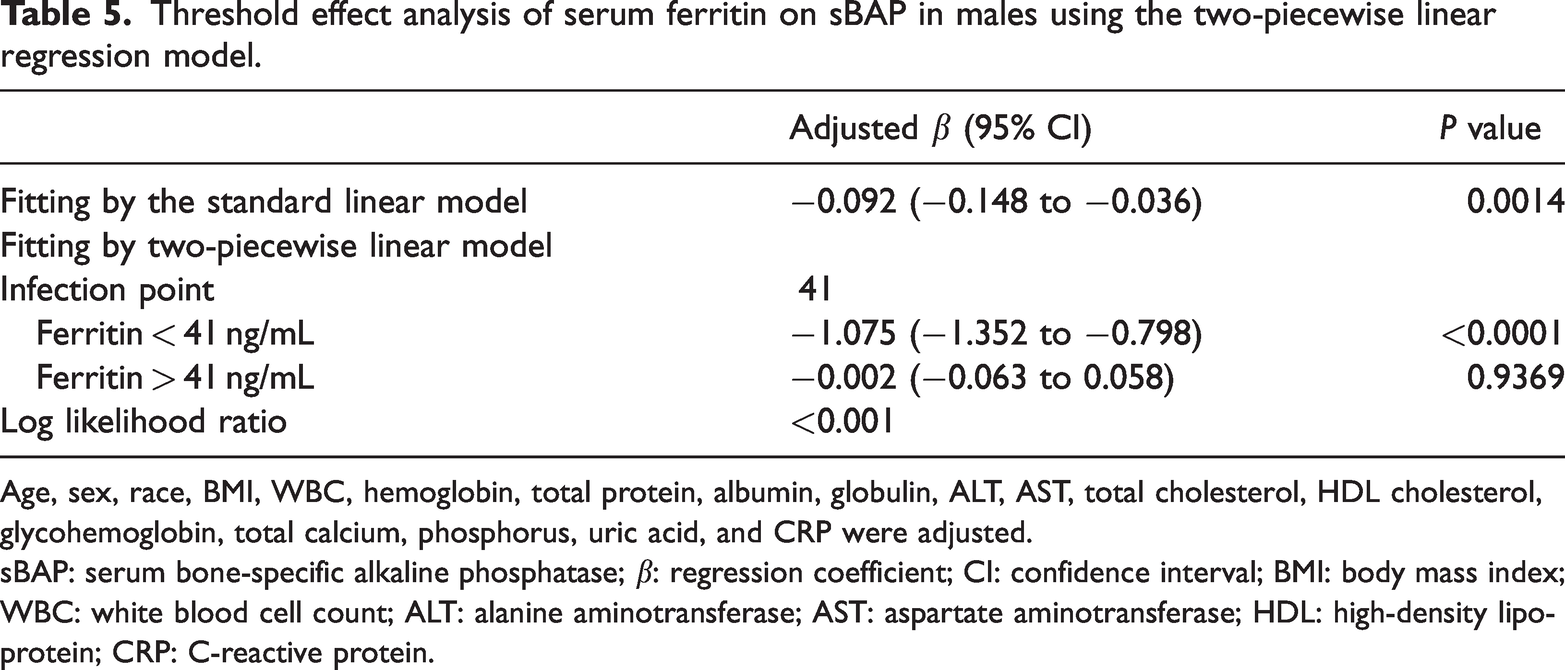
Age, sex, race, BMI, WBC, hemoglobin, total protein, albumin, globulin, ALT, AST, total cholesterol, HDL cholesterol, glycohemoglobin, total calcium, phosphorus, uric acid, and CRP were adjusted.
sBAP: serum bone-specific alkaline phosphatase; β: regression coefficient; CI: confidence interval; BMI: body mass index; WBC: white blood cell count; ALT: alanine aminotransferase; AST: aspartate aminotransferase; HDL: high-density lipoprotein; CRP: C-reactive protein.
Similarly, a nonlinear association was observed between serum ferritin and uNTx (Figure 4). In sex-stratified analyses, the nonlinear relationship remained significant in males, with the inflection point identified at 16 ng/mL. When serum ferritin levels were below 16 ng/mL, a one-unit increase in serum ferritin was associated with a 425.852-unit decrease in uNTx. However, when serum ferritin levels exceeded 16 ng/mL, a one-unit increase in serum ferritin was associated with a 5.671-unit decrease in uNTx (Figure 5 and Table 6).

Association between serum ferritin and uNTx. (a) Each black point represents a sample and (b) The solid red line represents the smooth curve fit between the variables. Blue bands represent the 95% of confidence interval from the fit. uNTx: urinary N-telopeptides.

Association between serum ferritin and uNTx stratified by sex. uNTx: urinary N-telopeptides.
Threshold effect analysis of serum ferritin on uNTx in males using the two-piecewise linear regression model.

Age, sex, race, BMI, WBC, hemoglobin, total protein, albumin, globulin, ALT, AST, total cholesterol, HDL cholesterol, glycohemoglobin, total calcium, phosphorus, uric acid, and CRP were adjusted.
uNTx: urinary N-telopeptides; β: regression coefficient; CI: confidence interval; BMI: body mass index; WBC: white blood cell count; ALT: alanine aminotransferase; AST: aspartate aminotransferase; HDL: high-density lipoprotein; CRP: C-reactive protein.
Discussion
Bone is a highly dynamic tissue that undergoes continuous remodeling throughout life. Bone mass peaks in the early 20s and declines considerably after the mid-40s.1,2 The remodeling process is influenced by age; sex; and hormonal, biochemical, and mechanical factors. Recently, the effect of iron status on bone metabolism has garnered increasing attention; however, the findings remain controversial. Moreover, this relationship is poorly understood in children and adolescents. Our findings suggest that iron deficiency may disrupt the delicate balance between bone formation and resorption, and that maintaining an appropriate iron level is essential for bone homeostasis in children and adolescents.
Childhood and adolescence are critical periods for skeletal development and bone mass accrual. 18 BMD increases throughout childhood and accelerates during adolescence, 24 with approximately 90% of BMD accumulated during these periods. 25 Low BMD during adolescence can result in permanently low BMD in adulthood. 26 Studies investigating changes in BMD and its influential factors may help identify favorable and unfavorable factors involved in preserving bone health in adolescence, predicting the risk of osteoporosis, and reducing bone-related diseases in adulthood. 27 Recently, accumulating evidence has revealed a close association between serum ferritin and BMD. Two Korean cross-sectional studies reported an inverse association between serum ferritin and lumbar BMD among women aged ≥45 years.11,12 Similarly, a nationally representative study by Peng et al. 15 reported similar findings among US females aged ≥45 years. Conversely, Ilich-Ernst et al. 28 found that BMD of the proximal radius was positively correlated with serum ferritin levels. Another study including older Korean men also identified a positive correlation between serum ferritin and lumbar BMD. 13 In contrast to these previous studies, which focused on middle-aged and older populations, we explored the relationship between serum ferritin and BMD in children and adolescents. The results showed that serum ferritin was positively associated with lumbar BMD in the unadjusted model; however, this association became nonsignificant after adjusting for confounding factors. Given these inconsistent findings, further experimental and clinical studies are needed to clarify the effect of serum ferritin on BMD.
Although BMD is relatively static, BTMs are dynamic and reflect the current bone metabolic status. sBAP and uNTx are reliable markers of bone mass resorption. Several studies have reported that sBAP and uNTx are inversely associated with BMD.29–31 In vivo and in vitro studies have demonstrated that excess iron is detrimental to bone health.32–34 Isomura et al. 34 observed that postmenopausal rats exposed to iron overload for 4 weeks exhibited accelerated bone resorption, reduced bone mass, and deteriorated bone microarchitecture. Clinically, patients with diseases related to iron accumulation have been reported to demonstrate a higher incidence of osteoporosis and fractures. 33 Moreover, many studies suggest that iron excess and iron deficiency can alter bone metabolism. Animal studies in rats reported that severe anemia reduced bone formation, as indicated by changes in procollagen type I N-terminal pro-peptide levels, 35 and increased bone resorption, as measured by changes in urinary CTX levels. 36 These results are consistent with clinical observations. Iron deficiency anemia (IDA) has been associated with increased bone resorption, whereas recovery from IDA reduces bone resorption. 37 Toxqui et al. 17 reported that serum NTx-1 values were significantly higher in iron-deficient women than in iron-sufficient women. Ferritin is a reliable indicator of iron status; however, the association between serum ferritin and BTMs remains largely unclear. Our study revealed a negative association between serum ferritin and sBAP or uNTx in children and adolescents, supporting previous findings that iron deficiency may adversely affect bone metabolism.
The association between serum ferritin and BTMs was predominantly observed in males, a sex-specific finding that warrants further mechanistic investigation. This disparity may be explained by several interrelated factors. First, the distinct hormonal milieu during adolescence likely modulates skeletal responses to iron: testosterone promotes osteoblast activity and inhibits resorption, whereas estrogen regulates bone homeostasis via different pathways. 38 Second, sex differences in pubertal timing may alter the period of peak bone accrual and metabolic sensitivity to nutrients, including iron. Third, the typically higher levels of weight-bearing exercise in adolescent males can amplify bone turnover sensitivity to metabolic and hormonal signals. Finally, inherent sexual dimorphism in iron metabolism, including differences in ferritin levels and storage capacity, may also contribute. 39 Although these factors collectively provide a plausible explanation, the underlying mechanisms remain speculative and warrant further investigation.
Based on the findings of previous and contemporary studies, we hypothesized that iron overload and iron deficiency can affect the differentiation and function of osteoclasts and osteoblasts, thereby disrupting the delicate balance between bone formation and resorption and accelerating bone loss. We suggest that maintaining optimal iron levels is essential for skeletal homeostasis.33,40 Although several experimental and clinical studies have demonstrated the deleterious effects of iron excess on bone health,41,42 the relationship between iron deficiency and bone metabolism has rarely been investigated. Children and adolescents are at the highest risk of iron deficiency, with prevalence ranging from 15.5% to 31.9%.19,43 Moreover, average ferritin levels are significantly lower in children and adolescents (17.9–30.8 μg/L) than in middle-aged and older adults (77.1–127.7 μg/L).13,43 Several studies have reported reduced bone strength and impaired microarchitecture in rats with iron deficiency,44,45 whereas clinical studies have shown that iron deficiency promotes bone resorption.17,37 Two main hypotheses have been proposed to explain the detrimental effects of iron deficiency: collagen synthesis and bone matrix mineralization. Medeiros et al. 44 reported that iron affects bone turnover by influencing type I collagen synthesis and maturation. Iron is a necessary cofactor for prolyl and lysyl hydroxylases, which are required for lysyl oxidase activity. These enzymes catalyze the cross-linking of adjacent collagen fibers. Iron deficiency reduces the availability of iron, resulting in decreased cross-linking of collagen fibers and weakened collagen fibers. 35 Iron deficiency is also associated with reduced calcium absorption in the kidneys and intestines, resulting in lower calcium content in the bone. Furthermore, weakened collagen fibers impair the mineralization process, as hydroxyapatite crystals cannot be properly deposited when collagen fibers lack appropriate rigidity, flexibility, and resistance. 46 Recent studies have suggested that the effects of iron deficiency may begin when serum ferritin levels are ≤17.9 μg/L.47,48 Consistent with our findings, the ferritin threshold values for uNTx and sBAP were identified as 16 ng/mL and 41 ng/mL, respectively. Therefore, maintaining normal ferritin levels in children and adolescents is crucial for bone health.
Limitation
The present study has several limitations. First, no causal relationship was established because of the cross-sectional nature of the study. Second, although we adjusted for multiple confounding factors, residual confounding may have influenced our results. Third, the diagnostic threshold for iron deficiency in children and adolescents remains controvertial, 49 which markedly limited our ability to explore the association of serum ferritin with BMD and BTMs in these populations. Finally, the stringent exclusion criteria resulted in a marked sex imbalance in the analytic sample, with significant differences in biochemical profiles between males and females. Although we employed NHANES sampling weights and adjusted for the complex survey design, residual confounding related to sex and physiological age may persist, as key growth and hormonal differences can influence ferritin levels and bone markers. Future studies with balanced cohorts or sex-stratified analyses are warranted to confirm these findings.
Conclusion
This national study establishes a novel, inverse, and nonlinear association between serum ferritin and BTMs specifically in children and adolescents, a finding that is predominantly evident in males. The identified inflection points suggest a threshold effect, underscoring the importance of maintaining adequate iron levels for bone health in this population, particularly among males. These results highlight the potential relevance of monitoring iron status in adolescent skeletal health strategies and warrant further investigation into the underlying sex-specific mechanisms.
Footnotes
Acknowledgments
Not applicable.
Authors’ contribution
Wenyuan Zheng wrote the manuscript. Wenyuan Zheng, Zhi Chen, Haiming Chen, and Yili Pan collected and analyzed the data. Jianwen Chen designed this study and revised the manuscript. All authors read and approved the final manuscript.
Availability of data and material
Data are available from the corresponding author on reasonable request.
Clinical trial number
Not applicable.
Consent to publication
Not applicable.
Declaration of conflicting interests
There was no conflict of interest.
Ethics approval and consent to participate
The National Center for Health Statistics Ethics Review Board approved all NHANES protocols, and informed consent was obtained from every participant.
Funding
Not applicable.
Statement
We confirmed that all methods were performed in accordance with relevant guidelines and regulations.