
Abstract
The development of the multidrug resistance phenotype is one of the major challenges faced in the treatment of cancer. The multidrug resistance phenotype is characterized by cross-resistance to drugs with different chemical structures and mechanisms of action. In this work, we hypothesized that the acquisition of resistance in cancer is accompanied by activation of the epithelial-to-mesenchymal transition process, where the tumor cell acquires a more mobile and invasive phenotype; a fundamental step in tumor progression and in promoting the invasion of other organs and tissues. In addition, it is known that atypical glycosylations are characteristic of tumor cells, being used as biomarkers. We believe that the acquisition of the multidrug resistance phenotype and the activation of epithelial-to-mesenchymal transition provoke alterations in the cell glycophenotype, which can be used as glycomarkers for chemoresistance and epithelial-to-mesenchymal transition processes. Herein, we induced the multidrug resistance phenotype in the PC-3 human prostate adenocarcinoma line through the continuous treatment with the drug paclitaxel. Our results showed that the induced cell multidrug resistance phenotype (1) acquired a mixed profile between epithelial and mesenchymal phenotypes and (2) modified the glycophenotype, showing an increase in the level of sialylation and in the number of branched glycans. Both mechanisms are described as indicators of poor prognosis.
Keywords
Introduction
Solid tumors are comprised of cell clusters that grow uncontrolledly. They are classified as benign or malignant, according to their capacity of invading nearby tissues. Besides invading nearby tissues, malignant metastatic foci are formed in distant sites—a characteristic responsible for around 90% of all cancer-related deaths.1–3 There is a larger spectrum than the benign–malignant dichotomy leads to believe, with tumor tissues exhibiting intermediate phenotypes, showing cancer can progress slowly from healthy tissue to invasive malignant tumor. 4
The main malignancy factor that springs to mind when it comes to cancer is invasiveness. It increases the chance of metastasis, 5 and it is the greatest hurdle to the treatment of cancer patients. 6 The epithelial-to-mesenchymal transition (EMT) is a process through which epithelial cells acquire mesenchymal characteristics.7–9
Cancer patients’ survival rates have improved in the last decades. This is due to an increase in the number of early diagnoses, as well as advancements in prevention and therapy. 10 When it comes to treatment, one of the main difficulties faced by oncologists is resistance to chemotherapy, which can be intrinsic or acquired after treatment. 11 Cancer cells can simultaneously develop resistance to not only drugs used in the treatment but also to a larger drug spectrum of structurally and pharmacologically diverse drugs, in a phenomenon known as multidrug resistance (MDR). First described in 1970, the MDR phenotype was, at first, credited almost entirely to overexpression of ABC transporters.12–14 It is now common knowledge that while ABC transporters often play a role, the MDR phenotype is a result of several factors. Examples vary from changes in apoptosis signaling15–17 to mechanisms involving cell adhesion proteins 18 as well as changes in DNA topoisomerase II and DNA repair mechanisms.19–21
One topic that rose to prominence in cancer research was the study of glycophenotype, since several changes are consistently reported in models for EMT and MDR study.22–24 These changes are so important that abnormal glycophenotypes are considered hallmarks of cancer and studied as biomarkers.25–27
There is plenty of evidence linking resistance phenotypes and invasiveness, or even metastasis, to each other and to changes in cancer cell glycophenotype.28,29 The goal of this article is to show a connection between the establishment of paclitaxel resistance, changes in EMT markers, and glycophenotypical alterations using the PC-3 prostate epithelial cancer cell line as a model.
Materials and methods
Cell culture
The prostate adenocarcinoma PC-3 cell line (ATCC) and all derived resistant cell lines were cultivated in Dulbecco’s Modified Eagle Medium (DMEM) supplemented with 10% bovine fetal serum (BFS), 0.5% penicillin/streptomycin and 0.2 g/L of
Paclitaxel resistance–inducing process
The PC-3 cell line was exposed to gradually increasing concentrations of paclitaxel (PAC). Starting at 10 pM, PAC concentration was doubled whenever cells showed normal growth, reaching the maximum concentrations of 120, 180, and 240 pM in 6 months, resulting in the three cell lines we used in this article: PAC 120, PAC 180, and PAC 240.
Cell viability assay
The MTT assay was used to gauge cell viability during and after the resistance induction process. To evaluate the development of a cross-resistance phenotype, we also used doxorubicin (DOX), cisplatin (CIS), and vinblastine (VIN). The parental and resistant cell lines were seeded onto 96 well plates at a 2 × 10⁴ cell/well density for 24 h, then treated with chemotherapics for 48 h, after which the assay was performed as previously described. 30
Flow cytometry
To investigate the cell glycophenotype, we used fluorescein isothiocyanate (FITC)-conjugate lectins: Peanut agglutinin (PNA), Maackia amurensis (MAA), Sambucus nigra (SNA), Phaseolus vulgaris leucoagglutinin (PHA-L), and Phaseolus vulgaris erythroagglutinin (PHA-E), which bind to terminal galactose (Gal) in the carbohydrate sequence Gal-β(1-3)-N-acetylgalactosamine (GalNac); terminal α-2,3-sialic acid; terminal α-2,6-sialic acid; tri- and tetra-antennary N-glycan chains and bisected N-glycan chains, respectively. Flow cytometry was also employed using monoclonal antibodies to evaluate surface protein expression and to examine the transport activities of ABC transporters as previously described. All antibodies used in this study were acquired from Santa Cruz Biotechnology. 31 For the immunofluorescence assay, the parental and resistant cell lines were seeded onto round glass microscope coverslips inside 24 well plates at a 1 × 10⁵ cell/well density. After 24 h of incubation, cells were fixed in a 4% para-formaldehyde solution during 15 min at 4°C and then washed with saline phosphate buffer (PBS pH 7.4). Cells were incubated for 30 min with a carbo-free blocking solution (Vector Laboratories) prior to 30 min incubation with the fluorescent lectins. After incubation, the cells were washed with PBS once more and treated with DAPI (4’,6-diamidino-2-phenylindole dihydrochloride) for 5 min and washed with water before being mounted with Vectashield (Vector Laboratories). The slides were observed and photographed in an Olympus IX71 optical microscope with epifluorescence. For flow cytometry, the cells were seeded onto 24 well plates at a 1 × 10⁵ cell/well density. Plates destined to lectin analysis were processed in a similar manner as described above, whereas plates used for antibody labeling were blocked with BFS solution as described previously. 32 Plates used for antibody labeling were blocked with BFS solution as processed as described in a previous work. 31 All flow cytometry analyses were performed using Summit Software.
Wound healing assay
In order to determine whether the cell lines suffered any change in their motility rate, the cells were seeded onto six well plates at a density of 1 × 10⁶ cell per well. After 48 h of incubation, a scratch was made on the monolayer with the aid of 10 μL micropipette tip. The process of cellular migration was monitored through microphotographs, and the percentage of the covered area was measured using the ImageJ software.
RNA extraction and real-time quantitative polymerase chain reaction
RNA extraction and purification from the parental and resistant PC-3 cell lines were performed 24 h after seeding of 1 × 10⁶ cell onto six well microplates, using the RNeasy kit (QIAGEN, Hilden, Germany). cDNA was synthesized using the Platus Transcribe RNase H cDNA First Strand (Sinapse Inc., São Paulo, Brazil). For the amplification, we used the quantitative polymerase chain reaction (qPCR)-SYBR Green Plus 2× kit (LGC Biotecnologia, Cotia, Brazil) in a LineGene 9600 plus Real-Time PCR device. Data analysis was performed with the LineGene 9600 plus Real-Time PCR for Research software. 33 All procedures were performed according to the manufacturer’s instructions. The PCR reactions were performed using the primers described in Table 1.
Quantitative real-time PCR primers.

Western blotting
Cells were seeded onto six well plates at a density of 1 × 10⁶ cell per well. After a 72-h period of incubation, cells were washed and submitted to lysis with RIPA buffer and a protease inhibitor (PICP8340). Lysis was performed during 5 min, after which the lysate was collected and centrifuged for 10 min at 10,000g. The supernatant was retrieved and transferred to microtubes. Protein concentration was determined using the BCA kit (Thermo Fisher Scientific), and 40 μg of total protein were loaded in each well for every assay as previously described. 34 Band intensity was analyzed with the ImageJ software.
Statistical analysis
All statistical analyses were performed with GraphPad Prism 5.0, with one-way analysis of variance (ANOVA) test and Dunnett’s post-test being used for the cell viability, western blot, wound healing, and all flow cytometry assays. For the real-time quantitative polymerase chain reaction (RT-qPCR) assays, we used student’s t-test. All results show medium ± standard error and were only considered significant when p < 0.05.
Results
Resistance induction
Initially, the PC-3 cell line was treated with sublethal concentrations of paclitaxel (PAC) to induce a resistance phenotype. The IC50 was determined using the MTT assay. As shown in Figure 1(a), the IC50 was shown to be around 15 nM. To simulate the low concentrations found in the innermost cells in solid tumors, an initial concentration of 10 pM—three orders of magnitude lower than the IC50—was used. Resistance levels were regularly tested through MTT assays, and in 6 months, three different cell lines from different final concentrations of PAC (120, 180, and 240 pM) were obtained, as shown in Figure 1(c). Those cell lines were named PAC 120, PAC 180, and PAC 240.

Cell viability assays were performed to determine IC50 and demonstrate the rise of a multidrug resistance phenotype. Cells were incubated during 48 h with different concentrations of PAC, DOX, VIN, and CIS. (a) The parental cells were incubated with increasing concentrations of PAC to determine IC50. (b–e) Both the parental and resistant cell lines were incubated with increasing concentrations of CIS (b), PAC (c), DOX (d), and VIN (e), and the assay was performed 48 h later. The dotted line indicates IC50. Results are expressed as a percentage of control (average ± standard error of five independent experiments). *p < 0.05.
Emergence of an MDR phenotype
The resistant cell lines were tested against CIS, DOX, and VIN to establish cross-resistance (Figure 2(c)–(e)). Expression and activity of ABC transporters ABCC1, ABCB1, and ABCG2 were evaluated through flow cytometry in the parental and resistant cell lines. Figure 2(a) shows that the expression of all three proteins is increased in the resistant cell lines, and PAC 240 shows a greater expression than its counterparts. RT-qPCR assays for the ABC transporters show that the expression of mRNA is increased for PAC 240 when compared to the parental cell line. ABCB1 and ABCG2 mRNA show a 200-fold increase, whereas ABCC1 shows a sixfold increase in contrast to the parental cell line (Figure 3(b)). Although small, this increase was sufficient to enlist a rise in ABCC1 transport activity of approximately 100%, as shown in Figure 3(a). ABCG2 also shows a significant increase in its transport activity (Figure 4(b)), whereas ABCB1 activity remains unchanged (Figure 4(c)).
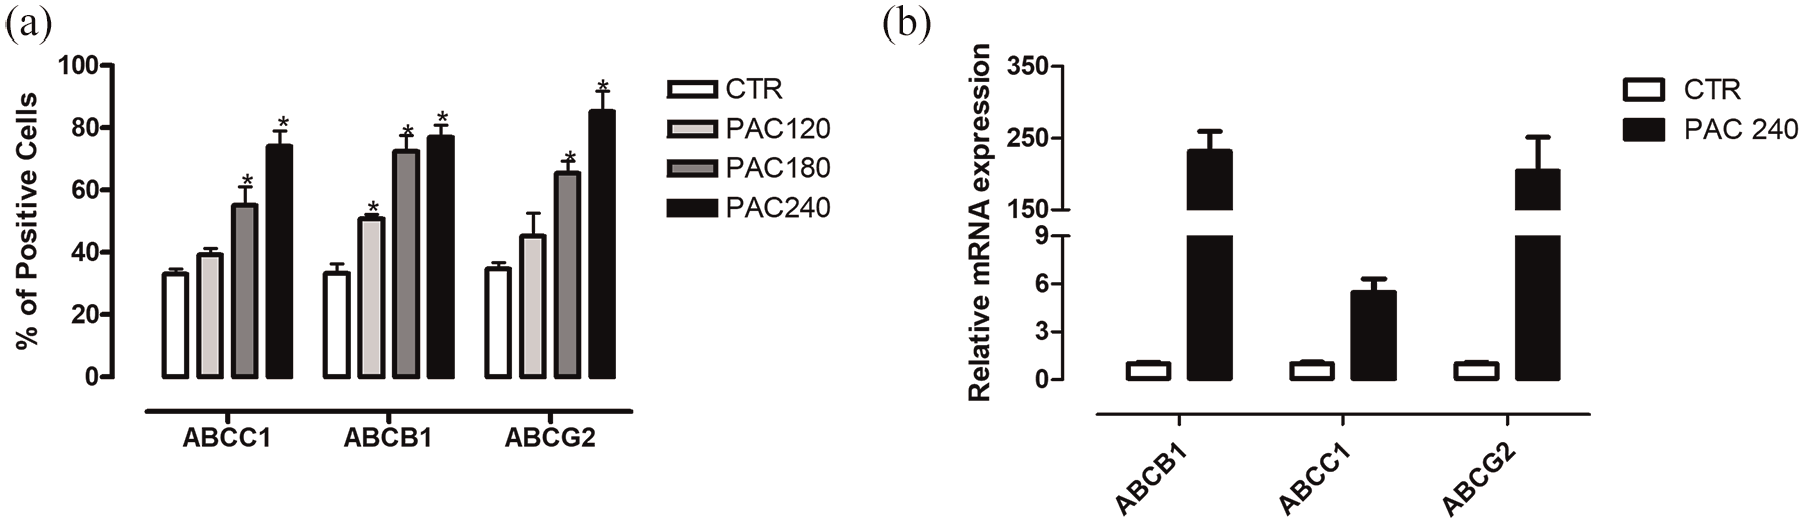
Expression of ABC transporters. The expression of the three main ABC transporters was evaluated through two different assays. (a) Both the parental and resistant cell lines were incubated for 48 h before being labeled with antibodies against ABCC1, ABCB1, or ABCG2. The transporter expression was evaluated through flow cytometry. (b) Cells were incubated for 48 h before mRNA was extracted for cDNA synthesis. ABC transporter primers were used to access the expression of mRNA for each transporter. Results are expressed as average ± standard error. *p < 0.05.

Activity of ABC transporters. Both parental and resistant cell lines were incubated for 48 h before the transport activity for (a) ABCC1, (b) ABCG2, and (c) ABCB1 was measured in a flow cytometer, as described in section “Materials and Methods.” Transport activity is represented as the ratio between the fluorescence in efflux conditions in the presence and absence of specific inhibitors. Results are expressed as average ± standard error. *p < 0.05.

Expression of apoptosis-related genes. Both parental and resistant cell lines were incubated for 48 h, after which mRNA was extracted and purified for cDNA synthesis. The expression of the anti-apoptotic Bcl-xL (a) and Bcl-2 (c) and the pro-apoptotic Bax (b) and caspase-3 (d) was evaluated through RT-qPCR as described in section “Materials and Methods.” Results are shown as average ± standard error of three independent experiments. *p < 0.05.
Modulation of apoptosis
Another important factor for chemoresistance is the regulation of the Bcl-2 family, whose members regulate apoptosis. RT-qPCR assays show that the transcript levels for the anti-apoptotic members—Bcl-xL and Bcl-2—were upregulated (Figure 5(a) and (c)), whereas the pro-apoptotic Bax shows reduction (Figure 5(b)). We also analyzed the expression of caspase-3, which was also inhibited, as shown in Figure 5(d). All results point to the conclusion that PAC 240 exhibits a greater resistance to apoptosis than the parental cell line. In order to confirm that PAC 240 is more resistant to apoptosis than the parental PC-3, an annexin V-binding assay was performed. Using FITC-labeled annexin V, it was possible to tag cells undergoing apoptosis. Figure 5 shows that when challenged with paclitaxel, PAC 240 displays a level of annexin V binding similar to the unchallenged cells. Comparatively, the control PC-3 cell line presented a fivefold increase in the number of cells bound to annexin V when treated with paclitaxel. These results point to a decreased activation of apoptotic pathways in the PAC 240 cell line.

Annexin V-binding assay. Cells were incubated for 24 h before the addition of 20 nM paclitaxel, after which the cells were incubated for 48 h. (a) The histograms represent three independent experiments. The lower right panel of each histogram represents annexin V-positive early apoptotic cells and the upper right stands for annexin V/PI-positive late apoptotic cells, whereas the upper left panel represents PI-positive necrotic cells and the lower left represents the double negative viable cells. (b) Graphical representation of three independent experiments. Results are shown as average ± standard error.
Caspase activation
Finally, activation of caspase-3 was evaluated. Executioner caspases, such as caspase-3, exist as inactive dimers that must be activated by cleavage. Figure 6 shows that caspase-3 in the resistant PAC 240 is less activated than in PC-3—a result coherent with the evaluation of the MDR phenotype.

Caspase-3 expression. Expression of caspase-3 and its active (cleaved) form were evaluated by western blot. Cells were incubated for 48 h, scraped, and resuspended in lysis buffer. Western blot was performed as described in section “Materials and Methods.” The image on panel (a) is representative of three independent experiments: lane 1—PC-3 parental cell line (untreated); lane 2—PC-3 parental cell line treated with PAC 20 nM; and lane 3—PAC 240 cell line (untreated) and PAC 240 cell line treated with PAC 20 nM. The panels (b) and (c) show their graphical representation.
Taken together, the results involving ABC transporters, caspase-3, and the Bcl-2 family, as well as cell viability, demonstrate that the generated PAC 240 cell line presents cross-resistance to chemotherapeutic agents of varying structures and action mechanisms, thanks to a greater capacity for xenobiotics exclusion and/or compartmentalization and apoptosis resistance.
Expression of EMT-related genes and glycophenotype analysis
To verify whether resistance induction was followed by EMT, the expression of marker proteins was evaluated. Classical EMT displays an increase of extracellular matrix components, especially the O-glycosylated fibronectin isoform, dubbed oncofetal fibronectin (onf-FN) that contains the type III homology connective segment (IIICS) domain.35,36 Results show an increase in the expression of mRNA for both total fibronectin and the IIICS domain, representing onf-FN (Figure 7(a)). However, the expression of cadherins—both protein and mRNA—did not portray the classic cadherin switch (Figure 8(b) and (c)). Instead, we can see through RT-qPCR and western blot, an increase in E-cadherin expression, while N-cadherin remains mRNA expression unchanged, with reduced protein expression shown through western blot (Figure 8(b)). The resistant cell line appears to exhibit an intermediate profile, situated somewhere between epithelial and mesenchymal. While such a profile is poorly understood, it is associated with chemoresistance and increased potential for tumor initiation. 37

Expression of EMT markers. The expression of cadherins, fibronectin, and oncofetal fibronectin was assayed through RT-qPCR and western blot to evaluate both gene and protein expressions. Panel (a) shows the expression of fibronectin (total fibronectin) and IIICS domain (oncofetal fibronectin) on the left and E-cadherin and N-cadherin mRNA on the right. RT-qPCR results are shown as average ± standard error. *p < 0.05 from control panel (b) shows the expression of N- and E-cadherins and total and oncofetal fibronectins by western blot. The image on the left is representative of three independent experiments and on the right is their graphical representation.
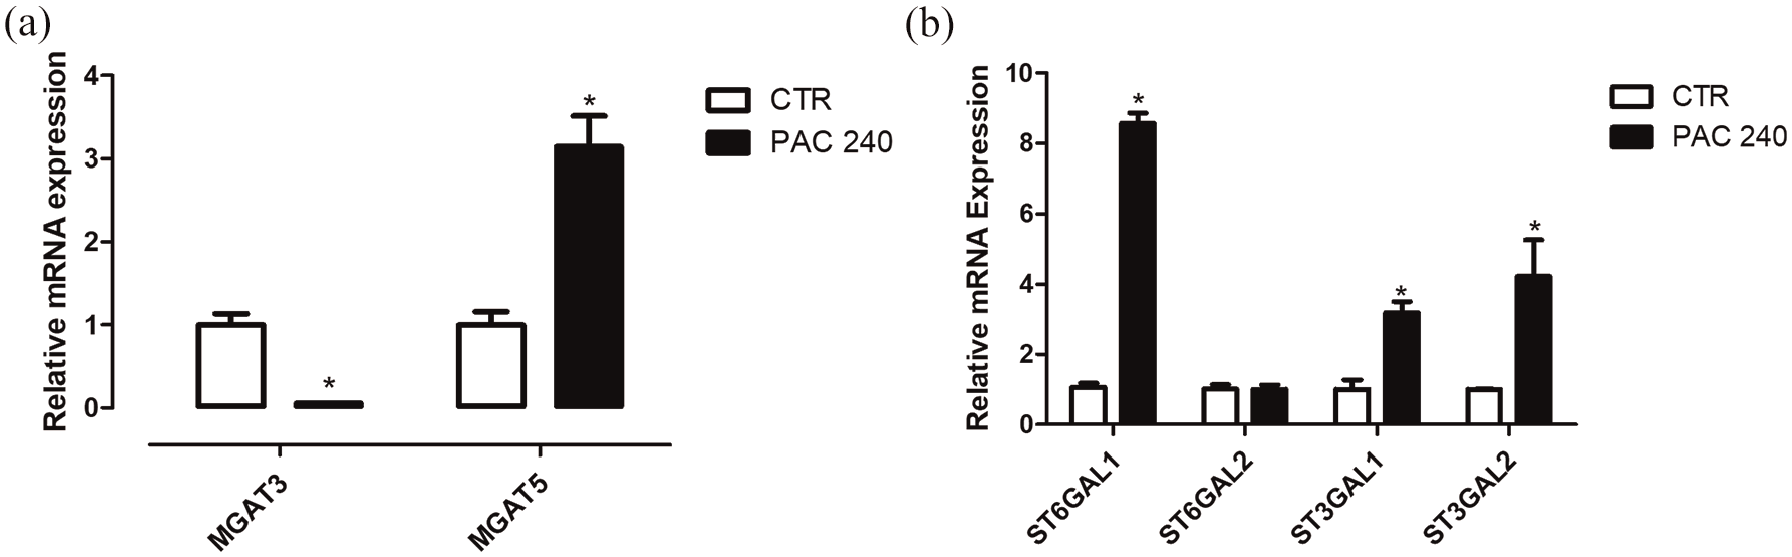
Expression of glycosyltransferases. Expression of the transferase genes MGAT3 and MGAT5 (a), involved in the formation of bisected and branched N-glycans, respectively, and of the sialyltransferases ST6GAL1 and ST6GAL2 and ST3GAL1 and ST3GAL2 (b), responsible for adding sialic acid residues in α-2,6 and α-2,3 bonds through RT-qPCR. Results show average ± standard error of three independent experiments. *p < 0.05.
To evaluate the glycophenotype of resistant and parental cell lines, we resorted to RT-qPCR to verify changes in the expression of the MGAT3 and MGAT5 genes, responsible for the GnT-III (β-1,4-N-acetylglucosaminyltransferase III) and GnT-V (α-1,6-N-acetylglucosaminyltransferase V) glycosyltransferases, respectively. It has been well described38–40 that GnT-III and GnT-V respond for bisected or tri- and tetra-antennary N-glycan chains, respectively. The results displayed in Figure 8(a) point to an increased expression of MGAT5 and reduction of MGAT3 expression, suggesting that resistant cell lines might exhibit more branched N-glycan chains, in detriment of bisected ones (Supplemental Figure 2). The expression of four different sialyltransferases—namely, β-galactoside α-2,3-sialyltransferase (ST3GAL) 1 and 2, as well as α-2,6-sialyltransferase 1 and 2—was also investigated. While mRNA for ST3GAL2 is unchanged in the resistant cell line, ST6GAL1 and ST6GAL2, as well as ST3GAL1 genes have their expression increased in PAC 240 (Figure 8(b)).
Expression of glycan epitopes
The changes observed above should reflect in different expressions of glycan epitopes. Using fluorescent lectins, a reduced PNA binding to terminal Gal in the carbohydrate sequence Gal-β(1-3)-GalNAc residues was observed, while both MAA and SNA stainings, which bind, respectively, to sialic acid in α-2,3 and α-2,6 glycosidic bonds, were increased, suggesting a general increase of sialylation for the resistant cell lines in comparison to the parental (Figure 9).

Lectin-binding assay. Cells were incubated during 48 h before being harvested with trypsin. Lectin binding was performed as described in section “Materials and Methods,” and the fluorescence was analyzed through flow cytometry. (a) Maackia amurensis (MAA) binds to sialic acid in a α-2,3 bond, while (b) Sambucus nigra (SNA) indicates α-2,6-bound residues. (c) Peanut agglutinin (PNA) binds to terminal galactose (Gal) in the carbohydrate sequence Gal-β(1-3)-N-acetylgalactosamine (GalNac). (d) Phaseolus vulgaris erythroagglutinin (PHA-E) and (e) Phaseolus vulgaris leucoagglutinin (PHA-L) bind, respectively, to bisected and branched N-glycans. Results are expressed as average ± standard average of five independent experiments. *p < 0.05.
Since it has been demonstrated that substitution of bisected N-glycans for branched forms relates to the destabilization of homotypic bonds between E-cadherin chains and loss of epithelial characteristics 23 with increased motility, a wound healing assay was performed to assess gains in motility in the resistant cells. Figure 10 shows there is an incremental gain in cell motility in the resistant cell lines when compared to the parental one.

Wound healing assay. Cells were incubated during 48 h before a wound was inflicted to the monolayer. The healing of the wound was monitored regularly through microphotographs as described in section “Materials and Methods.” Images in panel (a) are representative of independent experiments, and panel (b) is their graphical representation. Results are expressed as average ± standard average of five independent experiments. *p < 0.05.
In sum, these results show that epithelial cancer cells can acquire mesenchymal characteristics when submitted to chemotherapeutic agents, which more than likely leads to a greater malignancy potential, due to greater chance of metastasis and chemoresistance.
Discussion
Resistant cell lines constitute one of the main study models for the MDR phenotype. 14 One important factor to consider is the way those lines are established directly influence the levels and mechanism of resistance that are displayed by the resulting cell. 41 For this work, we employed a continuous model, where parental cells were cultivated in culture medium supplemented with a low PAC concentration for a long period, using lower concentrations than most authors. 42
For Takeda et al., 43 the establishment of a paclitaxel resistant PC-3 cell line begun with a 10 nM concentration, a 1000 times greater than what was used in this work. To start with, the resistance levels displayed by PAC 240 were three to five times greater than the parental cell line and roughly 10 times lower than the Takeda cell lines. Questions may be raised concerning the induction method. For instance, whether the used concentrations and achieved resistance levels for the in vitro model are on par with in vivo ones or match the resistance levels found in patients with resistant tumors. From the drug’s peak plasmatic concentration during the treatment, it is possible to estimate the concentrations that tumors are subject to in vivo, 44 making it possible to avoid concentrations that are much higher than observed in clinical routines. When using the peak plasmatic concentration as a baseline, it is possible to obtain cell lines two to 10 times more resistant than the parental counterpart. 44 The concentrations of PAC used in this work are, in fact, below peak plasmatic concentration, 45 while the resistance level is similar to the expected in clinic. It is interesting to notice that whereas both models show increased expression of ABC transporters, a common feature when dealing with resistant cell lines, only our model presented significant changes in the expression of the Bcl-2 family. Such differences are likely due to the different methods and concentrations employed in the establishment of the resistant cell line.
With the onset of chemoresistance, the EMT process was triggered also. One possible explanation for this is the overlap of transcription factors involved with both EMT and the regulation of ABC genes. 46
Our resistant cell line presents a mixed phenotype, not fully completing EMT, with a greater expression of mesenchymal markers, such as fibronectin and its O-glycosylated isoform, essential to EMT. 34 Furthermore, onf-FN is an optimal target for drug delivery systems for treating resistant tumors as its expression increases with the onset of chemoresistance. 47
Paradoxically, we observed an increase in expression of E-cadherin both through RT-qPCR and protein analysis. For some authors, a reduced expression of E-cadherin is associated with higher sensitivity to anticancer drugs. 48 However, other groups show that such an increase is not unheard of in resistant cell lines, 49 being actually able to suppress apoptosis and promote cell growth 50 and chemoresistance.24,51 Beyond that, studies using three-dimensional (3D) cell culture scaffolds show that the cell-to-cell adhesion promoted by E-cadherin is capable of furthering chemoresistance.52,53 One likely explanation for the increased mobility despite the increased E-cadherin expression is the increase in branched N-glycan chains, as evidenced by the results obtained with expression of the MGAT5 gene, as well as the PHA-L lectin binding (Figures 9 and 10).
The importance of the GnT-III and GnT-V proteins for E-cadherin-mediated cell adhesion is already established.38,54 Therefore, it makes sense that even though E-cadherin expression appears to be increased in the resistant cell lines, its function might be compromised by post-translational modifications brought by the increased MGAT5 expression, as shown by lectin staining.
Several groups reported changes in the structure of glycans in cancer models. One example is the increase of expression and activity of GnT-V,55,56 which correlates to higher proliferation, migration, and invasiveness, demonstrating how import this glycosyltransferase is for tumor malignancy.56,57 This is believed to be primarily due to the formation of branched N-glycan structures in adhesion proteins, such as cadherins. 54 Our results show an increase in the expression of the MGAT5 gene for the PAC 240 cell line, as well as an increase in branched N-glycans, as demonstrated by PCR and lectin staining results, respectively. Such results are also matched by a reduction in the expression of MGAT3 and a reduction in bisected N-glycans, which are, in turn, important for the cell-to-cell adhesion maintained by E-cadherin.
Such results are mirrored by the wound healing assay, showing that resistant cell lines acquired greater motility, a quality in tune with EMT, and increased metastatic potential. We also showed an increased binding of SNA and MAA lectins, accompanied by a decrease in PNA binding, pointing to an increase in sialylation, as well as a decrease in the number of terminal galactose residues. The aberrant sialylation in cancer bears consequence in cancer growth, metastasis formation, apoptosis resistance, and chemoresistance.58,59 The increased sialylation shown by lectin binding is corroborated by the increased expression in the sialyltransferase genes ST6GAL1 and ST6GAL2 and ST3GAL1, as shown in Figure 9. Higher expression of ST3GAL1 is generally associated with greater invasive potential and an increased number of cancer stem cells. ST3GAL1 is frequently overexpressed in human colon cancer and is upregulated by the MYC proto-oncogene.60,61 It is important to note that MYC is often overexpressed in prostate cancer cell lines, and it is not different with the PC-3 cell line. 62 ST6GAL1, however, is often found overexpressed in resistant cell lines.63–65 Some groups have hypothesized that increased sialylation might affect TNF activation or affect the MAP-kinase/caspase pathway increasing cell death resistance.66,67 The results point to a switch from an epithelial to a mesenchymal phenotype, which is corroborated by the increased cell mobility demonstrated in Figure 10. Our results are similar to what Kajiyama et al. 68 have shown in a previous study inducing paclitaxel resistance in human carcinoma cells. Although their model was based in ovarian carcinoma cells, they demonstrated that resistance induction was able to promote EMT.
In the initial cancer studies with a focus on glycobiology, several atypical glycosylations were observed, many frequent in particular types of cancer, leading some groups to consider those changes a characteristic of tumoral cells.69–72 As more data came to light, it became obvious that more than a mere characteristic, atypical glycosylations have a major impact in other established cancer hallmarks, such as invasiveness, metastasis, angiogenesis, cell death resistance, and others. Besides potential biomarkers, glycans can be considered as prospective therapeutic targets. 73 Thus, considering the results in this article and data already published,22,40,69,74–76 it is possible to assume that multiresistant cell lines may exhibit a greater invasive/metastatic potential as an additional difficulty for physicians to contend with. The link between changes in the glycophenotype acquired through the establishment of MDR and tumor malignancy calls for further investigation.
Supplemental Material
Supplementary_material – Supplemental material for Resistance to paclitaxel induces glycophenotype changes and mesenchymal-to-epithelial transition activation in the human prostate cancer cell line PC-3
Supplemental material, Supplementary_material for Resistance to paclitaxel induces glycophenotype changes and mesenchymal-to-epithelial transition activation in the human prostate cancer cell line PC-3 by Leonardo Marques da Fonseca, Danilo Macedo Calvalhan, Jose Osvaldo Previato, Lucia Mendonça Previato and Leonardo Freire-de-Lima in Tumor Biology
Footnotes
Declaration of conflicting interests
The author(s) declared no potential conflicts of interest with respect to the research, authorship, and/or publication of this article.
Funding
The author(s) disclosed receipt of the following financial support for the research, authorship, and/or publication of this article: This work was supported by the Conselho Nacional de Desenvolvimento Científico Tecnológico (CNPq); Fundação do Câncer/Oncobiology Program; Fundação Carlos Chagas Filho de Amparo à Pesquisa do Estado do Rio de Janeiro (FAPERJ); and Coordenação de Aperfeiçoamento de Pessoal de Nível Superior (CAPES).
Supplemental material
Supplemental material for this article is available online.
References
Supplementary Material
Please find the following supplemental material available below.
For Open Access articles published under a Creative Commons License, all supplemental material carries the same license as the article it is associated with.
For non-Open Access articles published, all supplemental material carries a non-exclusive license, and permission requests for re-use of supplemental material or any part of supplemental material shall be sent directly to the copyright owner as specified in the copyright notice associated with the article.