
Abstract
Hepatocellular carcinoma is a major cause of cancer mortality worldwide. The outcome of hepatocellular carcinoma depends mainly on its early diagnosis. To date, the performance of traditional biomarkers is unsatisfactory. Polo-like kinase 1 is a serine/threonine kinase that plays essential roles in cell cycle progression and deoxyribonucleic acid damage. Moreover, polo-like kinase 1 knockdown decreases the survival of hepatocellular carcinoma cells; therefore, polo-like kinase 1 is an attractive target for anticancer treatments. Nobiletin, a natural polymethoxy flavonoid, exhibits a potential antiproliferative effect against a wide variety of cancers. This study targets to identify a reliable diagnostic biomarker for hepatocellular carcinoma and provide a potential therapeutic target for its treatment. Polo-like kinase 1 levels were analyzed in 44 hepatocellular carcinoma patients, 33 non-hepatocellular carcinoma liver cirrhosis patients and 15 healthy controls using the enzyme-linked immunosorbent assay method. Receiver operating characteristics curve analysis was used to establish a predictive model for polo-like kinase 1 relative to α-fetoprotein in hepatocellular carcinoma diagnosis. Furthermore, in the in vitro study, gene expressions were assessed by quantitative polymerase chain reaction in two human hepatocellular carcinoma cell lines after treatment with doxorubicin and polo-like kinase 1 inhibitor volasertib (Vola) either alone or in combination with nobiletin. Cell viability was also determined using the crystal violet assay.: Serum polo-like kinase 1 levels in hepatocellular carcinoma patients were significantly higher than liver cirrhosis and control groups (p < 0.0001). Polo-like kinase 1 showed a reasonable sensitivity, specificity, positive predictive value, and negative predictive value in hepatocellular carcinoma diagnosis. Moreover, nobiletin improved inhibition of cell growth induced by Vola and doxorubicin. Regarding reverse transcription polymerase chain reaction results, nobiletin suppressed expressions of polo-like kinase 1 and proliferating cell nuclear antigen and elevated expressions of P53, poly (ADPribose) polymerase 1, and caspase-3. Nobiletin/doxorubicin and nobiletin/Vola showed a significant increase in caspase-3 activity indicating cell apoptosis. Polo-like kinase 1 may be a potential biomarker for hepatocellular carcinoma diagnosis and follow-up during treatment with chemotherapies. In addition, nobiletin synergistically potentiates the doxorubicin and Vola-mediated anticancer effect that may be attributed partly to suppression of polo-like kinase 1 and proliferating cell nuclear antigen expression and enhancement of chemotherapy-induced apoptosis.
Introduction
Hepatocellular carcinoma (HCC) is an aggressive malignancy and one of the major causes of cancer mortality worldwide. 1 Unsatisfactory biomarkers, sustained cell proliferation, and multidrug resistance of chemotherapy make treatment of cancer obstacle. This situation emphasizes the urgent need for discovering novel biomarker and exploring drug which permits discovery of safe and effective combination therapy for fighting cancer.2–4
Polo-like kinases (PLKs) belong to the highly conserved serine/threonine kinase family that are principally involved in mitosis and cell cycle evolution. 5 PLK1 is composed of a kinase domain and two polo box domains (PBD) that plays a critical role in cell cycle processes such as bipolar spindle formation, centrosome maturation, checkpoint recovery, sister chromatid separation, cytokinesis and in particular mitotic entry.6,7 Preceding studies have illustrated that overexpressed PLK1 is correlated with poor survival rate in numerous types of cancers as breast, melanoma, and non-small cell lung cancer. 8 Indeed, PLK1 inhibition makes cells unable to complete mitosis, finally resulting in cell death,9,10 suggesting that PLK1 may be a powerful therapeutic target for cancer control.11–13 Volasertib (Vola) is a selective and powerful cell cycle kinase inhibitor that prompts mitotic arrest and apoptosis by targeting PLK1. 14 Recently, it was proved that Vola could potently provoke cell growth inhibition, cell cycle arrest, and apoptosis in HCC cells in vitro and in vivo. 15
Many natural compounds are under the spotlight in order to improve the outcome of the therapy and increase the patient’s quality of life. 16 Flavonoids represent a large set of miscellaneous natural products with interesting biology. They are natural polyphenols existing in an extensive number of fruits and vegetables. 17 They always attract attention due to their diverse beneficial biochemical and antioxidant effects against several diseases, including infectious diseases, cancer, obesity, diabetes, Alzheimer’s disease (AD), Parkinson’s disease, and atherosclerosis.18–21 Flavonoids exert their roles by interacting with different types of genes and enzymes. For example, they have been identified as a potent inhibitor for numerous enzymes, such as xanthine oxidase, cyclo-oxygenase, lipoxygenase, and phosphoinositide 3-kinase (PI3K). 17 An exponential number of studies indicate that flavonoids or flavonoid derivatives have essential roles in cancer chemoprevention and chemotherapy. 22 Multiple mechanisms of action have been recognized explaining their role in the treatment and prevention of cancer, such as carcinogen inactivation, antiproliferation, cell cycle arrest, induction of apoptosis, inhibition of angiogenesis, antioxidation, and reversal of multidrug resistance or a combination of these mechanisms. 23 A number of studies indicate that a high intake of flavonoids may be associated with reduced cancer risk.24,25
Nobiletin (NOB) is a kind of flavonoids that is composed of a polymethoxy flavonoid (5,6,7,8,30,40-hexamethoxyflavone) and is extracted from citrus fruits such as citrus depressa and reticulata. 26 It has different bioactivities such as anti-inflammatory, antitumor, neuroprotective, 3 anti-diabetic, anti-atherogenic, 27 and antiangiogenesis activities. 26 Recently, the antiproliferative and apoptotic effects of NOB have been demonstrated in multiple types of cancers in vitro, including brain tumor, gastric carcinoma, breast cancer, leukemia, peritoneal neoplasms, colon carcinoma, melanoma, HCC cells, 28 prostate cancer, 3 and lung cancer. 29 Despite these defensive and antitumor actions of NOB both in vivo and in vitro have been referred to its antioxidant activity besides its biological anti-inflammatory effect,30,31 other effective antitumor mechanisms as cell cycle arrest and/or apoptosis induction through inhibition of cell signaling pathways have been observed in various cancer cells. 32
Apoptosis, the programmed cell death, is achieved through two main pathways and plays vital roles in both the development and maintaining tissue homeostasis.33,34 Deregulation of apoptosis can upset the harmony between cell proliferation and cell death and consequently leads to cancer.35–37 P53 gene plays an important role as a tumor suppressor in the regulation of cell cycle arrest, DNA repair, and apoptosis. 38
In this study, we analyzed serum PLK1 level in HCC and liver cirrhosis (LC) patients. Moreover, we investigated the ability of NOB to potentiate the antiproliferative activity of doxorubicin (DOX) and Vola and to induce apoptosis in human HepG2 and Huh-7 cell lines.
Materials and methods
Reagents
NOB was purchased from Cayman Chemical (Ann Arbor, MI, USA). DOX Ebewe (vial 10 mg/5 mL) was a pharmaceutical product from the market (Unterach, Austria) diluted directly in the culture medium. Vola (BI-6727) in the form of crystalline solid (755038-65-4) with purity of ≥98% was obtained from Cayman Chemical. Dimethylsulfoxide (DMSO) was used as a vehicle to carry NOB and Vola to the cells and its concentration did not exceed 0.1% v/v in cell culture media in all experiments.
Subjects and samples
This study was applied on 92 subjects which were classified into three groups: the first group included patients diagnosed with HCC (mean age ± standard error of the mean (SEM), 58.5 ± 0.97 years; male:female ratio 3:1) at Specialized Medical Hospital, Medicine Faculty, Mansoura University, Mansoura, Egypt. HCC diagnosis relied on elevated α-fetoprotein (AFP) levels, the existence of focal liver lesion(s) detected by ultrasound and confirmed by computed tomography (CT scan) and/or magnetic resonance. The stages of HCC were categorized according to the system of Barcelona Clinic Liver Cancer staging.
The second group included 33 patients with cirrhosis (mean age ± SEM, 57.27 ± 1.86 years; male:female ratio, 2.67:1). Diagnosis of cirrhosis was based on clinical, biochemical, ultrasonographic, and/or histological criteria.
A total of 15 healthy individuals were involved in the last group as control (mean age ± SEM 52.4 ± 2.3 years; male: female ratio, 1.14:1). The inclusion criteria for healthy controls were as follows: (1) normal liver biochemistry, (2) no liver disease history, (3) no active infection, (4) no other systematic diseases, and (5) no other types of malignancy. Patients with advanced organ failure, previous radiation, chemotherapy, local ablation, or intra-arterial chemoembolization, hepatic metastatic carcinoma, and active infection or other malignancies were not included.
The study protocol conformed to the local institutional ethical committee, Pharmacy Faculty, Mansoura University, Mansoura, Egypt, and patients’ consents were obtained according to the ethical guidelines of the 1975 Helsinki Declaration and all patients gave informed consent to participate in this study.
Sample collection
The early morning fasting venous blood sample (5 mL) of the patients was collected and centrifuged at 3000 r/min for 10 min within 2 h of blood specimen collection. The supernatant serum was collected, aliquoted, stored at −80°C, and thawed at the assay time.
Serum PLK1 and AFP determination
Serum PLK1 concentration was measured using the Human PLK1 enzyme-linked immunosorbent assay (ELISA) Kit based on the manufacturer’s instructions (Assaybiotechnoloy, Sunnyvale, CA, USA). Levels of serum AFP were detected using Human AFP ELISA Kit (DiaMetra Company, Perugia, Italy). All AFP and PLK1 concentration measurements were performed in triplicate.
Cell viability assay and analysis of synergism
The adherent human HCC cell lines HepG2 and Huh-7 (2 × 10⁴ cells/well) were seeded in 96-well tissue culture plates. The following day, cells were treated in triplicates with a serial dilution of either DOX, Vola concentrations (10–0.625 µM), or NOB concentrations (100–6.25 µM). In experiments, where NOB was used as a chemosensitizer, 10 µM of NOB26,32 in the absence or presence of increasing doses of DOX or Vola (0.625–10 μM) was added to the cells 30 min after the chemotherapies. Cell viability was evaluated the following day by crystal violet assay.39–42
On the basis of the dose–response curves, IC30 of NOB and chemotherapies to produce a 30% suppression in growth in combination and of the individual drugs were determined using the nonlinear regression equation. Finally, the combined effect of the two drugs was measured based on the combination index (CI) and was denoted as follows

where D30A is the concentration of drug A (NOB) producing 30% of the effect and dA is the drug A concentration producing 30% of the effect when used in combination with dB. Similarly, D30B is the drug B (chemotherapy) concentration producing 30% of the effect, and dB is the drug B concentration producing 30% of the effect when used in combination with dA. 43 The combinatory effect was symbolized as follows: CI < 1, synergistic effect; CI = 1, additive effect; and CI > 1, antagonistic effect.44,45
Real-time reverse transcription-polymerase chain reaction (reverse transcription quantitative polymerase chain reaction)
HepG2 and Huh-7 cells (106 per well) were seeded in a six-well plate and treated with Vola (1 µM), DOX (5 µM), and/or NOB (10 µM) alone or in combination for 24 h. After the treatment, cells were trypsinized and centrifuged at 2500 r/min for 5 min. Then total ribonucleic acid (RNA) was extracted with TRIZOL (Zymoresearch Co., Irvine, CA, USA) and was purified using Direct-zol RNA miniPREP kit (Zymoresearch Co.). cDNA was prepared by reverse transcription of 10 µL samples of total RNA using sensiFASTcDNA synthesis kit for reverse transcription quantitative polymerase chain reaction (RT-qPCR) (Bioline Inc., Taunton, MA, USA). Specific primers were purchased from Invitrogen (Carlsbad, CA, USA). PREMIER Biosoft (San Francisco, CA, USA) was used to design the primers based on gene sequences obtained from PubMed (Entrez Gene). PCR was performed on Applied Biosystems 7500 Fast Real-Time PCR System (Applied Biosystems, Woburn, MA, USA) using the SYBR Green master mix (Bioline Inc.). The thermal cycling program was performed according to the manufacturer’s instructions. Alterations in expression were estimated relative to the levels expressed by the glyceraldehyde 3-phosphate dehydrogenase (GAPDH) gene as a reference gene. Primer sequences are shown in Table 1.
Primer sequences used for the RT-PCR step.

RT-PCR: reverse transcription polymerase chain reaction; GAPDH: glyceraldehyde-3-phosphate dehydrogenase; PLK1: polo-like kinase 1; PCNA: proliferating cell nuclear antigen; TP53: tumor suppressor gene p53; PARP1: poly (ADPribose) polymerase 1; F: forward; R: reverse.
Caspase-3 activity determination
HepG2 and Huh-7 cells (106 per well) were seeded in a six-well plate and treated with Vola (1 µM), DOX (5 µM), and/or NOB (10 µM) alone or in combination for 24 h. After the treatment, cells were collected, washed twice with cold phosphate-buffered saline (PBS), and subsequently resuspended in protein lysis buffer and incubated for 30 min on ice. Then, centrifugation was done at 1500 r/min for 10 min. Cell lysates (100 μL) were transferred to 96-well plates in triplicates, then incubated for 2 h at 37°C. Caspase-3 activity in lysates of HepG2 and Huh-7 cells was assessed using the Invitrogen ELISA Kit according to the manufacturer’s instruction.
Statistical analysis
All experiments were conducted at least in triplicate and repeated twice. Data were expressed as mean ± SEM. Statistical significance of differences between samples was calculated by one-way analysis of variance (ANOVA) followed by a Tukey’s post hoc test or Student’s t-test using the SPSS software version 16.0 (SPSS, Inc., Chicago, IL, USA). A p-value of 0.05 or less was considered statistically significant.
Results
Patient characteristics
All characteristics and biological parameters of patients with HCC are illustrated in Tables 2–4.
Clinical and radiological data among the studied groups.

HCC: hepatocellular carcinoma; n: number of each group; NA: not applicable; HCV: hepatitis virus C.
Clinical and radiological presentations are represented as frequency and percent.
Biochemical parameters of patients.
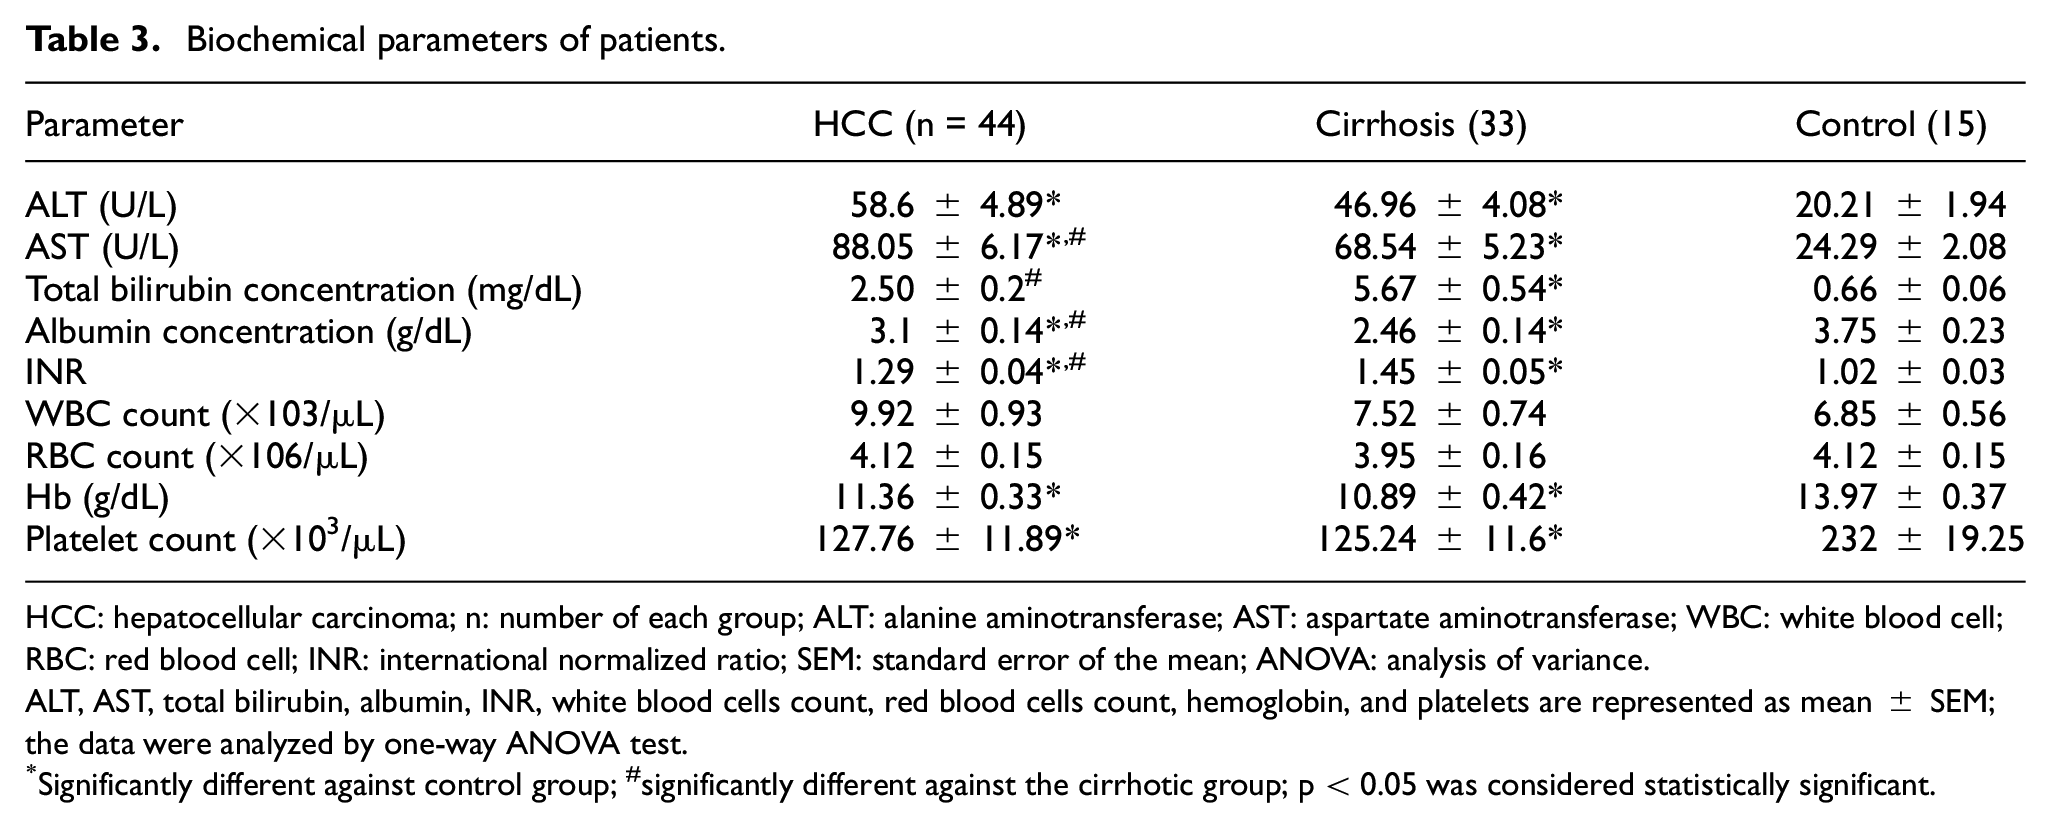
HCC: hepatocellular carcinoma; n: number of each group; ALT: alanine aminotransferase; AST: aspartate aminotransferase; WBC: white blood cell; RBC: red blood cell; INR: international normalized ratio; SEM: standard error of the mean; ANOVA: analysis of variance.
ALT, AST, total bilirubin, albumin, INR, white blood cells count, red blood cells count, hemoglobin, and platelets are represented as mean ± SEM; the data were analyzed by one-way ANOVA test.
Significantly different against control group; #significantly different against the cirrhotic group; p < 0.05 was considered statistically significant.
Association between serum PLK1 and clinicopathological parameters in HCC using the Kruskal–Wallis H test.

PLK1: polo-like kinase 1; AFP: α-fetoprotein; BCLC: Barcelona Clinic Liver Cancer; HCC: hepatocellular carcinoma; SD: standard deviation.
p < 0.05 was considered statistically significant.
Serum levels of AFP and PLK1 are significantly elevated in HCC patients
By comparing mean ± SEM of AFP and PLK1 markers between HCC, LC, and control groups, HCC patients showed a significant increase in serum AFP level than that in healthy control and LC groups, as indicated in Figure 1(a).

Serum concentrations of AFP and PLK1 in HCC, control, and cirrhosis groups. (a) Levels of serum AFP (ng/mL, mean ± SEM); (b) levels of serum PLK1 (pg/mL, mean ± SEM). The mean serum PLK1 level in HCC was significantly higher than in cirrhosis or healthy controls (p-value < 0.001 by ANOVA test followed by Tukey comparison test). *Significant difference when compared with the control group (p < 0.001).
Furthermore, HCC and cirrhotic patients showed a significant increase in PLK1 levels as compared to the control group. In addition, HCC patients showed a significant increase in PLK1 levels as compared to the LC group, as shown in Figure 1(b).
Correlation of serum PLK1 levels and baseline characteristics within cirrhotic and HCC groups
To investigate whether the increased PLK1 levels correlated with liver function in LC and HCC patients, we analyzed the correlation between serum PLK1 levels and alanine aminotransferase (ALT), AST, serum albumin, total bilirubin, and international normalized ratio (INR) levels. As indicated by our results, a significant positive correlation between PLK1 and AST enzyme activity was found in HCC patients (r = 0.36) (Supplementary Figure 1). No significant correlations were found between PLK1 serum levels with the other previously mentioned biochemical variables of LC and HCC groups (Table 5).
Pearson correlations between serum levels of PLK1 with the other biochemical variables within LC and HCC groups.
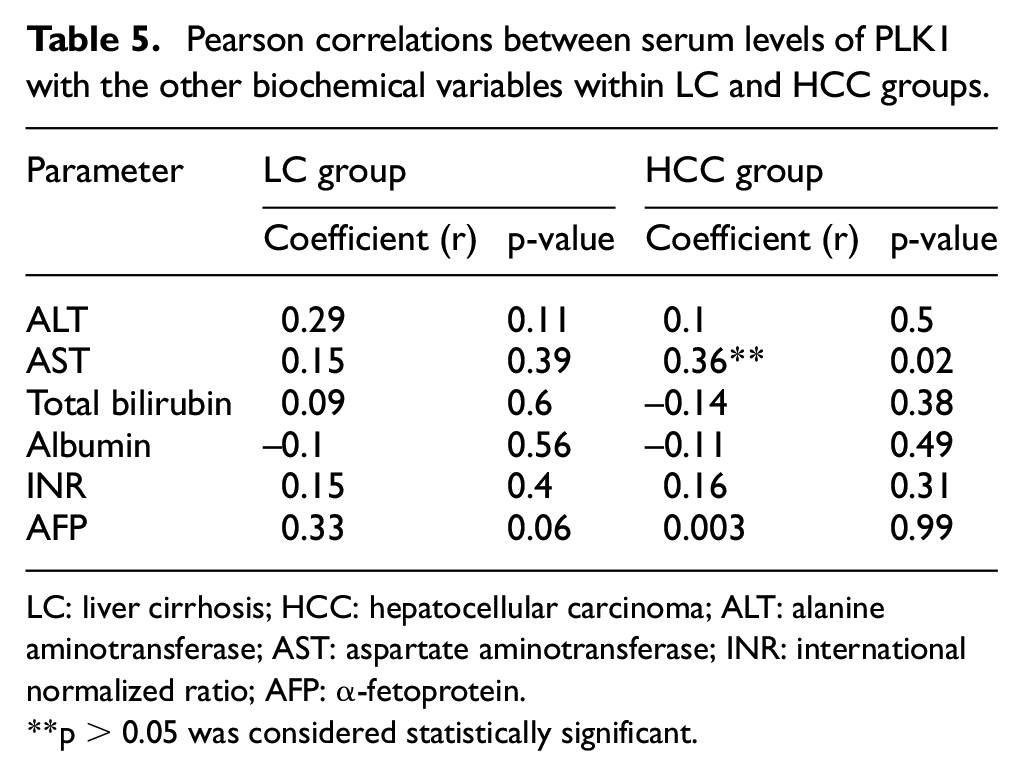
LC: liver cirrhosis; HCC: hepatocellular carcinoma; ALT: alanine aminotransferase; AST: aspartate aminotransferase; INR: international normalized ratio; AFP: α-fetoprotein.
**p < 0.05 was considered statistically significant.
Cutoff values and area under the curve calculations
In this study, 20 ng/mL was selected as the cutoff value for AFP based on the guideline 46 (0.766 (95% confidence interval (CI)), sensitivity 0.63, specificity 0.75). Receiver operating characteristic curves reflected that the optimum diagnostic cutoff value for PLK1 was 700 pg/mL (area under the curve (AUC) (0.971), sensitivity 0.75, specificity 1) as demonstrated in Table 6.
Sensitivity, specificity, positive predictive, and negative predictive values of serum AFP and serum PLK1 in the diagnosis of liver cirrhosis and HCC.

AFP: α-fetoprotein; HCC: hepatocellular carcinoma; PLK1: polo-like kinase 1
Combined PLK1 and AFP biomarkers increase the sensitivity and specificity of AFP
To evaluate whether the combined use of PLK1 and AFP measurements was better than the use of each biomarker alone, a new variable of predicted probability (p) for HCC was developed on the equation obtained from the binary logistic regression (all HCC vs all controls)47,48 and it is given as follows

The optimum cutoff value was 0.856 which is calculated from the combined variables. This showed a better predicting ability (AUC 0.986 (0.97–1), sensitivity 0.812, specificity 0.979), compared with AFP and PLK1 (p > 0.001). AUC, sensitivity, and specificity for AFP, PLK1, and the combination in the HCC diagnosis are indicated in Figure 2 and Table 7.
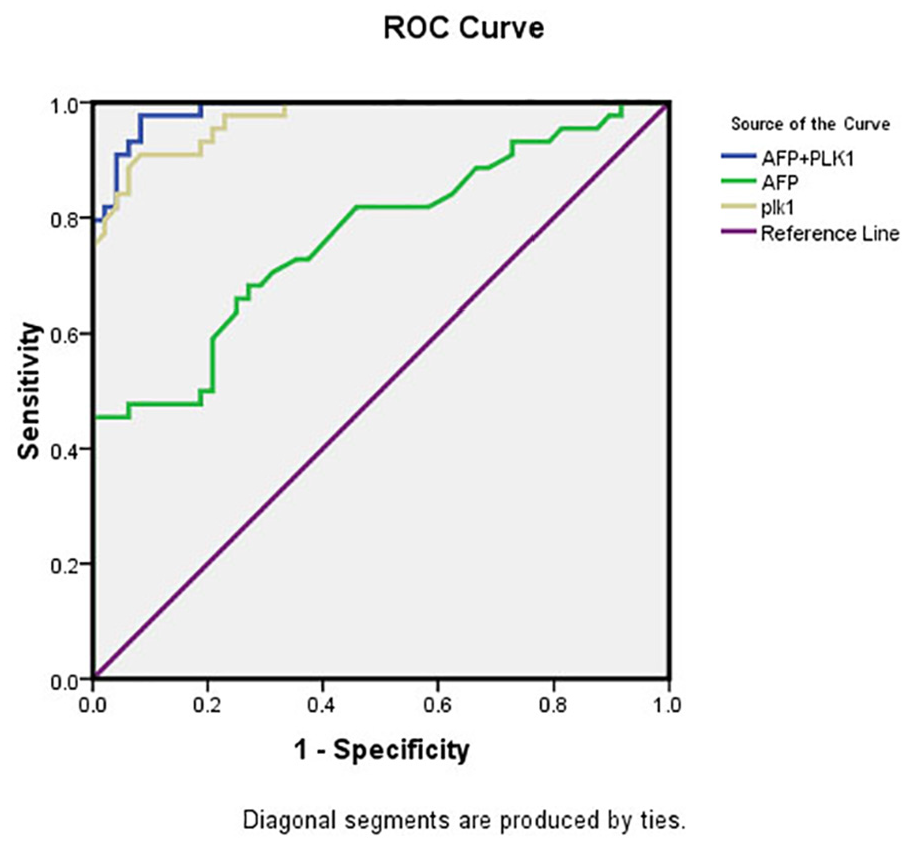
Receiver operating characteristics (ROC) curve for AFP, PLK1, and their combination in discriminating HCC patients from those with cirrhosis and healthy control. Serum PLK1 alone showed higher AUC (0.97) compared to that of AFP (0.76). Moreover, AUC of its combination with AFP was higher than each one alone (0.986).
Performance of AFP, PLK1, and the combination in the diagnosis of HCC.

AFP: α-fetoprotein; HCC: hepatocellular carcinoma; PLK1: polo-like kinase 1; CI: confidence interval.
DOX and Vola induce hepatic cancer cell death
Vola, a selective PLK1 inhibitor, was evaluated in comparison to DOX alone for inhibiting HCC cell viability. HepG2 and Huh-7 cells were treated with a serial concentration (10–1.25 µM) of DOX and Vola and cell viability was determined in the following day using the crystal violet assay. DOX inhibited cell proliferation in a dose-dependent manner with an IC30 of 3.59 μM in HepG2 and 6.34 μM in Huh-7 cells. Vola also reduced cell viability in a dose-dependent manner with an IC30 of 3.11 μM in HepG2 cells and 6.29 μM in Huh-7 cells (Figure 3).
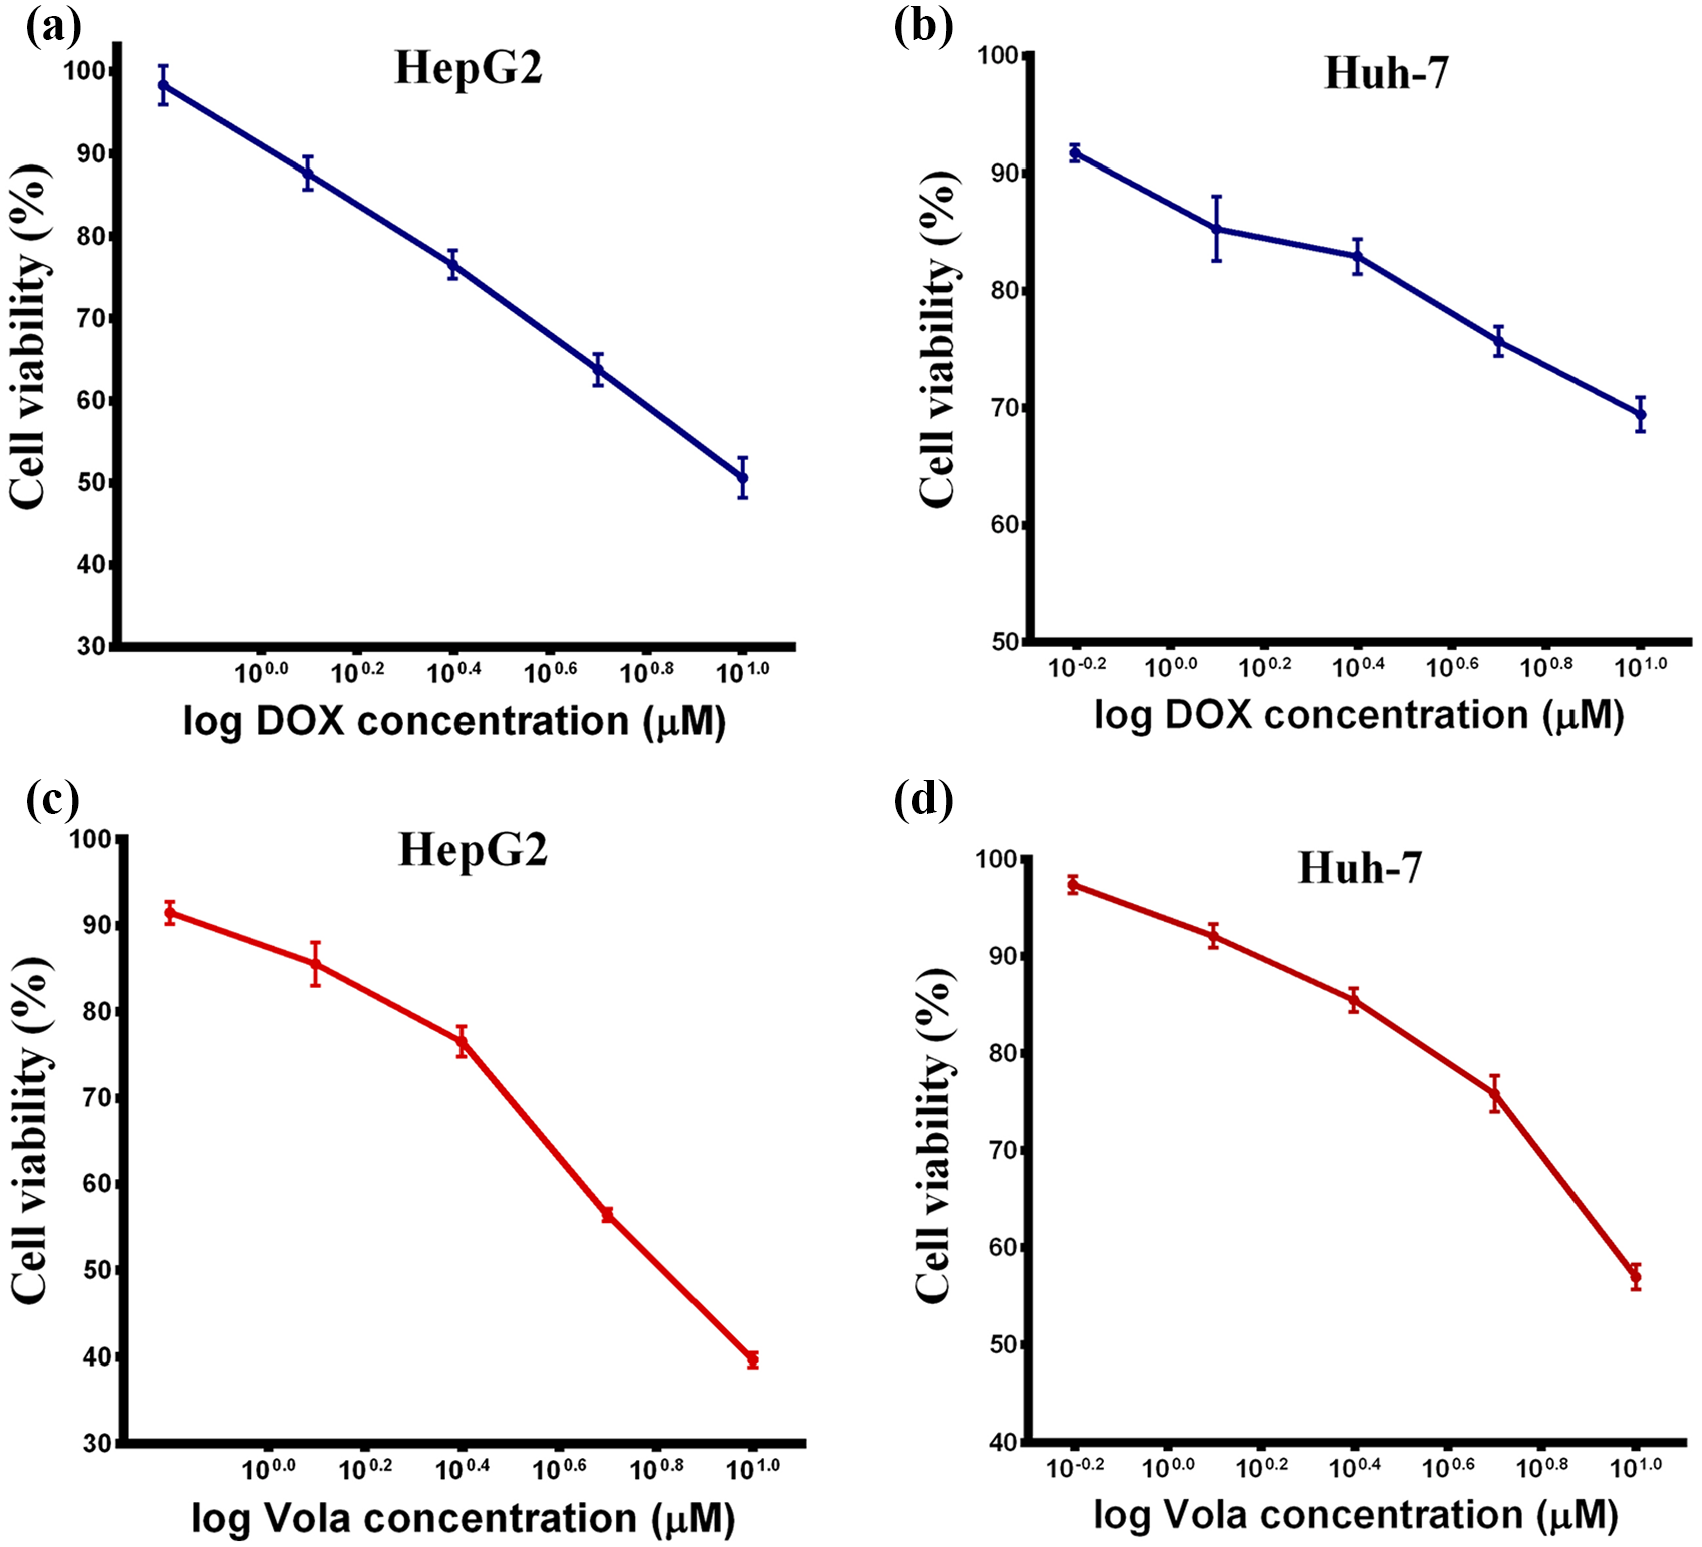
DOX and Vola induce significant cell death in HepG2 and Huh-7 cells. (a, b) HepG2 and Huh-7 cells were seeded in 96-well plates and then treated in the next day with DOX concentrations (10–0.625 µM) for 24 h. (c, d) HepG2 and Huh-7 cells were seeded in 96-well plates and then treated in the next day with Vola concentrations (10–0.625 µM) for 24 h. Cell viability was evaluated by crystal violet assay.
NOB suppresses liver cancer cell viability and significantly enhances the cytotoxic effect of DOX and Vola in hepatic cancer cells
NOB is a well-known natural compound exerting anticancer activity in several types of tumors. Therefore, we investigated its effect alone to induce cell death in HepG2 and Huh-7 cell lines. HepG2 and Huh-7 cells were treated with the indicated concentration of NOB. Then, cell viability was determined in the following day using the crystal violet. As shown in Figure 4, NOB alone was able to induce significant cell death in a dose-dependent manner with an IC30 of 30.61 μM in HepG2 and 43.56 μM in Huh-7 cells.

NOB induces significant cell death in HepG2 and Huh-7 cells. (a, b) HepG2 and Huh-7 cells were seeded in 96-well plates and then treated in the next day with NOB concentrations (100–6.25 µM) for 24 h. Cell viability was evaluated by crystal violet assay.
Furthermore, we investigated the effect of NOB on cell death induced by DOX and Vola. Treatment of HepG2 and Huh-7 with either NOB/DOX or NOB/Vola for 24 h resulted in a dose-dependent inhibition of cell viability. The addition of a low dose of NOB (10 µM) reduced IC30 for DOX and Vola to 2.18 and 2.28 µM, respectively, in HepG2 cells, and to 2.83 and 2.6 µM, respectively, in Huh-7 cells (Figure 5).

NOB enhances the cytotoxic effect induced by Vola and DOX. HepG2 and Huh-7 cells were seeded in 96-well plates and treated with serial dilution of DOX (a, b) or Vola (c, d) (0.625 – 10 µM) alone or in combination with NOB (10 µM) for 24 h. Cell viability was determined using the crystal violet assay.
The CI approach was used to determine whether these molecules caused additive or synergistic inhibition. When NOB (10 µM) was added to cells incubated with increasing doses of DOX or Vola, the combinatory effect was evident in both HepG2 and Huh-7 cells. For HepG2 cells, the CI values were 0.93 and 1 for DOX and Vola, respectively. For Huh-7 cells, the CI values were 0.66 and 0.63 for DOX and Vola, respectively, indicating synergism between NOB and DOX in both cell lines at IC30. Also, a synergistic effect was observed between NOB and Vola in Huh-7 while the effect was additive in HepG2 at IC30.
Potentiated downregulation of PLK1 and proliferating cell nuclear antigen and induction of apoptosis by the combination of NOB with DOX or Vola in HepG2 and Huh-7 cells
To explore NOB molecular mechanism of action, gene expressions of PLK1, proliferating cell nuclear antigen (PCNA), P53, PARP1, and caspase-3 were analyzed using RT-qPCR. As shown in Figure 6, following treatment of HCC cells with NOB, DOX, Vola, NOB/DOX, and NOB/Vola for 24 h, NOB significantly showed PLK1 expression decrease in NOB/DOX treated cells by 1.9-fold (p < 0.05) when compared with the DOX treated cells in HepG2, and also the Huh-7 treated with either NOB/DOX or NOB/Vola revealed significant decrease in PLK1 expression by threefold (p < 0.001) when compared with DOX and Vola treated cells, respectively (Figure 6(a)).

NOB significantly decreases the expression of PLK1 and PCNA and increases the expression of P53 induced by Vola and DOX. Cells were treated with 10 µM NOB alone or in combination with either 5 µM DOX or 1 µM Vola for 24 h. PLK1 (a), PCNA (b), and p53 (c) levels are measured by real time RT-PCR. The data are represented as fold change of the relative quantity of target mRNA which was normalized to GAPDH and was expressed as mean ± SEM compared with the controls.
Interestingly, NOB/DOX and NOB/Vola HepG2 treated cells showed a significant PCNA expression decrease by 2.3-fold and 3.8-fold (p ≤ 0.001), as compared to DOX and Vola treated cells, respectively, and also, the PCNA expression in NOB/DOX treated cells was significantly 1.8-fold (p ≤ 0.001) lower than that in the DOX treated cells in Huh-7 which is consistent with the decreased cell growth when cells were exposed to combinatorial therapy (Figure 6(b)).
Furthermore, as expected, NOB/DOX and NOB/Vola HepG2 treated cells demonstrated significant P53 expression increased by 1.6-fold and 1.4-fold (p < 0.001) as compared to DOX and Vola treated cells, respectively, and also, the expression of P53 in NOB/DOX treated cells was significantly 1.38-fold (p < 0.05) higher than that in the DOX treated cells in Huh-7 (Figure 6(c)).
NOB activates caspase cascade in DOX and Vola treated cells
As shown in Figure 7(a), NOB/DOX and NOB/Vola HepG2 treated cells showed a 1.93-fold and a 2.8-fold significant increase in the expression of caspase-3 gene (p ≤ 0.001) when compared with DOX and Vola treated cells, respectively. Moreover, NOB/DOX and NOB/Vola Huh-7 treated cells showed significant caspase-3 gene expression increase by 2.53-fold and 2.66-fold (p ≤ 0.001) when compared with DOX and Vola treated cells, respectively.

NOB significantly increases the expression of PARP1 and caspase-3 induced by Vola and DOX. Cells were treated with 10 µM NOB alone or in combination with either 5 µM DOX or 1 µM Vola for 24 h. Caspase-3 (a) and PARP1 (b) levels are measured by real time RT-PCR. The data are represented as fold change of the relative quantity of target mRNA which was normalized to GAPDH and was expressed as mean ± SEM compared with the controls.
Furthermore, NOB/DOX and NOB/Vola HepG2 treated cells showed 1.26-fold and 1.3-fold (p ≤ 0.001) significant increase in PARP1 gene expression when compared with DOX and Vola treated cells, respectively. And also, NOB/DOX and NOB/Vola Huh-7 treated cells showed significant PARP1 gene expression increase by 1.36-fold and 1.31-fold (p ≤ 0.001) as compared to DOX and Vola treated cells, respectively (Figure 7(b)).
Eventually, the apoptotic effect was examined by measuring the caspases-3 activity in HepG2 and Huh-7 cell lysates. The results obtained showed an increase of the enzyme activities in NOB/DOX and NOB/Vola HepG2 treated cells by 82.4% and 140.9% when compared with DOX and Vola treated cells, respectively. And also, NOB/DOX and NOB/Vola Huh-7 treated cells showed an increase in the caspase-3 enzyme activity by 142.5% and 185% when compared with DOX and Vola treated cells, respectively, which is consistent with the decreased cell growth when cells were exposed to combination therapy (Figure 8).

NOB significantly increases caspase-3 activity induced by Vola and DOX. The effect of 10 µM NOB alone or in combination with either 5 µM DOX or 1 µM Vola for 24 h on Caspase-3 concentration in the cell lysates of HepG2 and Huh-7 treated cells was measured by ELISA. Data are presented as means ± SEM (N = 6) and were analyzed using one-way ANOVA followed by Tukey’s comparison test.
PLK1 downregulation induced by DOX and Vola and their combination with NOB correlates with induction of apoptosis and subsequent cell death
As far as PLK1 level was significantly elevated in the HCC group, it was interesting to analyze the correlations between PLK1 with either apoptotic markers such as caspase-3, PARP1, P53, or cell proliferation in HCC cell lines (HepG2 and Huh-7).
Statistical analysis revealed that in HepG2 cell line, there is a significant negative correlation between PLK1 and caspase-3 (r = –0.69) (Figure 9(a)), a strong significant negative correlation between PLK1 and P53 (r = –0.78) (Figure 9(b)), and significant positive correlation between PLK1 and PCNA (r = 0.71) (Figure 9(c)).

PLK1 correlation with apoptotic markers and cell proliferation in the HepG2 cell line. PLK1 expression correlated with caspase-3 activity, P53 gene expression, and cell proliferation in the HepG2 cell line either untreated or treated with either NOB, DOX, Vola, DOX/NOB, or Vola/NOB. PLK1 correlated with caspase-3 activity (a), P53 gene expression (b), and cell proliferation (c) in the HepG2 cell line.
In addition, in Huh-7 cell line, there is a significant negative correlation between PLK1 and caspase-3 (r = –0.75) (Figure 10(a)) or P53(r = –0.91) (Figure 10(b)) and significant positive correlation between PLK1 and PCNA (r = 0.817) (Figure 10(c)) indicating that PLK1 inhibition activates caspase cascade and increases apoptosis.
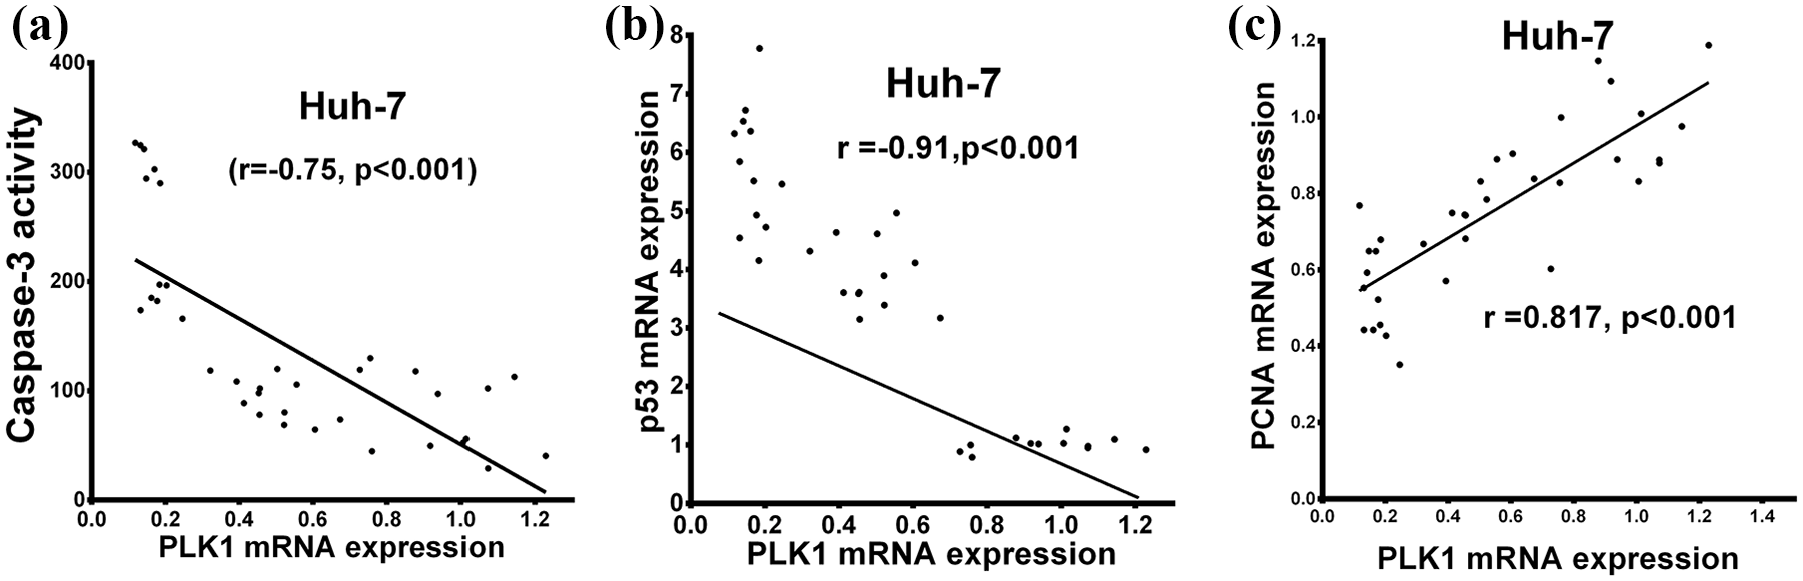
PLK1 correlation with apoptotic markers and cell proliferation in the Huh-7 cell line. PLK1 expression correlated with caspase-3 activity, P53 gene expression, and cell proliferation in the Huh-7 cell line either untreated or treated with either NOB, DOX. Vola, DOX/NOB, or Vola/NOB. PLK1 correlated with caspase-3 activity (a), P53 gene expression (b), and cell proliferation (c) in the Huh-7 cell line.
Discussion
Human HCC is one of the popular and fatal tumors in the world.1,49 The survival of HCC patients has improved with advances in surgical techniques, including liver transplantation. 50 Although new strategies for HCC treatment are available, the overall mortality rate continues to remain high.10,51 AFP has been widely used for HCC diagnosis as almost all HCCs detected had a high level of AFP.48,52–54 However, recent research has been conducted to identify new molecules for diagnosis and therapeutic targets to improve HCC patient’s outcome.51,55,56
PLK1 plays a critical role in proliferating cells mitotic entry and regulates numerous aspects of mitosis. 57 It was reported to be implicated in HCC pathogenesis, progression, and metastasis through several mechanisms.58,59 For example, PLK1 is able to activate phosphatidylinositol 3-kinase/protein kinase B (PI3K/Akt) signaling pathway through phosphorylation of PTEN at Ser385 preventing PTEN degradation and facilitating its accumulation at the cytoplasm, where it is less active.60,61 Furthermore, the oncogenic role of PLK1 and its overexpression has been well observed in different malignant tumor cells, including ovarian cancer, 62 non-small lung cancer,63,64 pancreatic cancer,65,66 esophageal squamous cell carcinoma, 66 HCC,58,59,67 bladder cancer, 68 gastric cancer69,70 which have generally high mitotic ratios. 71 Likewise, the PLK1 level was significantly high in HCC patients used in the current study (Figure 1(b)). Not only that but also the PLK1 level in HCC patients correlated significantly with both liver functions as indicated by the positive correlation between PLK1 levels and serum AST and tumor size (Table 4). These results were in agreement with previous studies that found PLK1 overexpressed in tissues of the tumor, while no expressions were detected in adjacent normal tissue or regenerating nodules.10,72
In spite of recent advances in chemotherapeutic agents for HCC treatment, the results of chemotherapy remain unsatisfactory due to multidrug resistance, damaging healthy cells, and toxicity.73–76 DOX is a well-known chemotherapy which exerts broad efficacy against several cancer types. 77 It was proved that DOX induced DNA damage and cancer cell death mainly through a p53-dependent mechanism of apoptosis. 78 Recently, it has been proved that PLK1-mediated p53 inactivation participates in DOX resistance. 79 DOX resistance takes place through two PLK1 substrates that negatively regulate p53. One of them is GTSE1 which is capable of downregulating the p53 through translocating into the nucleus, binding to and shuttling p53 out from the nucleus, and causing its degradation. 80 The second substrate of PLK1 is Topors (topoisomerase I-binding protein) which is a ubiquitin and leads to P53 degradation. 81 One approach to minimize chemotherapy resistance is to use them in combination with a natural product. NOB is a known natural compound that exhibited a chemo-sensitizing effect in several cancer cell lines.82–84
A number of studies have investigated the combined effect of NOB with chemotherapeutic agents in treating cancers. Ma et al. 3 demonstrated that NOB was capable of enhancing the sensitivity of multidrug-resistant A2780/T cancer cells toward paclitaxel through hindering the efflux function of ABCB1 transporter and repressing the chemoresistance-related AKT/extracellular signal-regulated kinase (ERK)/Nrf2 pathways. The combined effect of NOB and 5-fluorouracil on gastric cancer was observed to be superior to those of individual usages through both p53-dependent and p53-independent pathways. 82 It was reported that NOB showed synergistic inhibition with paclitaxel and carboplatin against the non-small cell lung cancer cell lines. 83 Moreover, Li et al. 84 found that NOB enhanced the antiproliferative and apoptotic effect of oxaliplatin in colorectal cancer cells by modulating the PI3K/Akt/mTOR pathway. In addition, PLK1 activation requires not only phosphorylation on Thr210 but also it requires Ser99 phosphorylation which depends on the catalytic activity of Akt. 85 PI3K inhibitor LY294002 induces cancer cell apoptosis through activating the caspase pathway through suppression of PLK1 expression. 86 Several studies reported the ability of NOB to inhibit AKT which was recognized as the main signal for cell survival and proliferation in various types of cancer.26,87–89 At the same time, recent studies have demonstrated that inhibition of PI3K/AKT/mTOR signaling sensitized cancer cells to chemotherapeutics.84,90 Therefore, we were motivated to analyze the ability of NOB to sensitize HCC cell lines to DOX- and Vola-induced cell death. As indicated by our results, NOB alone inhibited HepG2 and Huh-7 viability in a dose-dependent manner (Figure 4(a) and (b)). In addition, NOB enhanced DOX and Vola anticancer activity as suggested by the marked decrease in cell viability in NOB/DOX and NOB/Vola groups when compared with DOX and Vola groups, respectively (Figure 5). This is in accordance with the previous studies.28,91,92 The synergistic activity of NOB in combination with DOX or Vola may be attributed to the significant decrease in PLK1 expression in combination groups (Figure 6(a)).
P53, tumor suppressor protein, is a critical regulator of cell cycle arrest and apoptosis. 93 During DNA damage, the p53 is normally activated and accumulated to perform its DNA-binding activity for the regulation of various genes that are participated in cell cycle regulation and apoptosis induction. 94 It was reported that PLK1 was capable of regulating p53 activity through several pathways. PLK1 directly inhibits p53 transcriptional activity and pro-apoptotic function by interacting with the DNA-binding domain of p53. 10 In addition, PLK1 contributes to p53 ubiquitination and degradation either directly through MDM2 phosphorylation or indirectly through AKT activation.95,96 Therefore, PLK1 may be essential for p53 to adequately exert its tumor suppressive functions, and that overexpression of PLK1 may negatively control p53 pathway. 96 That was reinforced in the current study by a significant negative correlation between PLK1 and P53 gene expression (Figures 9(b) and 10(b)).
PCNA is a 36 kDa molecule that is well conserved among species and plays a vital role in regulating the cell cycle. 94 It is a valuable marker for proliferative activity, which is necessary for DNA synthesis and functions as a significant marker for determining the proliferation of various cancers.97,98 More recently, an unexpected function of cytoplasmic PCNA has emerged where PCNA binds to procaspases −3, −8, −9, and −10, inhibiting their activation and disabling apoptosis. 99 It was found that either PLK1 inhibition by small molecule inhibitors or PLK1 knockdown by siRNAs causes cell cycle arrest, reduces tumor proliferation, and induces apoptosis of HCC cells.10,100,101 It was revealed that the caspase-3 and caspase-7 activities and apoptosis induction increase after the depletion of PLK1. 102 This was confirmed by the significant positive correlation between PLK1 gene expression and PCNA gene expression (Figures 9(c) and 10(c)) and the significant negative correlation between PLK1 and caspase-3 activity (Figures 9(a) and 10(a)).
In this study, we found a significant increase in PLK1 levels in human HCCs. Meanwhile, our data further demonstrated that PLK1 downregulation by DOX or Vola either alone or in combination with NOB inhibited the HCC cell lines growth and promoted apoptosis. All these effects were related to the p53 signaling pathway. Accordingly, we assume that PLK1 serves as a potential target for the diagnosis and treatment of HCC.
Conclusion
This study represents the first report indicating an increase of PLK1 level in the Egyptian HCC patients with higher sensitivity and specificity than AFP. Moreover, HCC treatment with DOX and Vola either alone or in combination with NOB induces a significant decrease in PLK1 level and enhancement of cell death. Therefore, PLK1 may represent a novel biomarker for the diagnosis and treatment of HCC patients.
Supplemental Material
supplementary_Fig._1 – Supplemental material for Polo-like kinase 1 as a promising diagnostic biomarker and potential therapeutic target for hepatocellular carcinoma
Supplemental material, supplementary_Fig._1 for Polo-like kinase 1 as a promising diagnostic biomarker and potential therapeutic target for hepatocellular carcinoma by Eman H. Yousef, Mohamed E El-Mesery, Maha R Habeeb and Laila A Eissa in Tumor Biology
Supplemental Material
supplementary_tables – Supplemental material for Polo-like kinase 1 as a promising diagnostic biomarker and potential therapeutic target for hepatocellular carcinoma
Supplemental material, supplementary_tables for Polo-like kinase 1 as a promising diagnostic biomarker and potential therapeutic target for hepatocellular carcinoma by Eman H. Yousef, Mohamed E El-Mesery, Maha R Habeeb and Laila A Eissa in Tumor Biology
Footnotes
Author contributions
E.H.Y. performed the practical work, constructed statistical and data analysis, and finally wrote the manuscript. L.A.E. and M.E.E-M. revised the manuscript and supervised the practical work. M.R.H. supervised the practical work.
Declaration of conflicting interests
The author(s) declared no potential conflicts of interest with respect to the research, authorship, and/or publication of this article.
Funding
The author(s) received no financial support for the research, authorship, and/or publication of this article.
Informed consent
Informed consent was obtained from all individual participants included in the study.
Supplemental material
Supplemental material for this article is available online.
References
Supplementary Material
Please find the following supplemental material available below.
For Open Access articles published under a Creative Commons License, all supplemental material carries the same license as the article it is associated with.
For non-Open Access articles published, all supplemental material carries a non-exclusive license, and permission requests for re-use of supplemental material or any part of supplemental material shall be sent directly to the copyright owner as specified in the copyright notice associated with the article.