
Abstract
The involvement of microRNA in cancers plays a significant role in their pathogenesis. Specific expressions of these non-coding RNAs also serve as biomarkers for early colorectal cancer diagnosis, but their laboratory/molecular identification is challenging and expensive. The aim of this study was to identify potential microRNAs for colorectal cancer diagnosis using in silico approach. Sequence similarity search was employed to obtain the candidate microRNA from the datasets, and three target prediction software were employed to determine their target genes. To determine the involvement of these microRNAs in colorectal cancer, the microRNA gene list obtained was used alongside with colorectal cancer expressed genes from gbCRC and CoReCG databases for gene intersection analysis. The involvement of these genes in the cancer subtype was further strengthened with the DAVID database. KEGG and Gene Ontology were used for the pathway and functional analysis, while STRING was employed for the interactions of protein network and further visualized by Cytoscape. The cBioPortal database was used to prioritize the target genes; prognostic and expression analysis were finally performed on the candidate microRNAs and the prioritized targets. This study, therefore, identified five candidate microRNAs, two hub genes (CTNNB1 and epidermal growth factor receptor), and seven significant target genes associated with colorectal cancer. The molecular validation studies are ongoing to ascertain the biological fitness of these findings.
Keywords
Introduction
Colorectal cancer (CRC) is one of the commonly diagnosed cancers and the second cause of cancer mortality in the world. Jemal et al. 1 reported the rate of prevalence and mortality of CRC to be over 1 million and 600,000 cases per year, respectively, despite the diagnosis and treatment of this disease. The increasing rate of incidence and mortality of this disease is, therefore, a public health issue. 2 Immensely, patients’ survival corresponds to tumor stage at the period of diagnosis and approximately 50% has been attributed to death due to metastasis.3,4 Alterations, such as genetic and epigenetic, can alter tumor suppressor genes (DCC, APC, SMAD4, and TP53) and oncogenes (KRAS) in CRC.5,6 One of the basic procedures driving the initiation and progression of CRC is the accumulation of a variety of genetic and epigenetic changes in epithelial cells of colorectum. 7 The significant challenge to the management of CRC is early detection worldwide, which makes the present treatment options to be administered so late after tumor metastasis. If tumors are detected early enough, and polyps are surgically resected, they could reduce both the incidence and death rate of CRC. Tools involved in the early detection are faced with numerous challenges thereby limiting the development of standardized biochemical diagnostic approaches which are non-invasive, more sensitive, and specific for CRC stages. To accomplish this, more non-invasive, selective, and specific diagnostic biomarker which can detect a tumor at an early stage is important.
MicroRNAs are attracting considerable interest, with expanding proof on the role of microRNAs’ expression in CRC development and progression. 8
MicroRNAs are involved in numerous biological and pathological processes, and dysregulation of these microRNAs has been strongly associated with CRC pathogenesis. 9 Since the expression pattern of microRNAs has been confirmed to be different between tissues and body fluids when compared to normal, they can be referred to as oncomiR and tumor suppressor microRNA and thus, they can be utilized as diagnostic, prognostic, and predictive biomarkers of CRC. 10 The identification of prognostic and predictive biomarkers is, therefore, crucial to certify the standard of purity in cancer genomics. The discovery of these microRNAs, which predominate at different stages of CRC, can permit a more comprehensive evaluation and understanding of their effects. This can additionally provide exciting opportunities for CRC pathogenesis, diagnosis, and treatment insights into CRC management.
Molecular approaches to identify these microRNAs for diagnostic and predictive biomarkers for CRC have suffered major restraints, such as the appropriate procedure to follow, time consumption, laborious, and expensive. 11 Since the development of a diagnostic microRNA biomarker to distinctly monitor colorectal carcinogenesis is important to enhance the diagnosis rate at latter stages, the in silico approach toward the identification of microRNAs and for diagnostics for CRC is largely required. The overall experimental approach is represented in Figure 1(a) and (b).

Experimental design of the study. (a) The data selection process for candidate microRNA. (b) Target prediction and further analysis.
Materials and methods
Data selection
Total microRNA sequences were retrieved from miRBase 12 at http://www.mirbase.org/ as reference dataset, while microRNAs associated with CRC were obtained from dbDEMC 2.0 at http://www.picb.ac.cn/dbDEMC/, 13 miR2Disease at http://www.mir2disease.org/, 14 HMDD at http://www.cuilab.cn/hmdd, and miRCancer at http://mircancer.ecu.edu/ 15 and pulled together for the query dataset. Furthermore, duplicates were removed using the script in Clustering Database at High Identity with Tolerance (CD-HIT) suit from each dataset to obtain unique sequences.
Sequence similarity search
For the identification of candidate microRNAs, sequence analysis was employed using standard available search tools, such as Basic Local Alignment Search Tool (BLAST) at https://blast.ncbi.nlm.nih.gov/ 16 and homology detection and CD-HIT. 17 BLASTN and CD-HIT-EST-2D were locally run between the two datasets (reference and query) using command lines with the following parameters: sequence identity threshold of 0.90, e-value of 1 × 10⁻³, and word size of 7. The results of the search were further text mined to obtain the final list of candidate microRNAs together with the validated clusters.
MicroRNA target prediction
The targets of these microRNAs were identified using three different databases, namely miRDB at http://www.mirdb.org/index.html, TargetScan at http://www.targetscan.org/vert_72, and mirDIP at http://ophid.utoronto.ca/mirDIP/index.jsp, according to microRNA sequences and the following criteria: miRNA 3′ Site,18,19 Conservation Status,18,20 and the Seed Region.18,21 Using these three algorithms, the two lists generated from the sequence similarity search (candidate and validated microRNAs) were queried separately and further analyzed by the intersection analysis with R-package (https://cran.r-project.org/) to obtain a unique gene list after the removal of redundancies.
Gene correlation
To discover the correlation of the gene list generated, it was further queried with CRC databases, namely gene browser for CRC (gbCRC) at http://gbcrc.bioinfo-minzhao.org/ and CRC for the gene database (CoReCG) at http://lms.snu.edu.in/corecg/gene. Intersection analysis between the genes obtained and the previous gene list provided a unique gene list and a lead of their association with CRC.
Identification of genes associated with CRC
DAVID database (Database for Annotation, Visualization, and Integrated Discovery) accessed at http://david.abcc.ncifcrf.gov/ gives a high-throughput and attractive data collection condition and merges functional genomic annotations with intuitive graphical representations encouraging the transition between genomic information and the biological meaning. 22 According to Liu et al., 23 using this database, GENETIC_ASSOIATION_DB_DISEASE analysis was carried out to identify genes associated with CRC from differentially expressed genes. The genes associated with CRC were defined as differentially expressed genes that were significantly related to CRC (final gene list; p < 0.05). 24
Analysis of protein–protein interaction network and identification of hub genes for CRC
STRING database (Search Tool for the Retrieval of Interacting Genes) accessed at http://string-db.org/ is a unique tool, equipped for providing a comprehensive view of all the known and predicted interactions and associations among proteins. 25 To clarify the interactions in the final gene list, STRING online software was used to construct a protein–protein interaction (PPI) network using the CRC genes, and the network was visualized using Cytoscape open-source software at http://www.cytoscape.org/. 26 In the interaction network, the genes in the network served as “nodes” and the link connecting two nodes represents a pairwise protein interaction. The degree of a node corresponds to the number of interactions that the protein is in possession of. The nodes with the highest degree of connection were considered the “hub” genes in the interaction network 23 at a confidence level of 0.9.
Gene prioritization
cBioPortal database accessed at http://www.cbioportal.org/index.do was used for Cancer Genomics exploration in this study. The genomic datasets were queried using cBioPortal with the option to query single cancer study and also to query the microRNA target genes across cancer studies with the aim of viewing the relevant genomic alterations in the microRNA target genes in CRC samples. All the 225 cancer samples in this database were selected first followed by all the six samples specific for CRC and finally, targeted sequencing of 1134 samples from metastatic CRC samples. Mutations and Putative copy-number alterations were also selected as the genomic profiles. The microRNA target gene list was queried across all the 225 samples present followed by the six CRC samples, while the final query was done against targeted sequencing of 1134 samples from metastatic CRC samples (MSK, Cancer Cell, 2018). 27
Gene Ontology and KEGG pathway enrichment analysis
Gene ontology (GO) accessed at http://www.geneontology.org/ is a database that provides vocabularies and classifications in relation to the molecular and cellular structures and functions for biological annotations of genes. 28 GO terms consist of three categories: biological process (BP), cellular component (CC), and molecular function (MF). The KEGG database at https://www.genome.jp/kegg/pathway.html contains sufficient information regarding the known metabolic pathways and regulatory pathways and accelerates the mapping of genes to KEGG pathways for systemic analysis of gene functions. 29 To provide an insight into the precise biological function and signaling pathways involved with the CRC genes identified in this study, GO and KEGG pathway enrichment analysis was performed for the differentially expressed gene list previously obtained. The p-value represents the probability that the number of genes selected for any of the three domains occurred by chance. In general, the lower the p-value, the greater the likelihood that the terms are significant. For this reason, the GO term selected was at false discovery rate (FDR) of <0.01 (p-value < 0.01) using Benjamini–Hochberg procedure, 30 and KEGG pathways with p < 0.05 were eliminated.
Prognosis and expression analysis
In cancer research, the relationship between a gene and clinical result proposes the underlying etiology of the disease and therefore can motivate further studies. PROGmiR accessed at http://xvm145.jefferson.edu/progmir/ is a database for identifying prognostic microRNA biomarkers in multiple cancers using publicly available data. 31 SurvMicro accessed at http://bioinformatica.mty.itesm.mx:8080/Biomatec/Survmicro.jsp is a database used for the assessment of microRNA-based prognostic signatures for cancer clinical outcomes by multivariate survival analysis, 32 SurvExpress accessed at http://bioinformatica.mty.itesm.mx:8080/Biomatec/SurvivaX.jsp is an online biomarker validation tool and database for cancer gene expression data using survival analysis, 33 and PrognoScan accessed at http://dna00.bio.kyutech.ac.jp/PrognoScan/ provides a powerful platform for evaluating potential tumor markers and therapeutic targets in other to correlate cancer research. The database also serves as a tool for meta-analysis of the prognostic value of genes, 34 and dbDEMC accessed at http://www.picb.ac.cn/dbDEMC/ is a database used to assess the differential expression of microRNAs in human cancer. In this study, the prognostic and expression analysis were performed on all the candidate microRNAs and their target genes (generated from cBioPortal). PROGmiR and SurvMicro were used for microRNA prognostic analysis, while SurvExpress and dbDEMC were employed for their expression analysis. For the target genes, PrognoScan and FIREBROWSE were used for both the prognostic and the expression analysis.
Results
The following databases provide information regarding experimentally validated microRNAs as well as their involvement in CRC: miRCancer, miR2Disease, HMDD, and dbDEMC2. The databases were used to download all microRNAs associated with CRC. A total of 2024 microRNAs were retrieved from the databases and subjected to CD-HIT-EST for duplicate and redundancy removal. At the end of this analysis, a total of 125 unique microRNAs with involvement in CRC were obtained. These 125 microRNAs were used as the query dataset. A total of 2694 microRNA sequences were downloaded from miRBase (total microRNAs); after the removal of duplicates and redundancies, 2226 microRNAs were found to be unique and this list was used as the reference dataset. The two datasets were then saved as FASTA sequences for similarity search.
Sequence similarity search for candidate microRNAs
The significance of BLASTN is to discover regions of sequence similarity, which will yield functional and evolutionary clues about the structure and function of a novel sequence. Also, the polycistronic structure of microRNA cluster genes sets them apart from most protein-coding genes in animals. This confers upon them a unique ability and specificity for widespread gene regulation in the complex molecular networks for development and disease. 35 Clustering of microRNAs has been reported to relate functions by regulating processes in a biological environment. 36 In silico experiment relating functions through clustering has also been proven to be a useful tool in Biotechnology.37,38 In this study, the result of BLASTN and CD-HIT-EST-2D produced 26 and 43 microRNAs, respectively, from 125 validated query sequences and 2226 total microRNA sequences as the reference microRNAs. The 26 microRNA list obtained from BLASTN was based on the parameters of the expected value of 1 × 10⁻³, word size of 7, and similarity between 90% and 99%. The result of the CD-HIT-EST-2D obtained was based on a threshold of 0.90 and a word size of 7. After intersection analysis (Figure 2), a total of 16 microRNAs were found to be unique to both CD-HIT-EST-2D and BLASTN. This list was further prioritized by text mining and the novelty was confirmed in the PubMed database. The final result of five microRNAs was confirmed to be candidate microRNAs used for CRC (Table 1).

Number of microRNAs obtained using sequence similarity search with 90%–99% sequence similarities.
Candidate microRNAs and their clusters.

Target genes prediction
Five candidate microRNAs were submitted using their IDs alongside with their clusters (validated microRNAs) to three target prediction tools, namely human TargetScan, miRDB, and mirDIP, to generate lists of individually predicted genes. The common genes from both the candidate and the validated microRNAs obtained from intersection analysis were saved in an excel file after duplicate removal. From the result, a total of 6664 target genes were identified for the five microRNAs sharing 5829 unique genes (Figure 3).
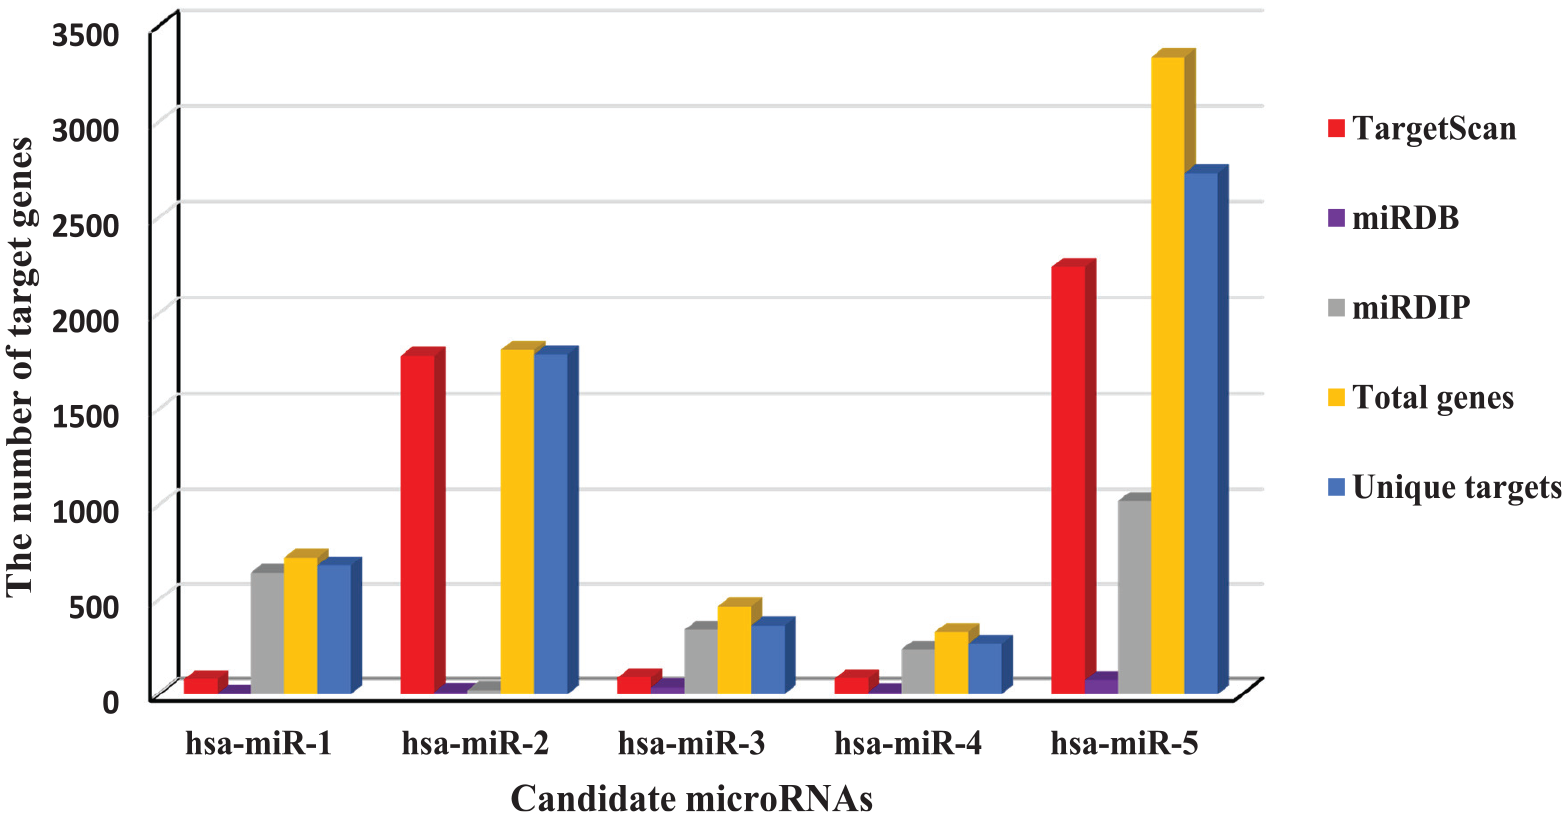
Number of genes targeted by the five microRNAs and relevant databases.
CRC gene association
The gene browser for CRC (gbCRC) and CRC database (CoReCG) were used to ascertain that there is a link/relationship between the predicted genes and the genes specific for CRC. A total of 2084 unique genes from these databases were used alongside the predicted microRNA target gene for intersection analysis. Figure 4 represents the analysis result. Intersected genes (96, 256, 60, 46, and 338 genes) were unique to the gene lists associated with microRNAs obtained above.

(a–e) Number of intersecting genes between the candidate microRNA target genes and CRC verified genes.
Enrichment analysis
Each of the lists of genes obtained (Figure 4) was submitted individually to DAVID to determine the enrichment in CRC. In total, 19 genes from the first microRNA were annotated to CRC, 28 genes were found in the second microRNA, while 8, 6, and 49 genes were enriched in CRC for third, fourth, and fifth candidate microRNAs. In summary, 110 genes were annotated to CRC and 82 of these genes were unique.
Gene prioritization
The microRNA target gene list was queried against all the 225 clinical data available in cBioPortal and the result was presented in a chart showing the frequency of alteration in descending order (Figure 7). It was further queried in the six CRC samples, while the final query was done against targeted sequencing of 1134 samples from metastatic CRC samples (MSK, Cancer Cell, 2018). 27 A list of 17 genes was obtained as the final gene list for the expression and prognostic analysis. These genes were selected based on the alteration frequency of ≥2%.
Prognostic and expression analysis of the candidate microRNAs
The five candidate microRNAs submitted to PROGmiRV2 and dbDEMC databases returned no result for prognostic and expression analysis, respectively, in CRC. Considering that these microRNAs are not associated with CRC as observed within the databases and text mining, the results in PROGmiRV2 strengthen the notion that these microRNAs are potential candidates for CRC. Has-mir-145 was further used as a control.
Expression analysis for microRNA target genes (SurvExpress)
The figure shows the result from the microRNA prioritized target gene list for CRC in SurvExpress database. Box plots across risk groups showed the expression levels and p-values resulting from a t-test of the different expression between high-risk (red) and low-risk (green) groups in CRC patients.
Prognostic analysis of the target gene list using PrognoScan
The data analysis utilizes the p-min approach to assess the cut-off point or the quantitative prognostic factor in continuous gene expression data measurement for patients grouping. 39 Patients are ordered by expression value of a given gene followed by the division of the expression group at all potential cut-off points into high and low, and the log-rank test estimates the risk difference of the two groups. The optimal cut-off point that gives the most pronounced p-min was chosen. Although this approach causes inflation of a type 1 error due to multiple correlated testing,40–42 the p-value correction is conducted to reduce the error type rate. 43 For the microRNA target genes, the cut-off point determination and prognostic value assessment were applied to all possible combinations of dataset, probe, and endpoint.
Discussion
CRC still remains a major public health issue and a life-threatening disease. 44 The study was carried out to determine candidate microRNAs and their associated target genes that can serve as potential diagnostic biomarkers involved in CRC. A total of five candidate microRNAs were screened out using sequence similarity search between four experimentally validated CRC microRNA databases and total microRNAs from miRBase (Figure 1 and Table 1). Using three microRNA target prediction tools, 5829 differentially expressed genes were discovered and further screened through two CRC databases and their enrichment was analyzed in DAVID to obtain a unique list of 82 genes (Figure 3). In a nutshell, the five candidate microRNAs obtained can regulate 82 differentially expressed genes in cancer subtype (Figure 4).
KEGG pathway analysis at FDR of 1.2 × 10⁻⁹ showed that the microRNA target genes were enriched in various pathways, including FoxO signaling pathway, p53 signaling pathways, apoptosis, microRNAs in cancer, CRC, pathways in cancer, proteoglycans in cancer, GnRH signaling pathway, Rap1 signaling pathway, p13k-Akt signaling pathway, and prostate cancer at p < 0.01. This suggests that abnormal pathways would be a significant cause of CRC45–48 (Figure 5). In the PPI network, CTNNB1 (beta-catenin) and epidermal growth factor receptor (EGFR) were discovered as hub genes, which contain the highest number of interactions with other CRC genes (Figure 6).

KEGG pathways enriched with CRC genes.

“Hub” genes of prioritized microRNA targets involved in CRC.
CTNNB1 is a key downstream component of the canonical Wnt signaling pathway. 49 It binds with AXIN1, AXIN2, APC, CSNK1A1, and GSK3B to promote phosphorylation and ubiquitination of CTNNB1 through BTRC and its degradation by the proteasome in the absence of Wnt. 50 However, it is not ubiquitinated in the presence of Wnt and accumulates in the nucleus and acts as a coactivator for transcription factors of the T-cell factor/lymphoid enhancer-binding factor (TCF/LEF) family which activates Wnt response genes. 51 Dysregulation of the Wnt signaling pathway promotes cell survival, inhibits cell death and differentiation, and activates the development of gastrointestinal polyps and carcinoma. 52 APC gene is a negative regulator of CTNNB1, and up to 80% of CRCs have mutations in the APC gene resulting in a truncated protein. 53 The mutation of this gene occurs in various cancer types. 54 These mutations alter the spatial characteristics of the protein, leading to nuclear transcriptional network reprogramming. The result of the change includes increased cell proliferation, enhanced immunosuppression, and disruption of metabolic regulation. 54 Reports suggested that mutations in APC can also correlate with high expression levels of CTNNB1, whereas wild-type APC expression can reduce CTNNB1 levels in CRC cells.55,56 Irrespective of the expression level of this gene, it is regarded as an important indicator of malignancy.57,58
The EGFR has been suggested to play a vital role in promoting cell growth. 59 The protein tyrosine kinase is the most frequently mutated domain with L861Q as the most common alteration. The major type of mutation found in this gene is missense. The EGFR L861Q mutation is known to be oncogenic and the biological effect is loss of function. 60 Existing literature reported that overexpression of EGFR is estimated to be 60%–80% of the tumor and is associated with poor prognosis in CRC. 61 The EGFR is a transmembrane glycoprotein and receptor tyrosine kinase that is encoded by the c-erbB-1 proto-oncogene. 62 This gene is overexpressed in many types of cancers, specifically CRC. 61 EGFR is estimated to be overexpressed in 60%–80% of tumors and is associated with a poor prognosis. 63 The expression and prognostic analysis of this gene showed that it was downregulated in CRC and the prognostic value is significant. Spano et al. 64 revealed that EGFR remains a controversial prognostic factor; the expression may play an important role in a decision to initiate treatment. Another study also confirmed that the expression of this gene is implicated in CRC pathogenesis. 65 The “hub” genes of these candidate microRNAs, therefore, may be a potential target for CRC treatment.
Using the cBioPortal, the genomic exploration of microRNA target genes in CRC clinical data was queried against all the total cancer samples available and total CRC data. The 82 enriched genes were prioritized on the bases of genetic alteration/frequency of alteration in CRC to 17 genes (above 2%; Figure 7).

Cross-cancer alteration summary for prioritized microRNA target genes.
GO enrichment analysis of the prioritized target genes revealed the associations of the microRNA target genes in the three components of GO (CC, MF, and BP). Plasma membrane region is the most significant GO term for the microRNA target genes. The plasma membrane participates in the regulation of DNA methylation. 66 Most of the genes linked to the cell surface. The microRNAs targeting these genes may then be further proven to act as a good potential diagnostic biomarker. Also, five out of the seven genes (APC, GNAS, IGF1R, CASP8, and EGRF) are also located in the plasma membrane protein complex (integral protein). The microRNAs regulating these genes may also serve as therapeutic biomarkers for CRC. Other genes are found either in the receptor complex or the membrane raft. In the MF GO term, the genes were predominately associated with protein binding and receptor signaling binding. The microRNA target genes were also predominantly involved in a number of biological functions pertaining to regulations of MFs, signal transduction, cellular process, metabolic process, apoptotic process, cell differentiation, homeostatic process, cellular response, mitogen-activated protein (MAP) kinase activity, BP, peptidyl-tyrosine autophosphorylation, and catalytic activities. Wnt/CTNNB1 activation and malignant transformation of bowel diseases are the two major causes of CRC. Both Wnt/CTNNB167,68 and inflammatory signaling pathway activation 69 can lead to intestinal epithelial disruption of homeostasis, for instance, if proliferation is increased, differentiation and apoptosis are decreased, in the intestinal tract 70 (Figures 8–10).
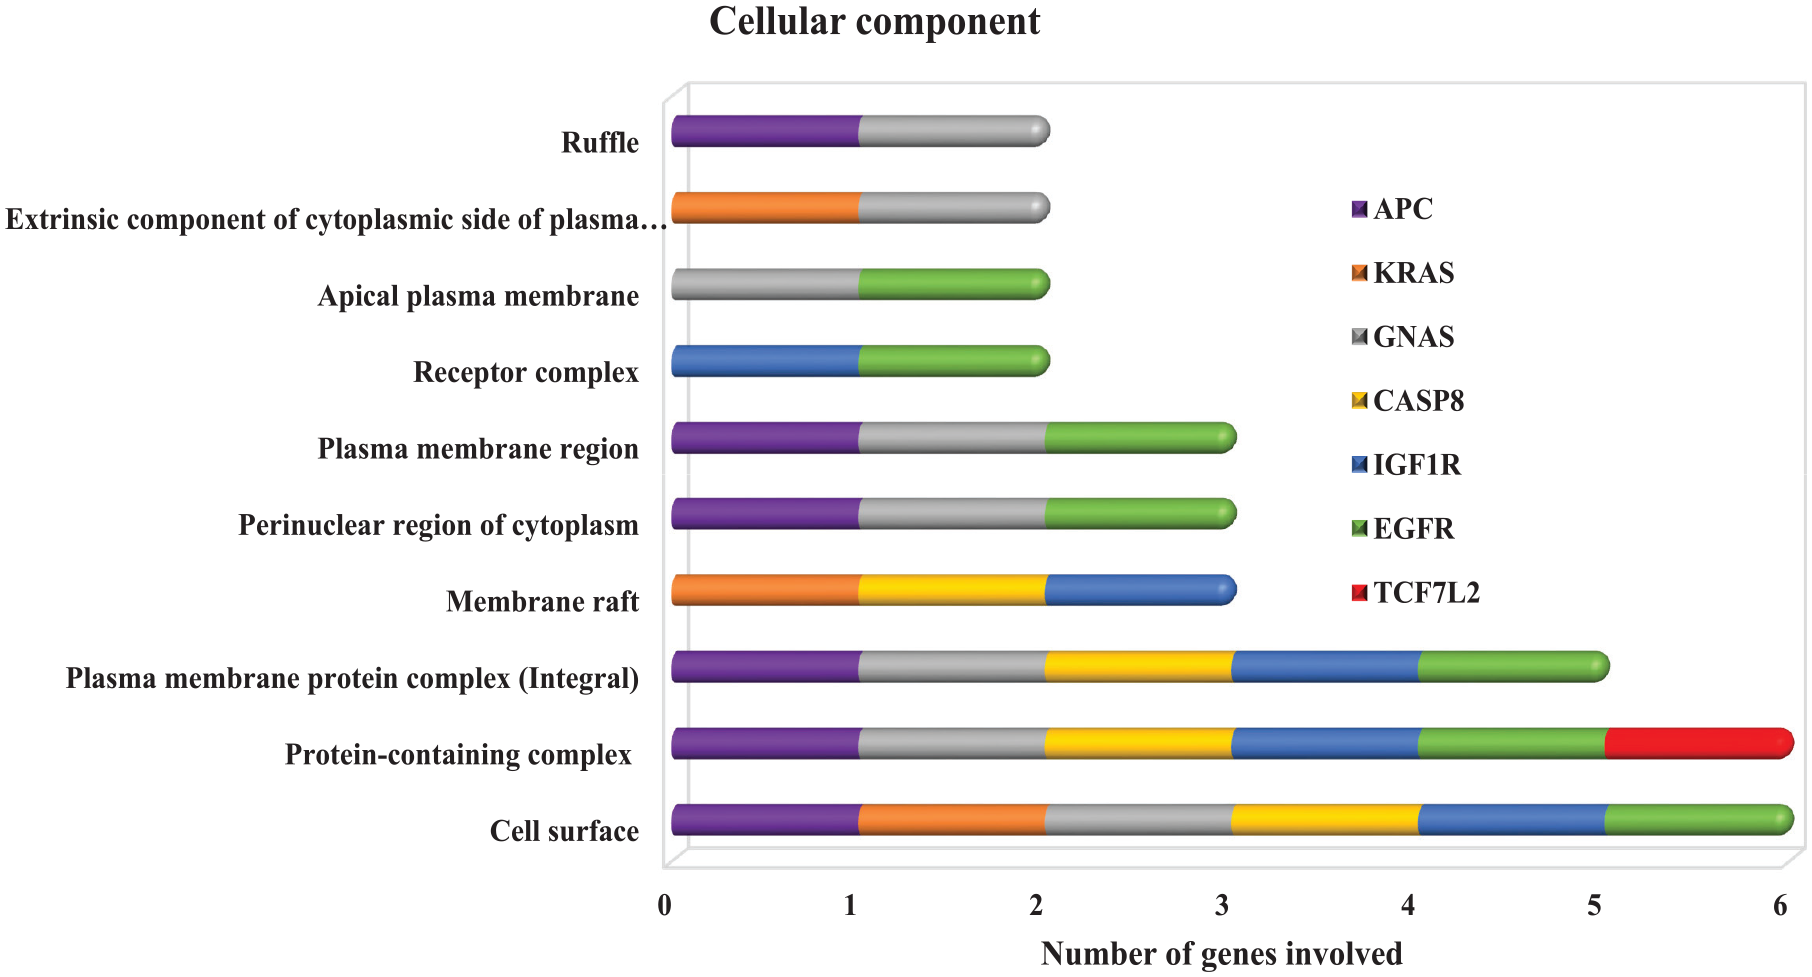
The result of the GO of microRNA target genes.
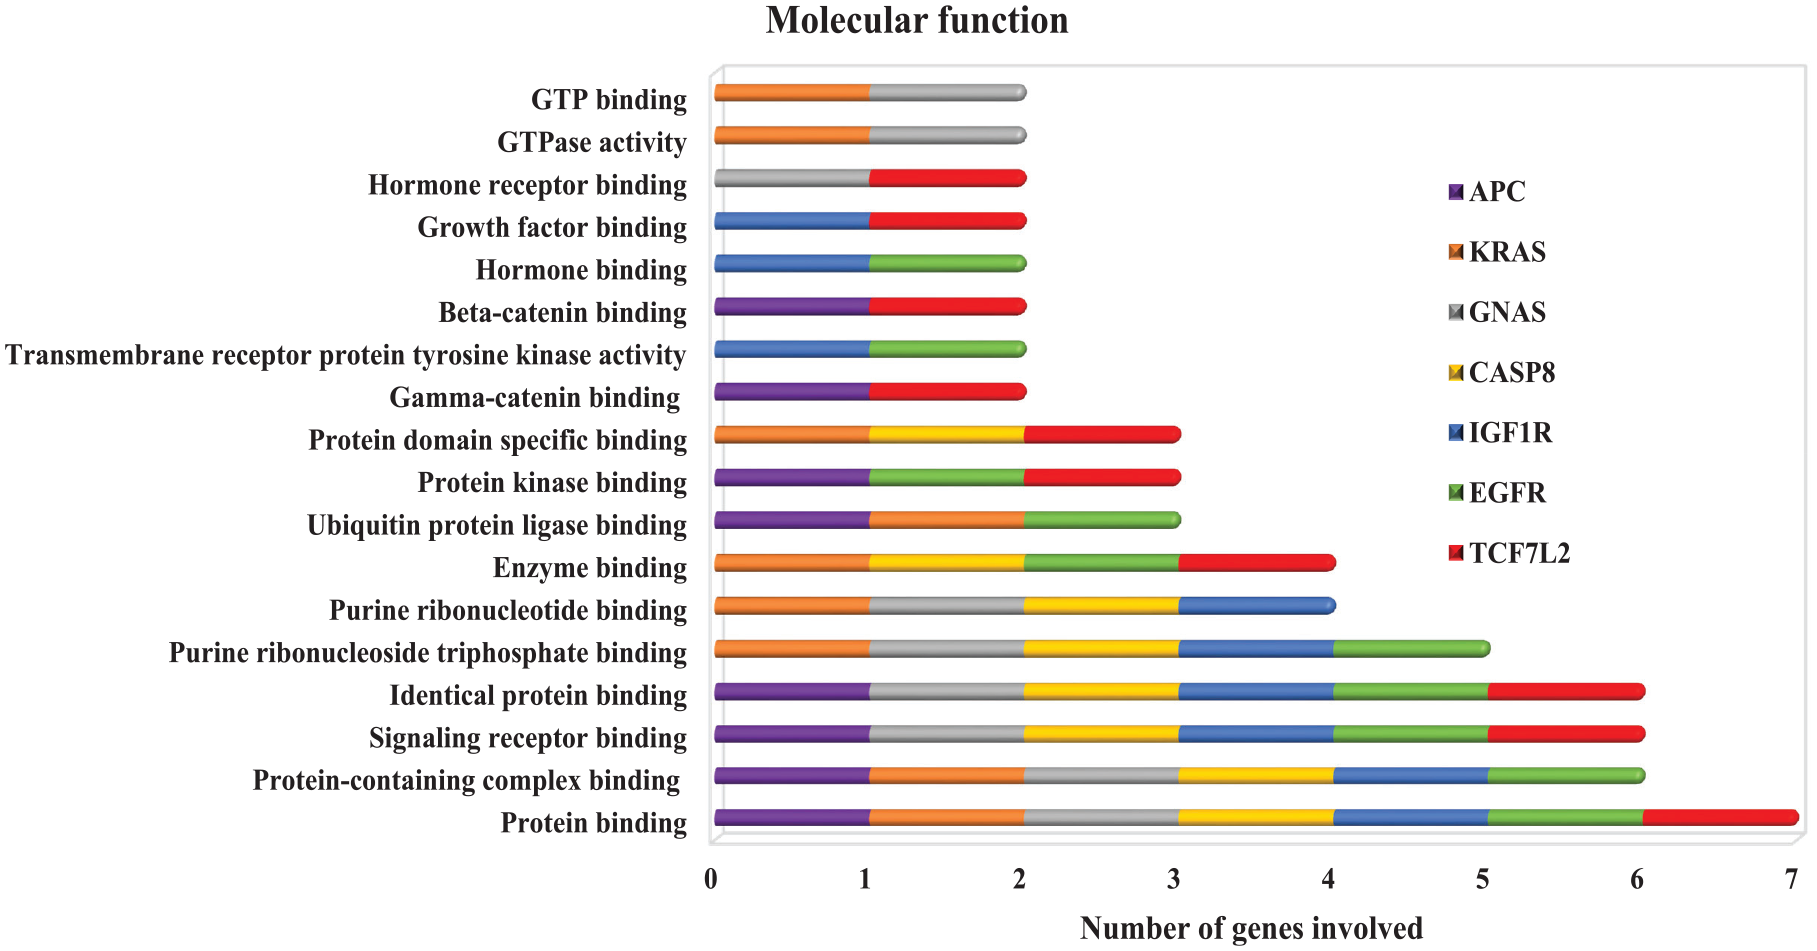
The result of the GO of microRNA target genes.

The result of the GO of microRNA target genes.
Prognostic and expression analysis of the candidate microRNA and their targets
Has-mir-145 is one of the microRNAs extensively studied in CRC as well as in other cancer types.71–74 For this reason, it was used as a positive control for both colon and rectum adenocarcinoma in PROGmiRV2 to confirm the standard of the tool for prognostic analysis. The graphical output in the Kaplan–Meier plot for its expression in both colon and rectum was given in Figure 11. These results confirmed that the candidate microRNAs do not have any link with CRC and as such, they are potential novel microRNAs.
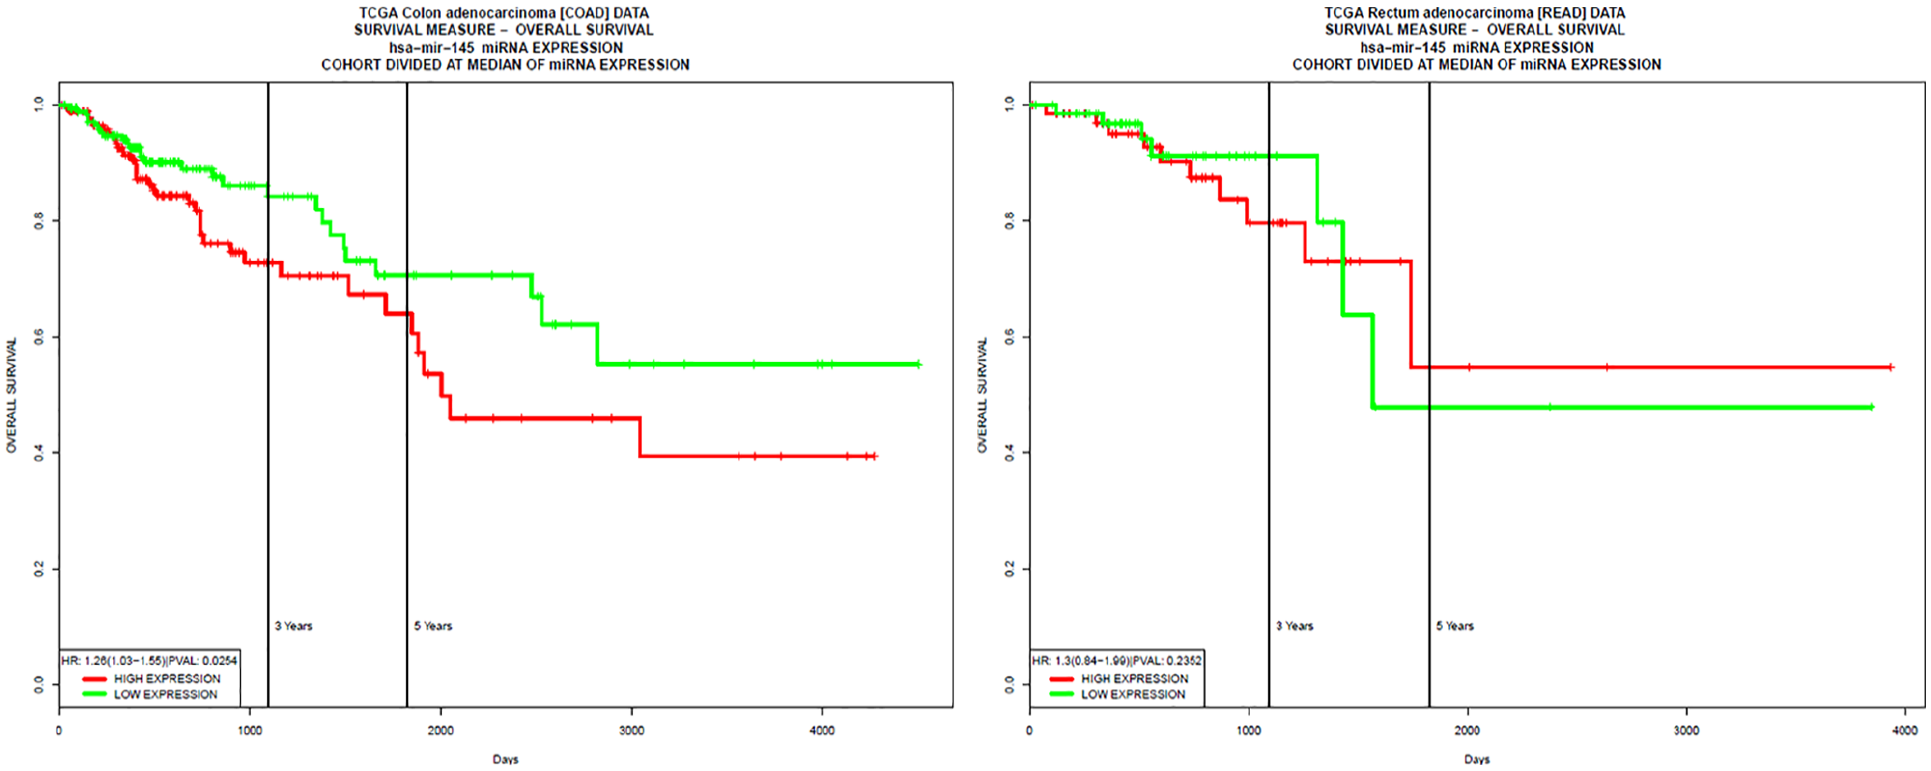
Kaplan–Meier plot for positive control microRNA generated by the PROGmiRV2 database for colon and rectum adenocarcinoma.
Validation of genes as biomarkers to predict the clinical outcome is a major issue for prognosis in cancer study. The availability of large cancer datasets publicly as an important information source for in silico validation is a step further for solving the aforementioned issue. Although evaluating genes prognostic performance with available datasets for biologists and physicians is a difficult task and tedious for statistics and bioinformatics experts, it is important to determine the correlations and validations of survival biomarkers for clinical outcomes. For this reason, the SurvExpress biomarker database was employed to predict the clinical result and prognostic value of CRC metastasis genes.
The gene expression by risk group (Figure 12) showed a box plot of gene expression level against the microRNA prioritized genes. It was assessed whether gene expression levels of the prioritized genes differ between the high-risk (red) and low-risk (green) groups as well as the level of significance of expression at p < 0.05 utilizing the t-test. The results indicated that genes ERBB4, CASP8, BRCA1, GNAS, EGFR, INSR, NRAS, KRAS, CTNNB1, TCF7 L2, INHBA, TGFBR2, IGF1R, and IRS2 showed a distinct difference between the low-risk and the high-risk groups. The difference in expression between risks groups for these genes can be useful for prognostic and predictive values for CRC. Therefore, this gene panel can be used to determine a patient’s survival if the survival is affected by the expression of these genes.

Result outputs of the SurvExpress database.
This section of the study assessed whether the expression of the prioritized list of the microRNA target gene predicted clinical outcome. Using the publicly available SurvExpress biomarker tool 33 that stratifies CRC patients into low-risk or high-risk groups based on differential gene expression, Kaplan–Meier survival curves were generated (Figure 13). Expression of the prioritized microRNA target genes significantly reduced recurrence-free survival in patients with CRC (Figure 12). This shows that the expression of the panel of genes is a prognostic indicator for survival in CRC patients.

The expression of prioritized microRNA target genes predicts recurrence-free survival in patients with CRC.
PrognoScan depicted the statistical significance of the expression of 7 out of 17 genes which were positively associated with CRC showing their contributions as well as prognosis to CRC (Table 2 and Figure 12). On a whole, prognostic and expression analysis of the candidate microRNAs confirmed that there is no link to CRC and could serve as potential candidate microRNAs while the prognostic and expression analysis of their target genes concluded that seven microRNAs, namely APC, KRAS, TCF7 L2, EGFR, IGF1R, CASP8, and GNAS, at p < 0.05 are statistically significant and showed good prognostic values with clear implications in CRC. The expression of these genes either collectively or individually discriminates between high-risk and low-risk CRC groups making the microRNAs potential biomarker in CRC diagnosis.
Prognostic analysis using PrognoScan (list of genes whose expression is associated with overall survival of patients with CRC).
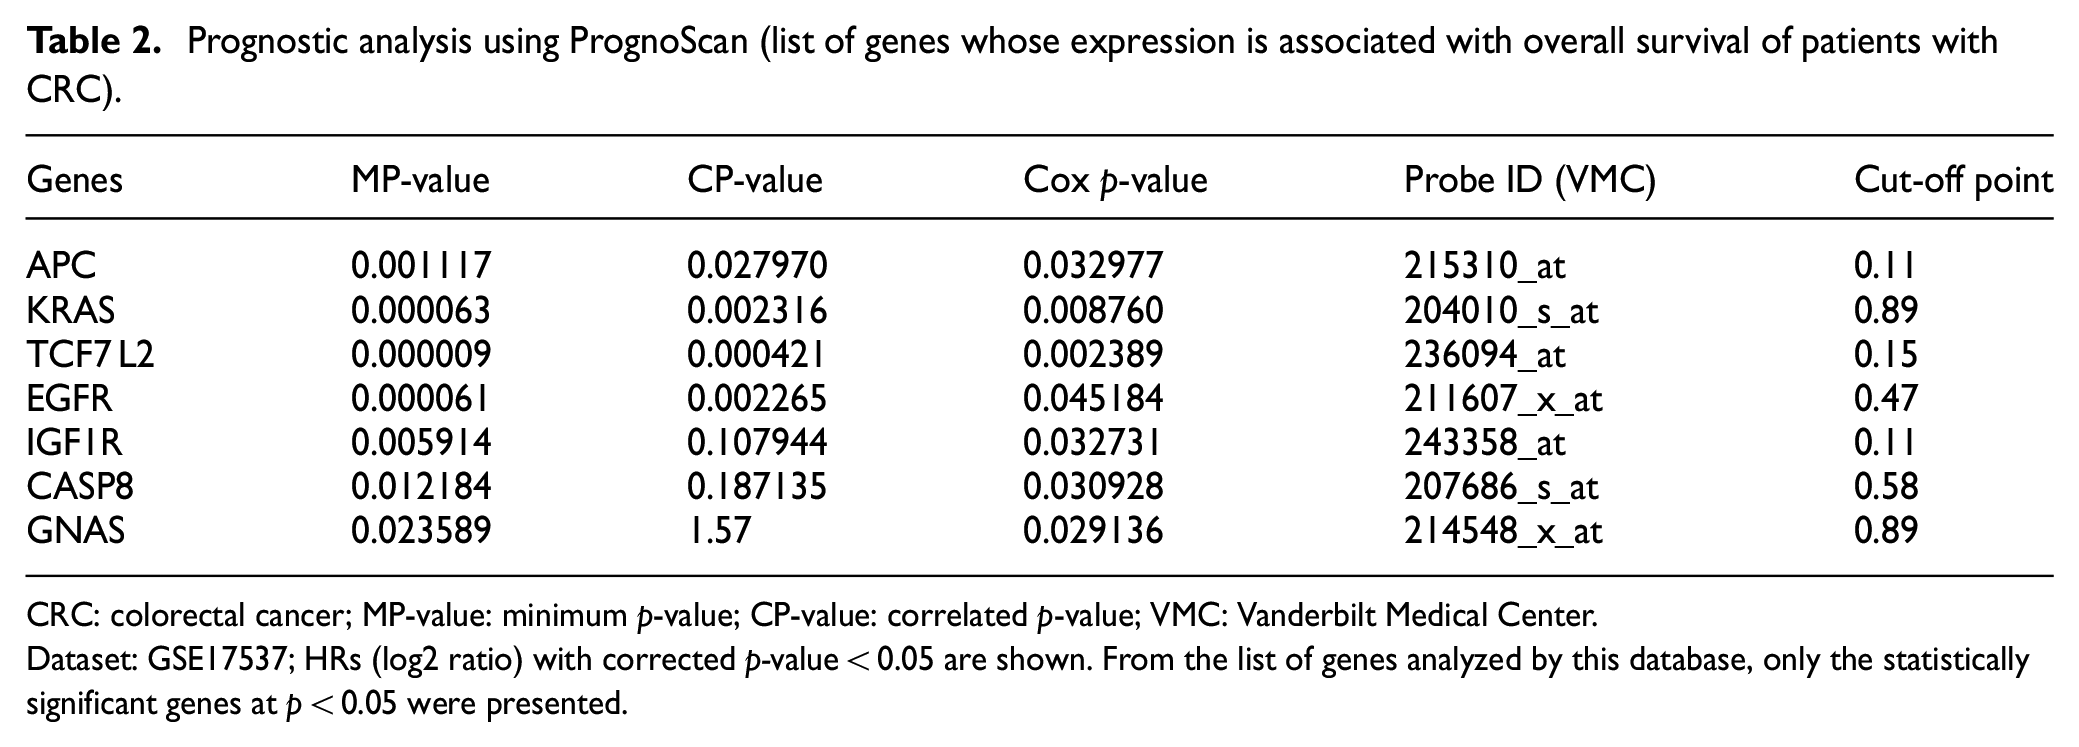
CRC: colorectal cancer; MP-value: minimum p-value; CP-value: correlated p-value; VMC: Vanderbilt Medical Center.
Dataset: GSE17537; HRs (log2 ratio) with corrected p-value < 0.05 are shown. From the list of genes analyzed by this database, only the statistically significant genes at p < 0.05 were presented.
Conclusion
Using in silico approach, this study identified five candidate microRNAs alongside seven significant target genes. The patterns of expression obtained in their target genes relative to their microRNAs and their prognostic values could be inferred that patients with alterations in the microRNA prioritized target genes have significantly better overall survival than patients without these alterations. These could be further exploited and could potentially serve as a resource for explicitly selecting targets for diagnosis, drug development, and management of CRC. Although validation studies are ongoing to conclude the biological fitness of these findings, the study also indicated that the identified microRNAs and hub genes (CTNNB1 and EGFR) stimulate a better understanding of the molecular mechanisms underlying the development of CRC and might be used as molecular targets and potential diagnostic biomarkers for the treatment of the cancer subtype.
Footnotes
Acknowledgements
The authors would like to thank the Plant Omics Laboratory and the Bioinformatics Research Group of the University of the Western Cape for their usual support and also, Dr. Taiwo Akinsoji (MBBS, MPH) of University of Illinois at Springfield for co-proofreading the final manuscript.
Author contributions
All authors have made significant contributions to the submission of the article. A.O.F. conceived the concept and the design of the manuscript; A.K. and A.P. provided the necessary software required to carry out the analysis. The analysis and data interpretations were done by both A.O.F. and A.P., while A.K. drafted the rough draft and also substantively revised the manuscript. Finally, all authors read and approved the submitted version of the manuscript for publication. Also, they agreed to be personally accountable for their personal contributions and ensured that questions related to the accuracy or integrity of any part of the work, even ones in which the author was not personally involved, are appropriately investigated, resolved, and the resolution documented in the literature.
Data availability
The datasets and the clinical data were obtained from the online databases as described above in the methods, and their websites are as follows: http://www.mirbase.org/ for reference dataset, microRNAs associated with CRC at cancer were http://www.picb.ac.cn/dbDEMC/, http://www.mir2disease.org/, http://www.cuilab.cn/hmdd, and http://mircancer.ecu.edu/. The clinical data exploited were derived from cBioPortal database accessed at ![]() .
.
Declaration of conflicting interests
The author(s) declared no potential conflicts of interest with respect to the research, authorship, and/or publication of this article.
Funding
The author(s) received no financial support for the research, authorship, and/or publication of this article.