
Abstract
MicroRNAs are non-coding short RNAs that target the 3′ untranslated region of messenger RNAs (mRNAs) and lead to their degradation or to translational repression. Several microRNAs have been designated as oncomirs, owing to their regulating tumor suppressor genes. Interestingly, a few of them have been found to target multiple genes whose simultaneous suppression contributes to the development of a tumoral phenotype. Here, we have showed that miR-26a is overexpressed in colorectal cancer data obtained from TCGA Research Network and in human colon cancer pathological specimens; moreover, an orthotopic in vivo model of colon cancer showed overexpression of miR-26a, while Rb1 expression inversely correlated to miR-26a in TCGA Research Network data, pathological samples, and the in vivo model. Then, by means of luciferase assay, we demonstrated that miR-26a targets the 3′ untranslated region of Rb1 mRNA directly. This is, to our knowledge, the first report of miR-26a targeting Rb1 in colon cancer. The results of this study suggested that miR-26a could serve as a progression biomarker in colorectal cancer. Further validation studies are still needed to confirm our findings.
Introduction
MicroRNAs (miRNAs) are non-coding short RNAs that target the 3′ untranslated region (3′ UTR) of mRNAs and lead to their degradation or to translational repression; 1 despite their relatively recent discovery, they are widely recognized as important post-transcriptional regulators. They exert their functions by binding to the 3′ UTR of their target mRNA through complete or partial base complementarity and thus are rather promiscuous and capable of pleiotropic effects (extensively reviewed in Liu et al. 2 and Hayes et al. 3 ). Several miRNAs have been designated as oncomirs, owing to their regulating tumor suppressor genes. Interestingly, a few of them have been found to target multiple genes whose simultaneous suppression contributes to the development of a tumoral phenotype. 4 For instance, miR-182-5p targets BRCA1, RGS17, and FOXO3, three genes involved in DNA repair, 5 and drives metastasis of primary sarcomas by targeting genes such as Rsu1, Mtss1, Pai1, and Timp1, implicated in cytoskeleton remodelation and cell migration. 6
Deep understanding of these genetic regulation networks is remarkably important in complex diseases such as colorectal cancer (CRC)—the world’s fourth most deadly cancer, which takes almost 700,000 lives every year 7 —so as to gain insight into their multifactorial origin, development, and response to treatment. Among several miRNAs upregulated in CRC, 8 miR-26a is particularly interesting. Besides established roles as a gene expression modulator in smooth cell function, 9 pancreatic cell differentiation, 10 and even miRNA biogenesis, 11 published evidence show that miR-26 plays a significant role in cancer development. However significant, the role that miR-26a plays in carcinogenesis seems highly context-dependent based on the current evidence: it has been demonstrated that its overexpression promotes cholangiocarcinoma by targeting GSK3A 12 and glioma by targeting PTEN; 13 on the other hand, it has been found to be underexpressed in miRNA profiles of renal cell carcinoma 14 and liver cancer 15 and to drive esophageal adenocarcinoma development by targeting Rb1. 16 These data show that the particular function of miR-26a in CRC development cannot be inferred, but must be analyzed directly. Currently, it is known that it targets PDHX and modifies glucose metabolism, 17 but whether it actually targets known CRC-related genes such as PTEN, GSK3A, and Rb1 in CRC development remains to be explored; in this article, we do so with the miR-26a Rb1 interaction.
The retinoblastoma (Rb1) protein is one of the first described tumor supressors, 18 and its loss of function is considered one of the hallmarks of cancer. 19 Although Rb1 has a well-described role in carcinogenesis, 20 its role in CRC is less clear. Its expression is heterogeneous in CRC samples,21,22 so it cannot be considered a bona fide molecular marker for this neoplasm, 23 but recent works have demonstrated that the lack or inactivation of Rb1 can drive colorectal tumor development.24,25 So we find it reasonable to infer that Rb1 downregulation is not only a consequence of overall gene dysregulation in CRC, but also an important element in its development. Such downregulation is, evidently, part of a tightly controlled network in which miRNAs may play an important role due to their negative regulator nature.
We have successfully applied the model of chronic inflammation–associated CRC 26 to analyze molecular events involved in colon carcinogenesis. Thus, BALB/c mice were induced to develop—through carcinogen azoxymethane (AOM) followed by three cycles of dextran sulfate sodium—an orthotopic colon tumor. Here, we have showed that miR-26a is overexpressed in both tumor murine samples and human pathological specimens; meanwhile, Rb1 expression inversely correlated to miR-26a. Then, we demonstrated that miR-26a targets the 3′ UTR of Rb1 mRNA directly. This is, to our knowledge, the first report of miR-26a targeting Rb1 in colon cancer.
Material and methods
Patient samples
Twenty CRC paraffin-embedded tissue samples staged locally advanced and, for comparison with neoplasia-free tissues, 10 Crohn’s disease paraffin-embedded tissue samples were obtained from INCAN (Instituto Nacional de Cancerología—National Cancer Institute, Mexico) pathology registry.
CRC mouse model
Twelve female BALB/c mice (Harlan Laboratories) aged 6 weeks were used in this study. They were maintained at Facultad de Estudios Superiores Iztacala Animal Facility according to the institutional animal care guidelines. All animals were housed in plastic cages (3 mice/cage) with drinking water and pelleted basal diet ad libitum under controlled humidity (50 ± 10%), light (12/12 h light/dark cycles), and temperature (23 ± 2°C). They were quarantined for the first 7 days and then randomized by body weight into an experimental (n = 6) and one control (n = 3) group. Both groups were administered a single intraperitoneal injection (12.5 mg/kg body weight) of a colonic carcinogen AOM from Sigma-Aldrich. One week after the injection, animals were subjected to three Dextran Sulfate Sodium Salt (DSS) cycles for colitis induction. Each DSS cycle consisted of a week-long administration of reagent-grade DSS with a molecular weight of 36,000–50,000 (MP Biomedicals), dissolved in the drinking water at a concentration of 2% (w/v), followed by 2 weeks without treatment.
Three mice were euthanized after each DSS dose so as to monitor mRNA and protein expression throughout cancer development. After euthanasia, large bowels were flushed with saline and excised. Inflammation-related cancer development was confirmed by histological analysis as previously reported. 26
Cell culture and transfection
CRC-derived HCT116 cells (ATCC CCL-247) were cultured in Roswell Park Memorial Institute medium (RPMI medium) supplemented with 10% (v/v) fetal bovine serum and maintained at 37°C with 5% CO2. CRC-derived SW620 (ATCC CCL-227) and normal colon-derived CRL1790 (ATCC CRL1790) cells were cultured in Dulbecco’s Modified Eagle Medium/Nutrient Mixture F-12 (DMEM/F12) medium supplemented with 10% (v/v) fetal bovine serum and maintained at 37°C with 5% CO2.
All plasmids used for this study were transfected using Lipofectamine 2000 transfection agent (Invitrogen), following the manufacturer’s protocol. MicroRNA mimics and inhibitors were transfected using the siPORT NeoFX transfection agent (Life Technologies) following the manufacturer’s protocol. For functional assays, we transfected an miR-26a mimic or an miR-26a anti-miRNA, as well as an unrelated miRNA (miR-1) or a scrambled 20-nt sequence as control (all of them purchased from Ambion).
RNA expression analysis
MiRNAs were isolated from paraffin-embedded tissue samples using the miRNeasy FFPE kit (Qiagen) following the manufacturer’s recommendations. Large bowel parts of each experimental group mice were homogenized by triplicate in a Bullet Blender (Next Advance) following the manufacturer’s protocol for intestinal tissue. Total RNA was isolated from the homogenized samples or from cultured cells (CRL1790, HCT116, or SW620 grown to approximately 80%–85% confluence), using the TRIzol reagent (Invitrogen) following the manufacturer’s protocol.
Quantitative reverse transcription polymerase chain reaction (RT-PCR) was performed in the murine model samples using a Roche Light Cycler 2.0. MiR-26a and its putative target genes were detected in tissue samples using the TaqMan Universal Master Mix II kit and the mir-26a TaqMan probe (Applied Biosystems) or the Titan One RT-PCR kit (Roche) supplemented with SYBR Green and the corresponding primers (primer information available upon request). Amplification conditions were as follows: for miR-26a, complementary DNA (cDNA) was generated from 100 ng total RNA with the TaqMan MicroRNA Reverse Transcription Kit (Applied Biosystems) in a 15 µL volume; quantitative polymerase chain reaction (qPCR) was performed using a microliter, denatured for 10 min at 95°C, followed by 40 cycles of 95°C for 15 s, 68°C for 60 s.For mRNA detection, we used the Titan One RT-PCR kit (Roche) supplemented with SYBR Green. cDNA was synthesized at 50°C for 30 min, immediately followed by denaturation at 94°C for 2 min, 40 cycles of 94°C for 10 s, primer-dependent annealing temperature for 30 s and 68°C for 45 s, and a final extension at 68°C for 7 min.
MiR-26a or the Rb1 messenger was detected in cultured cells and paraffin-embedded tissue samples using the Bio-Rad CFX 96 Touch and the mir-26a TaqMan probe (Applied Biosystems) or the SYBR Select Master Mix for CFX (Applied Biosystems). Amplification conditions for miR-26a were as mentioned above. For mRNA detection, cDNA was synthesized from 2 µg total RNA using the High-Capacity cDNA Reverse Transcription Kit (Roche); one-twentieth of this reaction was used for qPCR. Amplification conditions were 2 min at 95°C for initial denaturation, followed by 40 cycles of 95°C for 15 s, primer-dependent annealing temperature for 15 s, and 72°C for 60 s.
Relative expression data were calculated through the ΔΔCt method (Applied Biosystems), normalized relative to U6 snRNA (small nuclear RNA) or glyceraldehyde 3-phosphate dehydrogenase (GAPDH) mRNA accordingly.
Protein expression analysis
Protein extracts from large bowel parts of each experimental mouse group of cultured cells were obtained by homogenization in radioimmunoprecipitation assay buffer (RIPA buffer; Santa Cruz Biotechnology); a Bullet Blender (Next Advance) and stainless steel beads were used for bowel tissues. Protein extract was cleared by centrifugation at 12,000 rpm for 20 min.
For immunodetection, 50 µg total protein from tumor tissue or cultured cells was mixed with Laemmli sample buffer, boiled, separated in 12% or 15% sodium dodecyl sulfate polyacrylamide gel electrophoresis (SDS-PAGE), and transferred onto a Hybond-P polyvinylidene difluoride (PVDF) membrane (Amersham-GE Healthcare). Membranes were probed overnight using a 1:500 (v/v) dilution of anti-Rb1 (Sc-50); for detection, 1:2500 (v/v) dilutions of horseradish peroxidase (HRP)-conjugated anti-rabbit or anti-mouse antibodies (Santa Cruz Biotechnology) were used. Finally, using the SuperSignal West Femto chemiluminescent substrate (Thermo Scientific), the membranes were scanned in the C-Digit blot scanner (Li-Cor), and the images were analyzed for densitometry in the associated ImageStudio software (Li-Cor). Membranes were stripped and re-probed for detection of actin (anti-actin, Sc-47778) as a loading control. A representative image from three independent experiments is shown.
Luciferase reporter assays
Reporter plasmids were constructed by ligation of synthetic oligonucleotide duplexes (IDT) containing putative miR-26a target regions in the Rb1 3′ UTR, 5′-CTA GTT AAG TAC CCA TGT AGT ACT TGA AA-3′ and 5′-AGC TTT TCA AGT ACT ACA TGG GTA CTT AA-3′, obtained from microRNA.org, 27 into the pMIR-REPORT plasmid (Ambion). This construct was co-transfected with miR-26a mirVana miRNA mimic (Applied Biosystems) and the pMIR-REPORT β-gal Control Plasmid (Ambion) into HCT116 cells. Luciferase activity was analyzed using the Dual-Luciferase Reporter Assay System (Promega) 48 h after transfection in a GloMax 96 Microplate Luminometer (Promega). Luciferase activity was normalized to β-gal activity for each transfected well; each experiment was performed in triplicate.
Tissue expression meta-analysis
Antibody-based proteomic data of 3 normal colon tissue and 11 CRC samples were obtained from The Human Protein Atlas. 28 Antibody staining intensity was compared between healthy and cancer tissues from the Rb1 entry.
MiR-26a1, MiR-26a2, and Rb1 expression values from 42 normal colon samples and 76, 305, and 46 colorectal tumors of stages I, II-III, and IV, respectively, were downloaded from TCGA Research Network RNAseq V2 (cancergenome.nih.gov; 29) and graphed as normalized total counts.
Statistical analysis
All values are expressed as the mean ± standard error of the mean (SEM). Data were analyzed in the Prism 5.0 (GraphPad) software using a one-way analysis of variance (ANOVA) followed by Tukey’s multiple comparison test.
Results
MiR-26a overexpression in tissue samples
We assessed miR-26a expression in CRC-derived paraffin-embedded tissue samples and found wide variation in expression levels; however, the maximum expression values were higher than those observed in the Crohn’s disease tissue samples that we analyzed as neoplasia-free controls due to the difficulties of obtaining healthy tissue biopsies (Figure 1(a)). Analysis of data sourced from the TCGA Research Network 29 yielded consistent results: miR-26a was overexpressed in CRC samples relative to normal colon tissues. Interestingly, we found that Rb1 was expressed at a higher level than miR-26a in CRC, as opposed to normal tissue, where its expression was higher (Figure 1(b)). Previous studies have already described miR-26a overexpression in Crohn’s disease, 30 so we reasoned that the overall tendency to a higher expression of miR-26 in CRC compared to normal tissue and the pre-malignant Crohn’s disease merited further investigation.
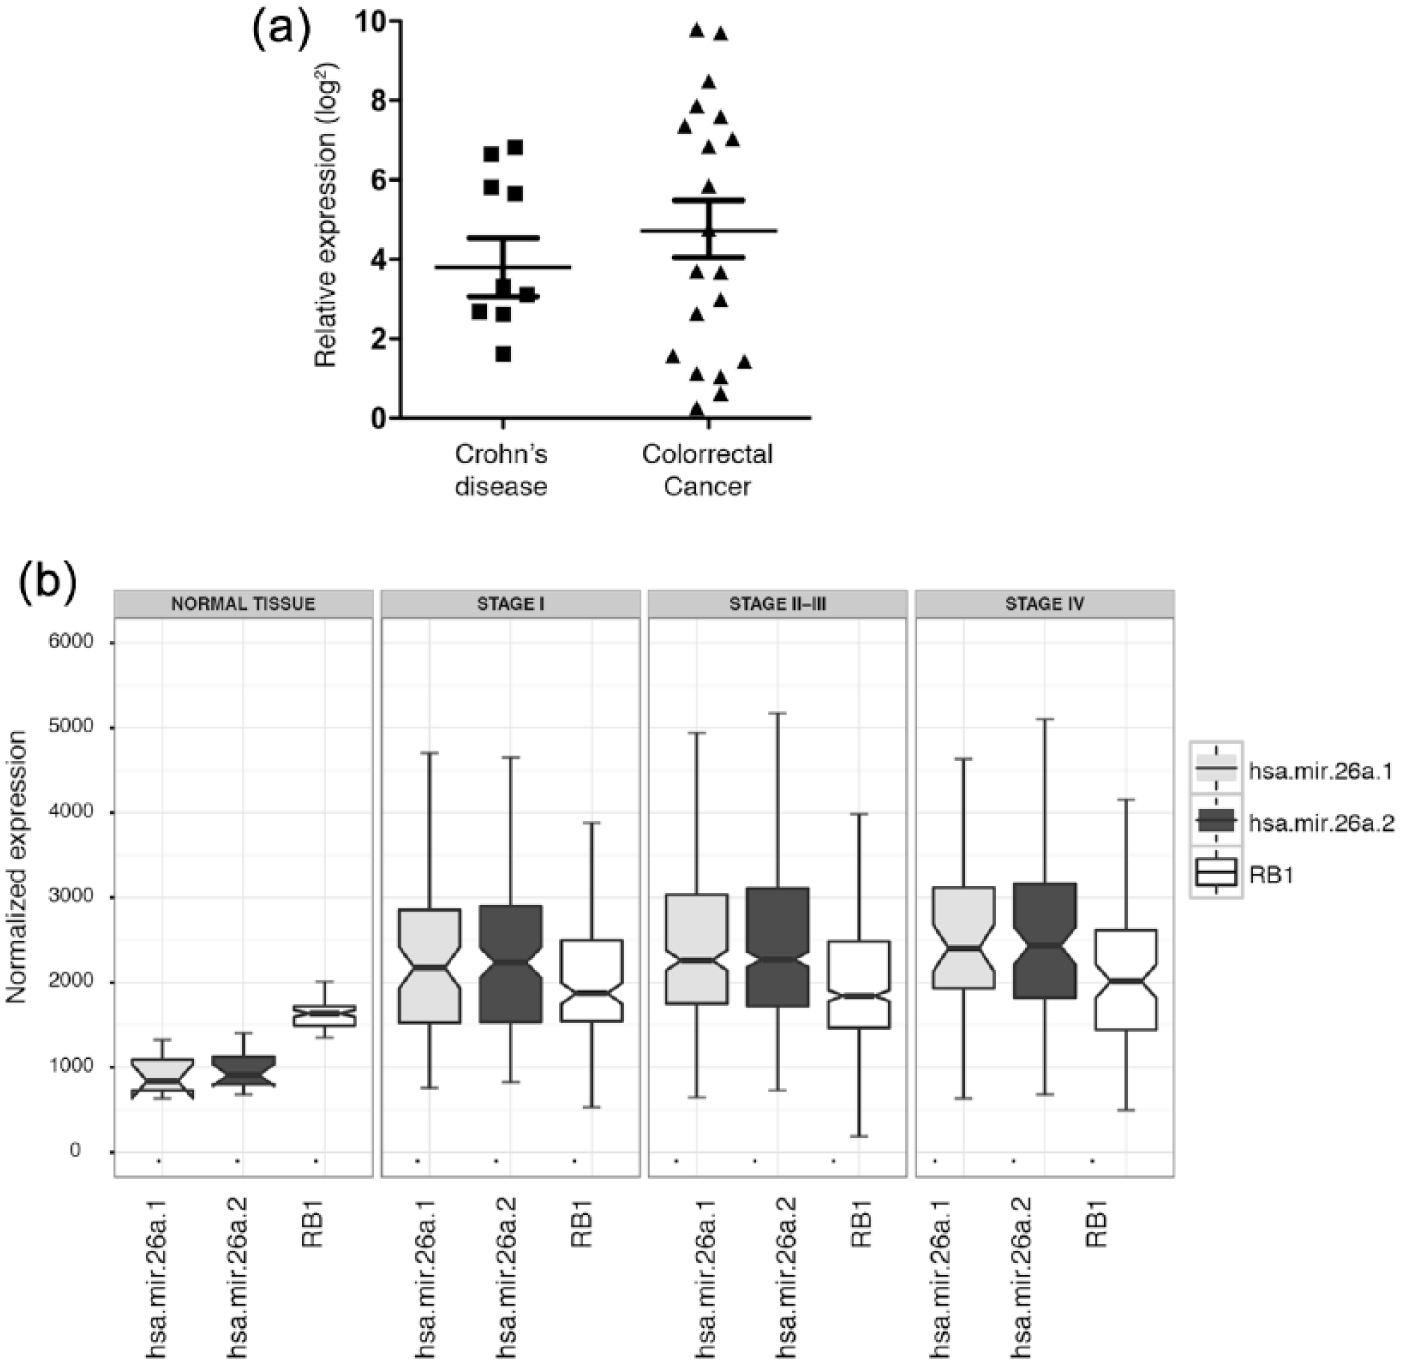
MiR-26a overexpression in CRC. (a) Detection of miR-26a in 20 CRC and 10 Crohn’s disease samples normalized by RNU6 expression; higher miR-26a levels were found in CRC samples. (b) Meta-analysis of miR-26a1, MiR-26a2, and Rb1 expression values from 42 normal colon samples and 76, 305, and 46 colorectal tumors of stages I, II–III, and IV; miR-26a expression was lower than that of Rb1 in normal tissue and higher in CRC samples.
AOM/DSS-induced CRC mouse model
We established a CRC model suitable for miR-26a expression studies. All experimental groups received a single dose of a colonic genotoxic carcinogen (AOM) and repeated exposure to a colitis inductor (DSS), which caused the tumor development. The mean weight of the animals decreased with each DSS administration (Figure 2(a)), and tumors were observed after the third one (DSS 3, Figure 2(b)). Histological analysis confirmed these results, revealing a generalized loss of epithelial morphology throughout the DSS cycles. After the second DSS administration, we observed 1 C chronic intestinal inflammation and slight crypt distortion with epithelial hyperplasia, and after the third DSS dose, formation of adenomas composed of tubular and villous structures lined by epithelium with high grade of dysplasia was observed (Figure 2(c)). In-depth analysis of these tumors was published recently in another article from our group. 26
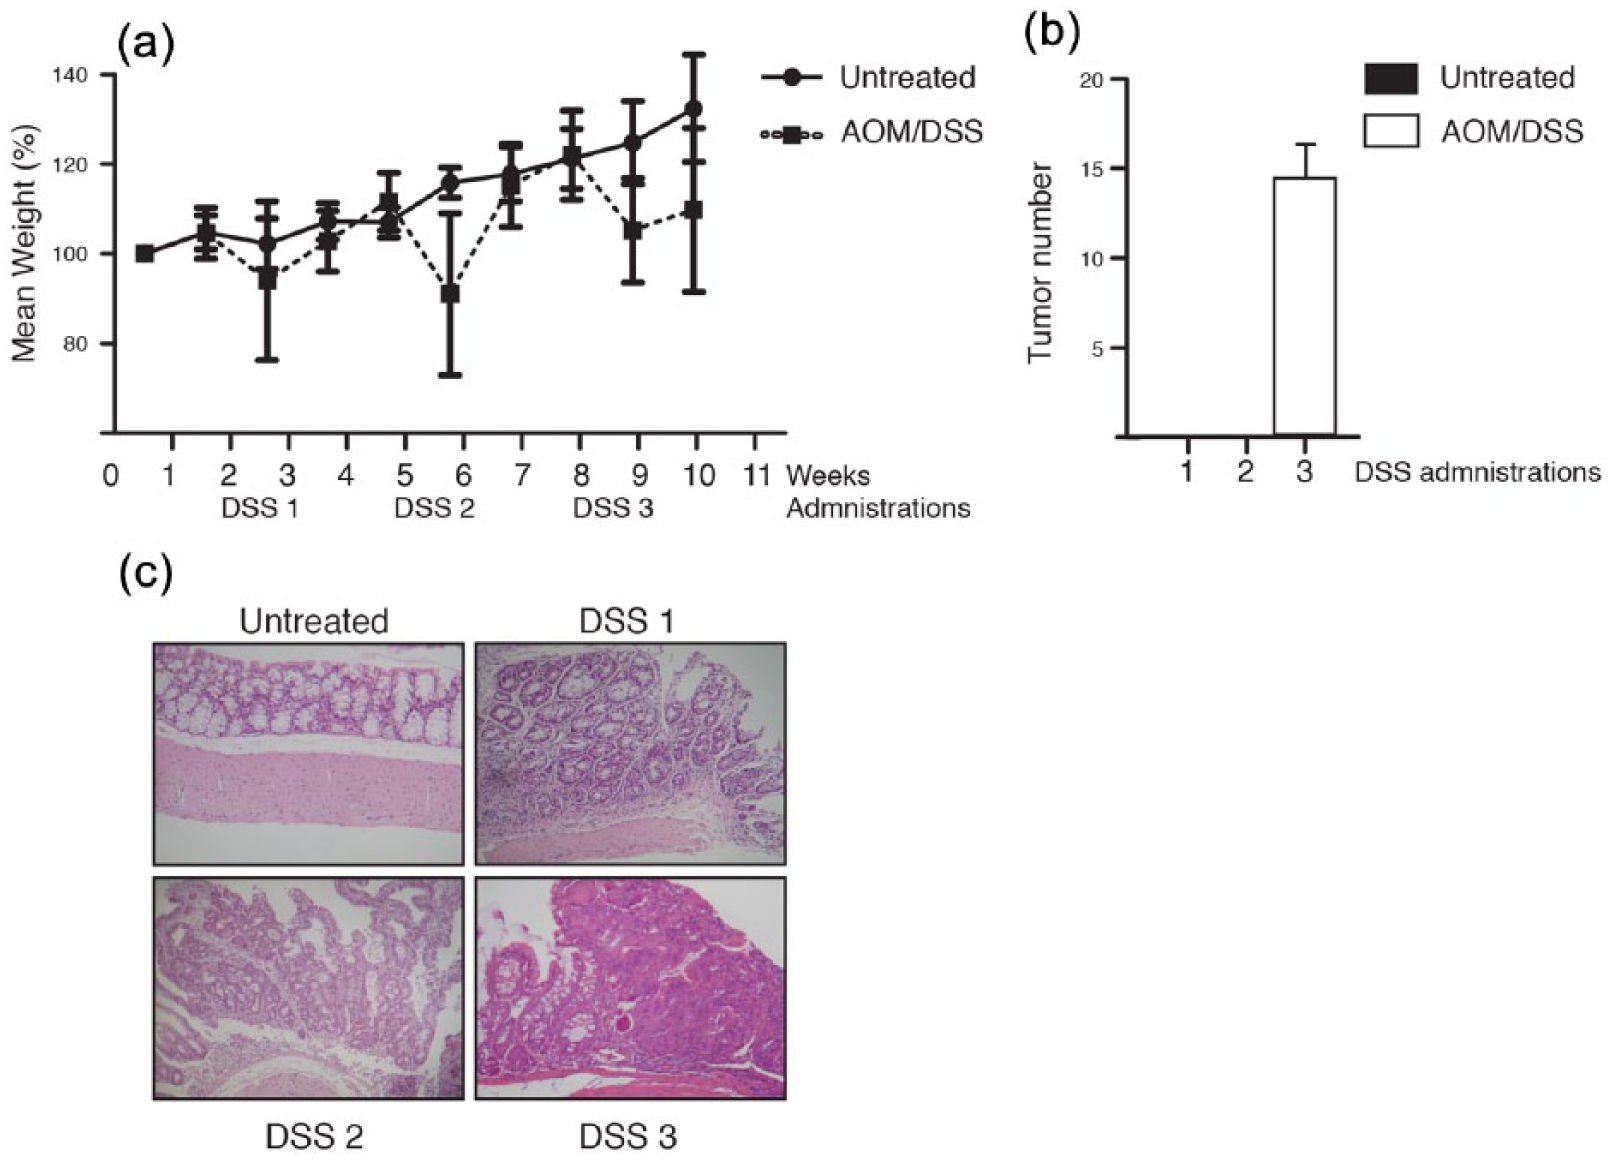
AOM/DSS-derived CRC mouse model. (a) Mean weight increment of the mice subject to the AOM/DSS treatment. (b) Average tumor number observed after each DSS administration. (c) Representative histological analysis of the large bowel during the progression of the model.
MiR-26a targets and Rb1 mRNA in an AOM/DSS-induced CRC mouse model
Expression analysis for miR-26a and the Rb1 messenger was performed after each DSS administration. The results are shown in Figure 2: miR-26a expression levels remained unchanged after the first DSS cycle, showed a modest increase after DSS 2, and increased around sixfold after DSS 3 (Figure 3(a)). This increase corresponded to previous findings about an augmented miR-26a expression in CRC. We next assessed Rb1 mRNA level at the same time points (Figure 3(b)). Rb1 mRNA showed a different pattern was slightly upregulated after DSS1, and its detection levels considerably diminished until the third DSS. These results showed consistency between the detection of miR-26a expression and its target Rb1 mRNA, as the latter diminished clearly as miR-26a presence increased. Conversely, the Rb1 protein showed a modest increase through DSS 1 and 2 and only a slight but reproducible decrease after DSS 3 (Figure 3(c) and (d)). We concluded that miR-26a targets the Rb1 mRNA causing its degradation in mouse CRC model. The discrepancy between the mRNAs and its protein product suggested further regulation of the Rb1 expression, likely a shift in translation efficiency.

MiR-26a targets the Rb1 mRNA in an AOM/DSS-derived CRC mouse model. (a) MiR-26a and (b) Rb1 mRNA expression after each DSS administration, relative to the expression in untreated mice. (c) Representative image and (d) average densitometric values of Rb1 immunodetection after each DSS administration; β-actin was detected as a loading control and was used to normalize densitometric data.
Mir-26a interacts directly with the Rb1 mRNA 3′ UTR
In order to confirm whether miR-26a exerted a direct regulation on the Rb1 messenger, we performed luciferase reporter assays in HCT116 cells transfected with an miR-26a mimic or the corresponding anti-miRNA. Figure 4(a) shows miR-26a presence in HCT116 cells transfected with the miR-26a mimic compared to its endogenous expression. Luciferase expression decreased significantly regardless of the full-length Rb1 3′ UTR (Figure 4(b)) or only the miR-26a interaction region (Figure 4(c)), confirming the predicted binding of miR-26a to the Rb1 mRNA 27 in contrast to the context of the complete untranslated region.

MiR-26a directly targets the Rb1 3′ UTR. (a) MiR-26a expression in HCT116 cells transfected with an miR-26a mimic normalized to endogenous miR-26a expression in untransfected cells. (b and c) Luciferase reporter assay using the full-length Rb1 3′ UTR and the mirR-26a interaction region, respectively. Each experiment was performed in triplicate, and the mean values were normalized to the empty vector (pMIR-REPORT) luciferase activity.
CRC samples show decreased Rb1 expression
The miR-26a/Rb1 regulation envisioned by our experiments would only be relevant if patient samples showed evidences of it, so we turned to The Human Protein Atlas 31 as a means to assess Rb1 expression in a broad range of normal and cancer tissues. We found high Rb1 expression levels in 100% of the healthy colon tissues present in The Human Protein Atlas database and, in contrast, in only 60% of cancer tissue. Rb1 was present in the remaining cancer samples at either medium levels or below the detection limit (Figure 5). This evidence supports our previous findings, as Rb1 expression is decreased in 40% of the cancer samples.

Rb1 underexpression in The Human Protein Atlas data set. (a) Antibody staining values found in healthy and cancer tissue samples. (b) Representative image of Rb1 immunohistochemical analysis showing reduced staining in cancer tissue.
Mir-26a regulates Rb1 in CRC-derived cell lines
We next set out to investigate whether the regulation exerted by miR-26a on the Rb1 messenger was reproducible in human cells. First, we surveyed the expression of Rb1 at the mRNA and protein levels in CRC-derived cell lines and the CRL1790 normal colon cell line. Consistent with expression data from normal and cancer tissues, Rb1 expression was significantly lower in both HCT116 and SW620 cells (Figure 6(a) and (b)). When transfected with an miR-26a mimic, Rb1 expression in HCT116 cells decreased dramatically. This decrease was not observed in cells transfected with miR-1 (an unrelated control) or with a scrambled miRNA sequence; however, Rb1 expression was rescued by transfection of anti-miR-26a (Figure 6(c) and (d)). These results indicated that miR-26a downregulates the Rb1 mRNA in the context of CRC.

MiR-26a regulation over Rb1 in CRC-derived cells. (a) MiR-26a expression in HCT116 and SW620 CRC-derived cell lines relative to the CRL1790 non-tumorigenic colonic cells. (b) Representative image and average densitometric values of Rb1immunodietection in CRC-derived cells; β-actin was detected as a loading control and was used to normalize densitometric data. (c) mRNA and (d) protein Rb1 expression in HCT116 cells transfected with an unrelated miRNA (miR-1), a scrambled 20-nt sequence, an miR-26a mimic or an miR-26a anti-miRNA normalized to untreated cells. Rb1 was downregulated only by the miR-26a mimic.
Discussion
Taken together, our results show that miR-26a is an important regulator in CRC; it targets the Rb1 messenger directly in a CRC mouse model and in CRC-derived cell lines, and decreases its protein levels.
MiR-26 is dysregulated in several cancer types: it plays tumor suppressor role in some of them such as prostate cancer and melanoma, although it is considered oncogenic in others such as cholangiocarcinoma and CRC. 32 Most interesting in this regard is the work by Zhang et al., 16 which shows that miR-26a acts as a tumor suppressor in esophageal cancer by downregulating Rb1, while in this work, we confirmed its function as a regulator of the Rb1 messenger but described a novel oncogenic role in CRC. This apparent discrepancy renders miRNA regulation even more astonishing, as it suggests that a given miRNA–mRNA interaction is not oncogenic or tumor suppressing per se, but can have either outcome depending on the context. The evidence that we present here, together with the targeting of PDHX, 17 highlights the importance of this miRNA as an oncogenic regulator in CRC.
The role of Rb1 in colorectal carcinogenesis remains controversial, as it does not show a constant dysregulation pattern among CRC samples. Palmqvist et al. 33 and Cui et al., 34 among others, have found that Rb1 expression is important for CRC development, while works from Kucherlapati et al. 35 and Parisi et al. 25 show that it is the Rb1 suppression that drives colorectal tumorigenesis. This apparent discrepancy is consistent with our analysis of The Human Protein Atlas data set, where we found Rb1 in varying degrees of underexpression in about half of the tumor samples. These two tumor groups (Rb1 overexpression and suppression) have been distinguished before, 36 so we find it reasonable to assume that the underlying regulation network can lead to CRC development either through Rb1 over- or underexpression. Our data showed that both the colorectal tumors in our murine model and the CRC-derived cell lines that we assayed display Rb1 underexpression and thus resemble this sort of tumors.
Therefore, we propose that miR-26a modulates cell proliferation through Rb1 downregulation in CRC, due to its role in cell cycle regulation. And this function, together with the previously observed regulation of glucose metabolism through PDHX targeting, 17 accentuates the importance of miR-26a as a multifunctional regulator in colorectal carcinogenesis.
On the other hand, Rb1 is regulated by miR-106a as well, 36 and this article appoints miR-26a as a second regulator of this tumor suppressor gene. Several studies are necessary to completely grasp complex regulation networks. In this one, we contribute to this understanding by reporting for the first time that the Rb1 underexpression in CRC is caused by direct interaction with miR-26a. Further studies will undoubtedly show a wider perspective of the regulation network that controls CRC development. Further validation studies employing larger number of pathological samples could help to support the utility of miR-26a as diagnostic molecular marker.
Footnotes
Acknowledgements
E.L.-U. and J.C.-H. contributed equally to this work.
Declaration of conflicting interests
The author(s) declared no potential conflicts of interest with respect to the research, authorship, and/or publication of this article.
Funding
The author(s) disclosed receipt of the following financial support for the research, authorship, and/or publication of this article: This work was partially funded by PAPCA (Programa de Apoyo a los Profesores de Carrera) 2014 program, FES Iztacala-UNAM.