
Abstract
In late-stage metastatic colorectal cancer, difficult treatment decisions should incorporate a thorough evaluation of the patient’s general condition and subject for shared decision making. Assessment of the individual patients’ prognosis is valuable in this setting. The aim was to analyze the prognostic value of plasma levels of total cell-free DNA, carcinoembryonic antigen and C-reactive protein in 97 heavily pretreated patients with metastatic colorectal cancer. Patients received irinotecan, cetuximab, and everolimus in a phase-2 clinical trial (clinicaltrials.gov NCT01387880). Plasma samples were used for DNA purification and quantification of total cell-free DNA by droplet digital polymerase chain reaction. Serum carcinoembryonic antigen and C-reactive protein were analyzed by routine methods. Clinical endpoints were overall survival and progression-free survival. A total of 82 patients had blood samples available for quantification of total cell-free DNA. Patients with pre-treatment cell-free DNA levels higher than the median total cell-free DNA (9800 alleles per milliliter plasma) had a significantly shorter overall survival of 4.3 months (95% confidence interval: 3.6–5.8) compared to patients with cell-free DNA levels below the median with an overall survival of 11.3 months (95% confidence interval: 8.0–14.8, p < 0.0001). When using the upper normal limit from a previously analyzed normal control group, the median overall survival was 11.3 (95% confidence interval: 7.3–14.8) and 4.3 (95% confidence interval: 3.7–6.1) months, respectively (p < 0.0001). Serum carcinoembryonic antigen and C-reactive protein had similar prognostic value with short overall survival and progression-free survival in patients with elevated levels compared to those within normal range. A high-risk profile of elevated cell-free DNA, carcinoembryonic antigen, and C-reactive protein was described, but in combined Cox regression multivariate analysis, only total cell-free DNA preserved a strong prognostic value. In conclusion, total cell-free DNA in plasma, carcinoembryonic antigen, and C-reactive protein could all contribute to assessment of patients’ prognosis and potentially aid in clinical decision making in patients with metastatic colorectal cancer.
Introduction
Evaluation of patients’ general condition and prognosis is essential in daily clinical decision making, as also emphasized in the latest update of the European Society of Medical Oncology (ESMO) consensus guidelines for treatment of metastatic colorectal cancer (mCRC). 1 The panel of available standard drugs for mCRC includes fluoropyrimidine, irinotecan, and oxaliplatin in addition to biological agents, and the median overall survival (OS) reported from clinical trials has now exceeded 2 years. 2 More recently, the role of immunotherapy is being intensively investigated in mCRC, but positive results have so far been limited to small subgroups of microsatellite instability-high (MSI-H) patients. 3 The biological behavior of this disease is still far from understood regarding the role of immunogenic reactions and inflammatory processes.
Consequently, patients with chemotherapy refractory mCRC still have limited effective treatment options, and palliative late-line therapy should be confined to those with the highest chance of benefit and carefully balanced against risk of potential adverse events. There is increasing awareness of the possibilities for shared decision making between patients and clinicians in these difficult situations,4,5 and assessment of the individual patient’s prognosis is essential to bring as exact knowledge to the discussion as needed. Reliable prognostic biomarkers could potentially help in selection of patients and contribute to avoid unnecessary harmful effect without clinical benefit. Unfortunately, there are only limited validated biomarkers for outcome in patients with mCRC.
The only established biomarker in patients with CRC is carcinoembryonic antigen (CEA), which is currently debated due to its unspecific nature, but in general elevated serum levels of CEA are associated with poor prognosis. There is increasing focus on the role of immune-inflammatory mechanisms in CRC, including C-reactive protein (CRP) and interleukin-6 (IL-6) measurement as recently described in a retrospective Nordic analysis in the first-line setting of patients with mCRC. 6 High serum levels of CRP, which is easily measured and used as standard analysis, implied a shorter progression-free survival (PFS) and OS, emphasizing the role of systemic inflammatory processes in this disease. It is, however, generally known that CRP elevations occur in many pathological conditions, and coexisting conditions precluding disease-specific deterioration cannot be excluded on this basis.
In contrast, we have recently reported that circulating free DNA, that is, cell-free DNA (cfDNA) measured in the plasma, is significantly increased in patients with CRC compared to healthy controls, with only limited variations related to non-cancerous co-morbidities. 7 A meta-analysis indicated a strong prognostic value of the total cfDNA plasma levels in nine cohorts of patients with mCRC. 8 In a recent report, we demonstrated increasing level of total cfDNA concentration with higher stage of rectal cancer 9 but have been unable to confirm a direct correlation to tumor volume in the metastatic setting, when analyzed in relation to positron emission tomography (PET)/computed tomography (CT) volume parameters.10,11 These observations suggest that the clinical influence of cfDNA is not only a mirror of disease volume, rather a more complex biological picture in mCRC, strongly correlated to outcome. Further knowledge into the biological mechanisms is needed.
A combination of markers representing tumor biology and systemic inflammatory responses is consequently of major scientific interest and the focus of this study. We aimed to analyze the prognostic value of total cfDNA quantification and elevated serum levels of CEA and CRP in a Danish cohort of heavily pretreated patients with mCRC.
Materials and methods
Patients
A total of 115 patients with chemotherapy refractory mCRC were included in a phase II study investigating the efficacy of irinotecan (180 mg/m2), cetuximab (500 mg/m2), and p.o. everolimus (2.5, 5.0, 7.5 or maximal dose of 10 mg; daily for 14 days) in third or fourth line. All patients were required to have histological or cytological confirmed locally advanced or metastatic adenocarcinoma of colon or rectum not eligible for local treatment. Patients were required to have at least one measurable lesion according to RECIST 1.1. Prior therapy with 5-fluorouracil (5FU), irinotecan, cetuximab, and oxaliplatin was required unless oxaliplatin was contraindicated or the patients did not tolerate the compound. Other criteria included age ≥18 years, a life expectancy of more than 3 months, a World Health Organization (WHO) performance status (PS) ≤2, KRAS wild type, adequate bone marrow with an absolute neutrophil count (ANC) ≥1.5 × 10⁹ L−1 and platelet count ≥100 × 109 L−1, and normal hepatic function with a bilirubin ≤1.5 upper normal limit (UNL) and aspartate aminotransferase and alanine transaminase ≤5 UNL, unless liver metastases were present. Exclusion criteria included pregnancy and lactation, known hypersensitivity to everolimus or other rapamycin, any severe and/or uncontrolled medical condition, uncontrolled diabetes as defined by fasting glucose above 1.5 × UNL, serious liver disease, or a history of uncontrolled gastrointestinal bleeding. Written informed consent was obtained from all patients, and the study ( http://www.clinicaltrials.gov , number NCT01387880) was approved by the Regional Scientific Ethics Committee VEK (20091116). The patients were included at three Danish hospitals from January 2010 to September 2011, and the primary results of this trial will be presented elsewhere. All patients died during follow-up and the median follow-up was 0.6 years (range: 7.00 days–3.8 years). Patients had blood samples drawn prior to and during therapy for translational research.
Sampling
Blood samples from 97 patients were used for this study, including samples drawn at four different time points: before the first cycle of chemotherapy, before the second cycle, before the second last cycle, and immediately prior to the time of radiologically verified progression. The baseline samples were used for prognostic evaluation of cfDNA, CEA, and CRP.
Plasma was obtained from a 3.5 mL blood sample collected in citrate tubes and centrifuged (2300g for 10 min at 4°C) within 2 h of collection and then stored in plasma aliquots at −80°C until analysis.
Cell-free DNA was extracted from 1 to 2 mL plasma using the QIAamp Circulating Nucleic Acid Kit (Qiagen) according to the manufacturer’s instructions. A multiplex droplet digital polymerase chain reaction (ddPCR) reaction measuring Beta-2 Microglobulin (B2M) and the lymphocyte-contamination control primary biliary cirrhosis (PBC)12,13 was set up on the QX200 droplet digital PCR system (Bio-Rad) and performed on all samples. B2M was used as an estimate of total cfDNA concentration, while PBC was used to identify samples with lymphocyte DNA contamination. Contamination was calculated as the ratio between PBC and B2M. Samples with PBC > 0.01% were excluded from further analysis. Reactions consisted of 5 μL sample, 1 μL of each primer-probe mix, and 10 μL 2 × ddPCR Supermix for probes (Bio-Rad). 9 Primers and probes are previously published 11 and shown in Supplementary Table 1. The cycling steps for the ddPCR were as follows: 95°C for 10 min, 40 cycles of 94°C for 30 s, and 60°C for 1 min, and finally 98°C for 10 min. The ddPCR reactions were performed according to manufacturer’s recommendations, and all runs included positive and negative controls used for setting threshold.
The resulting number of copies per microliter reaction volume was used to estimate the number of copies per milliliter plasma. Copies per microliter reaction volume were multiplied by the total reaction volume (22 μL), divided by the sample input volume (5 μL), multiplied by the cfDNA elution volume (100 μL), and finally divided by the total input plasma volume (1–2 mL). Analysis was performed at Department of Clinical Biochemistry, Aarhus University Hospital, Denmark.
As part of routine management, serum CEA and CRP were measured at baseline. CEA was analyzed using the Siemens Healthcare Diagnostics ADVIA Centaur CEA analysis, a two-site sandwich direct chemiluminometric assay. CRP was measured by a high-sensitivity turbidimetric assay (Dako). The UNL for CEA (5 ng/mL) and CRP (10 mg/L) were used for cut-off in survival analysis.
Statistics
Correlations between patient characteristics and cfDNA were analyzed by the Wilcoxon rank sum test or cross-tabulation when appropriate. Analysis of variance (ANOVA) was used to describe the dynamics of cfDNA levels during therapy, and receiver operating characteristic (ROC) curve was used to illustrate the value of differences in plasma cfDNA levels from a previously analyzed normal cohort. 14 OS was calculated from the time of inclusion until the date of death from any cause, and PFS was calculated from the time of inclusion until death or progression of mCRC. Survival data were analyzed by Kaplan–Meier method, and differences between the groups were estimated by the log-rank test. The independent effect of different variables was investigated in a multivariate Cox regression analysis. Both known prognostic variables and the variables of interest in the study were included in the model. Two-sided p values <0.05 were considered as significant. All statistics were carried out in the NCSS statistical software (NCSS Statistical Software; version 07.1.15, 2009).
Results
The results of the primary clinical trial will be published separately. A total of 97 patients had plasma samples available for DNA quantification. Total cfDNA quantification was possible in all samples, but contamination from normal lymphocytes was detected in 15 cases (PB levels >0.01%) leaving a total of 82 samples available for correlation to clinical data. The median level of B2M alleles per milliliter plasma was 9800 copies/mL (range 1700–255,600), comparable to previously published studies.9–12,15
Cell-free DNA levels and relation to general biological parameters
Analyses of the median plasma levels of cfDNA reveal significantly higher plasma cfDNA in patients with poor PS. Baseline plasma cfDNA levels were also analyzed in relation to standard biological blood parameters including hemoglobin (HGB), platelets, absolute neutrophil count (ANC), white blood cell (WBC) count, bilirubin, and lactate dehydrogenase (LDH). Results of correlation analysis revealed a primarily significant positive correlation between cfDNA and LDH and CEA and CRP (plots/data not shown, p < 0.05). Plasma cfDNA and serum CEA and CRP levels in relation to the PS of the patients are shown in Figure 1, and an association with PS by all three parameters is also shown in Figure 1.
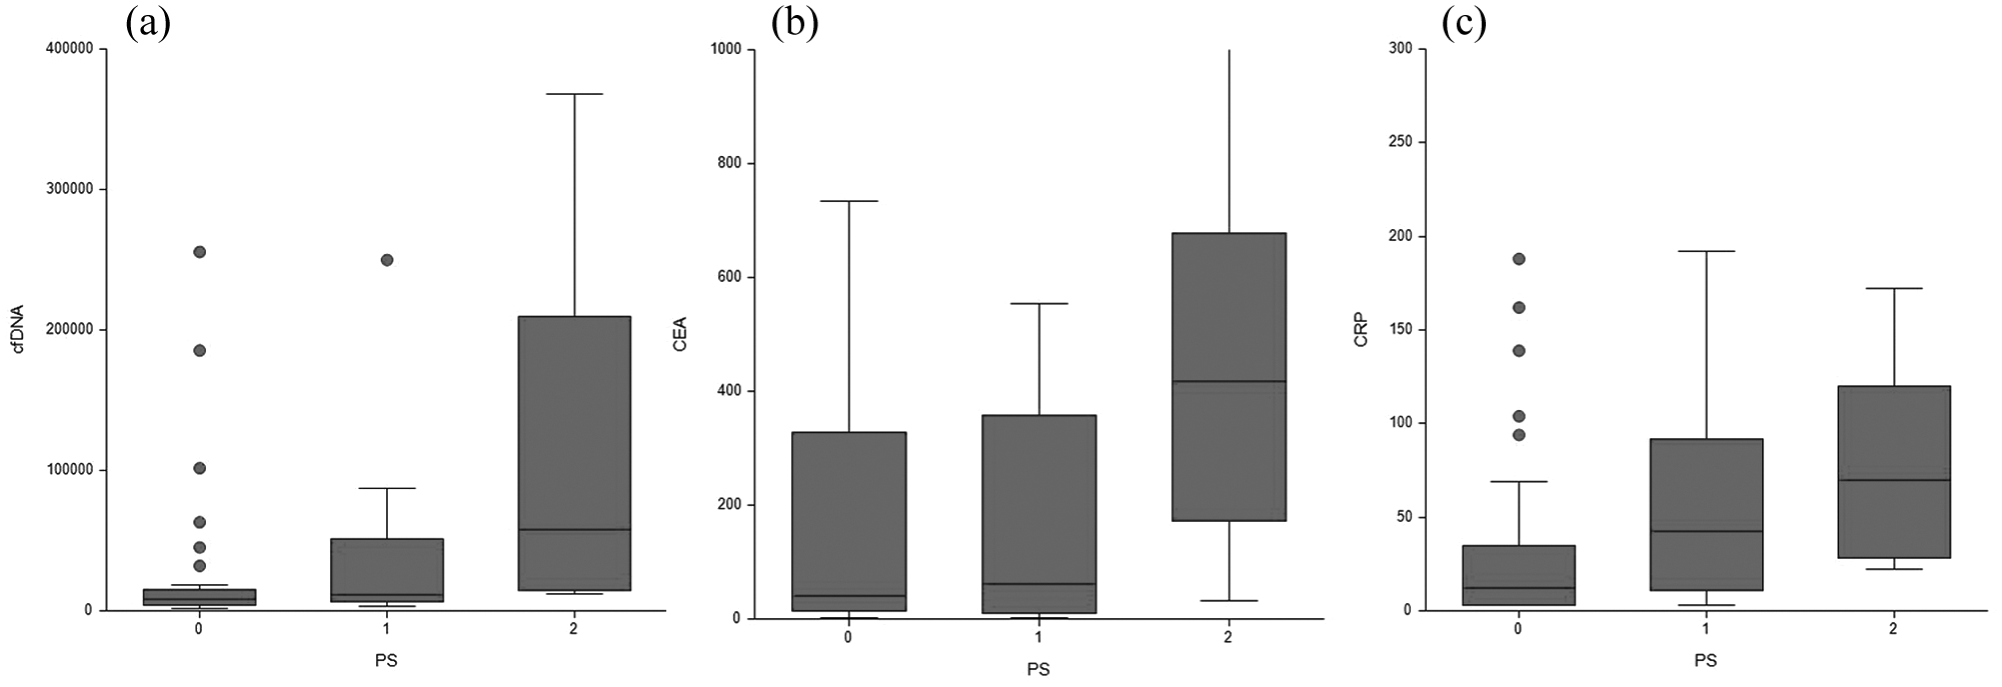
Box and whisker plots of the three biomarker levels in relation to patient ECOG performance status. Figure 1 depicts Box and whisker plots with 25%, 50%, and 75% percentiles and upper and lower adjacent values and outliers (dots). Horizontally, the one group of patients according to performance status 0–2; vertically, the (a) cfDNA, (b) CEA and (c) CRP concentrations.
Cell-free DNA dynamics during therapy
The median plasma levels of cfDNA significantly decreased during the first cycles of therapy and showed increasing levels toward time of progression, when analyzed by ANOVA test. The median level increased from 6200 alleles per milliliter (95% confidence interval (CI): 4600–9000) to 9300 (95% CI: 7800–13,700) at the time of disease progression as shown in Figure 2. Although dynamics seem to mirror biology, analysis of the relative early changes from baseline and before the second cycle did not provide supplementary prognostic information to the observation described in the following.

Dynamics of total cfDNA during therapy by ANOVA analysis. Figure 2 depicts the total cfDNA concentration measures as B2M alleles per milliliter plasma on the vertical axis. Time points of blood sampling 1–4 are marked on the horizontal axis (1—baseline, prior to initiation of treatment, 2—prior to the second cycle of treatment, 3—second last sample drawn (2 weeks prior to radiologically verified progression), and 4—time point of progression).
Baseline marker levels and clinical outcome
The baseline plasma cfDNA level was significantly higher in patients with a poor outcome from treatment. To analyze the prognostic value of cfDNA, quartiles were used for log rank testing and revealed that there was a significantly longer PFS and OS in patients with low levels of cfDNA and decreasing median survival with increasing number of alleles. When dividing patients into four groups based on quartiles (Q) of baseline cfDNA levels, the median OS was 13.1 months (8.6–16.6; lowest Q1), 7.3 months (5.5–10.4; Q2), 5.6 months (4.3–7.0; Q3), and 2.6 months (2.0–6.1; highest Q4), respectively (p = 0.0007). Notably, patients with levels above the 75% quartile had a median OS of 2.6 months compared to 8.0 months in the group of patients below the 75% quartile. The hazard ratio (HR) was 2.41 (95% CI: 1.21–4.79, p < 0.0005) indicating a strong detrimental effect on survival in this group of patients.
Patients with pre-treatment levels higher than the median total cfDNA (9800 alleles per milliliter plasma) had a significantly shorter median OS of 4.3 months (95% CI: 3.6–5.8) compared to patients with levels below the median, with 11.3 months (95% CI: 8.0–14.8; HR: 2.75 (95% CI: 1.67–4.55), p < 0.0001). When using a pre-defined cut-off (9500 alleles per milliliter plasma) based on the UNL from a previously analyzed normal control group, 8 the HR for OS was 2.54 (95% CI: 1.58–4.08, p < 0.0001; Figure 3). The same applied to PFS with longer median interval in favor of patients with the lowest plasma cfDNA levels (median PFS of 4.0 months (95% CI: 2.9–4.7), compared to 1.9 months (1.7–2.6; HR: 2.11 (95% CI: 1.28–3.49), p = 0.0009)), as shown in Figure 4.

Kaplan-Meier plots of survival according to the different markers: (a) OS in patients with levels of cfDNA in quartiles (N = 20, 21, 21, and 22, respectively, p = 0.0007). Highest quartile left, lowest quartile right. (b) OS in patients with levels of cfDNA above (n = 42, blue line) and below (n = 39, red line) the UNL (HR = 2.54, p < 0.0001). (c) PFS in patients with levels of cfDNA above (n = 35, blue) and below (n = 34, red) the UNL (HR = 2.11, p = 0.0009). (d) OS in patients with levels of CEA above (n = 84, blue) and below (n = 8, red) the UNL (HR = 2.18, p = 0.02). (e) OS in patients with levels of CRP above (n = 70, blue) and below (n = 26, red) the UNL (HR = 2.0, p = 0.0014). (f) OS in high- (n = 42, blue) and low-risk (n = 50, red) patients stratified by triple marker analysis (HR = 2.93, p < 0.0001).
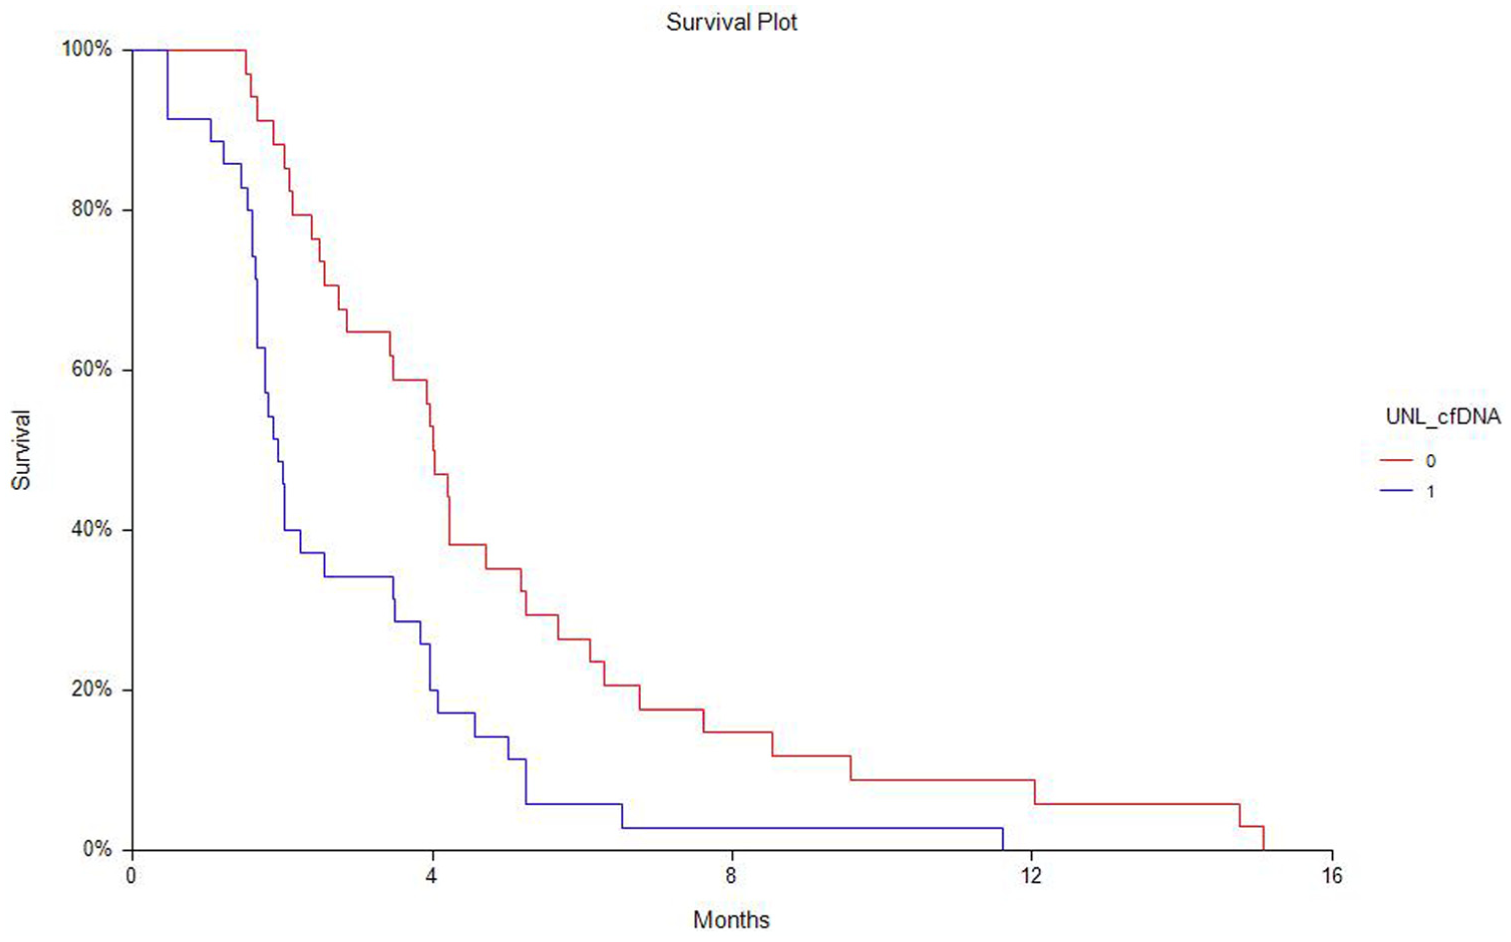
Kaplan–Meier plots of progression-free survival according to cfDNA levels above or lower than the UNL. Figure 4 depicts survival curve of patients with cfDNA levels above the UNL (1) or below (0).
Univariate survival analysis of CEA showed that high serum CEA (i.e. above the UNL of 5 ng/mL) was associated with poor prognosis. The OS HR was 2.18 (1.27–3.75, p = 0.03) with the median OS of 12.4 months (95% CI: 8.3–39.1) in patients with normal CEA compared to 7.0 months (95% CI: 5.6–8.0) in patients with elevated serum CEA levels. Significantly longer PFS was also found in patients with normal CEA levels (data not shown). However, only eight patients showed normal levels of CEA at the beginning of therapy.
Similarly, univariate survival analysis of CRP showed that high serum CRP (i.e. above the UNL of 10 mg/L) was associated with poor prognosis. The approximately 25% of patients with normal serum levels of CRP at baseline had significantly longer PFS (median PFS of 4.2 months (95% CI: 3.9–5.2 months); HR = 2.02, 95% CI: 2.07–8.51, p = 0.002) and longer OS (median OS of 11.3 months (95% CI: 7.5–16.2 months; HR = 2.0, 95% CI: 1.34–3.01, p = 0.0012)) compared to those with higher CRP levels (median PFS of 2.5 months (95% CI 2.0–3.6 months); median OS of 5.5 months (95% CI 4.2–6.9 months)). The corresponding Kaplan–Meier curves for PFS and OS are presented in Figure 3.
Combining the three parameters identified a group with triple elevated levels of cfDNA, CEA, and CRP and a median PFS HR of 2.62 (95% CI: 1.46–4.70, p < 0.00001) and median PFS of 4.0 months (2.9–4.7) and 1.8 months (1.6–2.0) in low- and high-risk groups, respectively. The HR for OS in the high-risk group was 2.93 (1.71–5.02, p < 0.0001) and median OS was 4.0 months (2.9–5.6) in the patients with high levels compared to 10.3 months (95% CI: 8.0–12.4) in patients with low levels of cfDNA, CEA, and CRP. The corresponding Kaplan–Meier curves for PFS and OS are shown in Figure 3. However, when building a multivariate analysis including PS, CEA, CRP, and cfDNA, only elevated total cfDNA plasma levels showed independent prognostic value in this study, as demonstrated in Table 1.
Univariate and multivariate analyses.

OS: overall survival; PFS: progression-free survival; CRP: C-reactive protein; UNL: upper normal limit; CI: confidence interval; CEA: carcinoembryonic antigen; cfDNA: cell-free DNA.
Discussion
Clinical decision making in patients with advanced incurable metastatic CRC should include patients’ preferences and detailed discussion of the potential palliative options.4,5 Since late-stage disease often implies an inevitable deterioration of health, a nuanced evaluation of patients’ general condition as well as prognosis are important aspects to consider in order to provide the best care for the patient. These aspects can be valuable tools for both patient and treating physician during shared decision making regarding the relevance of systemic therapy.
Inflammatory processes and cancer are closely related, and it is well described that systemic inflammation can cause tumor progression and high inflammatory activity is associated with poor prognosis in various cancer settings. These aspects are increasingly subject for clinical investigations by, for example, the addition of anti-inflammatory mediators to systemic treatment of patients with CRC as recently reviewed and use of nonsteroidal anti-inflammatory drugs (NSAID)/aspirin to lower the risk of CRC development.16,17 However, tumors with high antigenic properties, that is, the MSI-H tumors with a high frequency of microsatellite instability, are characterized with a substantial local immune response and inflammatory processes and hold a better prognosis and as more recently demonstrated, potential sensitivity to immunotherapy. 3 The interaction between immune responses, inflammation, and tumor activity is thus far from fully understood, but with emerging data and new targets for immunotherapy, a deeper as well as more direct clinical understanding is urgently needed. Consequently, the search for predictive and prognostic biomarkers in patients with mCRC should include not only tumor-specific mechanisms but also take into consideration the importance of the microenvironment and inflammatory processes.
Since tumor-promoting inflammation is an emerging cancer, hallmark inflammatory biomarkers are of special interest in the search for new valuable prognostic biomarkers in patients with CRC.18,19 This study has therefore investigated three parameters with biological information related to CRC and systemic inflammation and confirmed a strong prognostic value of CEA, CRP, and total cfDNA, with an independent superior prognostic influence of the total cfDNA. To the best of our knowledge, no similar investigations have been reported. Results have demonstrated a clear relation between all three parameters and patients’ general condition, as described by Eastern Cooperative Oncology Group (ECOG) PS, which in itself hold prognostic information. In addition, we reported a clear correlation between the quantitative cfDNA concentration and the acute phase reactant, but also demonstrated that the cfDNA measurement hold a superior independent prognostic value compared to the latter. This observation supplements our previous data of a strong prognostic value 8 with new biological observations and could help assist in clinical decision making in heavily pretreated patients with mCRC. In general, patients with low levels of cfDNA and normal inflammatory parameters seem to benefit more from systemic treatment, whereas those with higher levels show early progression and more rapid deterioration. Risk assessment for patients with high levels of all three parameters has revealed an HR for death of 2.93 and an median survival difference of more than 6 months in patients with low levels of all markers. Whether an observed high-risk condition including poor PS and high levels of the prognostic biomarkers is potentially reversible upon effective systemic therapy and/or addition of anti-inflammatory mediators could be subject for future clinical studies.
In conclusion, at this point, we have identified potentially interlinked strong prognostic biomarkers in patients with mCRC, as well as demonstrated the strong independent influence of total cfDNA levels, the clinical implication of which should be further investigated.
Supplemental Material
Supplementary_Table_1 – Supplemental material for Total cell-free DNA, carcinoembryonic antigen, and C-reactive protein for assessment of prognosis in patients with metastatic colorectal cancer
Supplemental material, Supplementary_Table_1 for Total cell-free DNA, carcinoembryonic antigen, and C-reactive protein for assessment of prognosis in patients with metastatic colorectal cancer by Karen-Lise Garm Spindler, Christina Demuth, Boe Sandahl Sorensen, Julia S Johansen, Dorte Nielsen, Niels Pallisgaard, Estrid Hoegdall, Per Pfeiffer and Benny Vittrup Jensen in Tumor Biology
Footnotes
Acknowledgements
We thank the Novo Nordisk Foundation for funding of this report.
Declaration of conflicting interests
The author(s) declared no potential conflicts of interest with respect to the research, authorship, and/or publication of this article.
Funding
The author(s) disclosed receipt of the following financial support for the research, authorship, and/or publication of this article: The cfDNA analysis were supported by Novo Nordisk Faundation and Kai and Gundhild Kai Langes Fund.
References
Supplementary Material
Please find the following supplemental material available below.
For Open Access articles published under a Creative Commons License, all supplemental material carries the same license as the article it is associated with.
For non-Open Access articles published, all supplemental material carries a non-exclusive license, and permission requests for re-use of supplemental material or any part of supplemental material shall be sent directly to the copyright owner as specified in the copyright notice associated with the article.