
Abstract
The conventional method of measuring biomarkers in malignant tissue samples has already given subversive growth in cancer diagnosis, prognosis, and therapy selection. However, the regression and heterogeneity associated with tumor tissue biopsy have urged for the development of an alternative approach. Considering the limitations, cell-free DNA has emerged as a surrogate alternative, facilitating preoperative chemoradiotherapy (p < 0.0001) treatment response in rectal cancer and detection of biomarker in lung cancer. This potential of cell-free DNA in several other cancers has yet to be explored based on clinical relevance by optimizing the preanalytical factors. This review has highlighted the crucial parameters from blood collection to cell-free DNA analysis that has a significant impact on the accuracy and reliability of clinical data. The quantity of cell-free DNA is also a limiting factor. Therefore, a proper preanalytical factor for blood collection, its stability, centrifugation speed, and plasma storage condition are to be optimized for developing cancer-specific biomarkers useful for clinical purpose. Liquid biopsy–based origin of cell-free DNA has revolutionized the area of cancer research. Lack of preanalytical and analytical procedures may be considered for identification of novel biomarkers through next-generation sequencing of tumor-originated cell-free DNA in contradiction to tissue biopsy for cancer-specific biomarkers.
Keywords
Introduction
The DNA research gained momentum when in 1984 Alec Jeffreys created the DNA profile of Colin Pitchfork in the Enderby murder case. 1 Subsequently, the beginning of 20th century witnessed the tissue biopsy approach 2 in identifying somatic mutations in lung cancer, 3 breast cancer, 4 colorectal cancer, 5 ovarian cancer, 6 gastric cancer, thyroid cancer, and pancreatic ductal adenocarcinoma. 7 Although these mutational signatures have been generated by decoding the DNA profiles with identified ERBB2 over expression in breast cancer, there are many other successful contributions to cancer diagnosis and therapy. These include the ABL1 rearrangements in chronic myeloid leukemia, KIT mutations in gastrointestinal stroma tumors, EGFR mutations in non-small-cell lung cancer, 8 KRAS gene resistance to cetuximab in colorectal cancer, and the role of vemurafenib in melanoma patients with V600E BRAF mutation. 9 These targets were identified in late invasive and metastatic cancers, thereby limiting the success of the treatment. 10 The heterogeneity associated with tumor tissue, including the difficulties like discomfort suffered by the patient, inherent clinical risks to the patient, and economic consideration, provides a limitation to the conventional tissue biopsy approach. Also, some tumors are not accessible for biopsy, and the procedure itself might increase the risk of cancer “seeding” to other sites. 11 Even in an ideal situation where several metastatic sites can be biopsied simultaneously, the analysis of the samples can delay the initiation of treatment and might jeopardize the efforts of treatment. These limitations are appropriate restraints in the detection of therapeutic biomarkers at an early stage that would allow a successful change in treatment course. 12
Due to the limitations associated with tumor biopsy approach, a new perception in observing the genetic profile of tumor dynamics was shown by Mandel and Metaís in 1948. They discovered the presence of cell-free DNA (cfDNA) in plasma of healthy and diseased humans. 13 Since the discovery of cfDNA in the human circulatory system, cancerous and non-cancerous origins like infection, diabetes, rheumatoid arthritis, stroke, inflammation, preeclampsia, and prenatal diagnosis have been successfully added toward the acceptance of cfDNA in disease management.14,15 CfDNA that is released by tumor cells conserves the genetic characteristics of the original tissue. 16 Therefore, the study on cfDNA allows tumor characterization by a non-invasive procedure and likewise resolves the complexities of traditional tissue biopsy. 17 The cfDNA integrity index can also be used as an indicator to monitor the treatment response. In case of preoperative chemoradiotherapy, the cfDNA integrity index of Alu 115, Alu 247, and β-globin during treatment was significantly higher in rectal cancer patients (47.5 and 47.0 ng/mL and 1.1, respectively) than in healthy control subjects (0.3 and 1.0 ng/mL and 0.1, respectively). The results revealed that cfDNA integrity index was significantly (p < 0.0001) associated with tumor response to the treatment.18,19
Decades after the explanation of cfDNA in human blood, most studies have focused on diagnostic and prognostic uses of biomarkers from solid tumors. This is mainly due to lack of large study cohort, proper knowledge concerning the biogenesis of cfDNA, inadequate characterization of the biomolecules, and the absence of an analytical consensus. 20 However, despite showing great promise as potential biomarkers, quantitative analysis of cfDNA has partially succeeded in developing prenatal tests using BEAMing (beads, emulsions, amplification, and magnetics) techniques and Roche cobas® EGFR Mutation Test v2 kit in lung cancer. 21 Cancer-associated cfDNA biomarkers in oral cavity and pharynx, digestive system, respiratory system, skin (excluding basal and squamous), endocrine system, breast, and different other tumor types 22 still lack in clinical practices.
The control of various parameters, from blood collection to cfDNA isolation, has a significant impact on the quality and accuracy of the data. Therefore, a proper consciousness in preanalytical factors concerned with cfDNA isolation requires synchronization in optimization and standardization based on its yield as its isolation is still a challenge. The purpose of this review is to highlight the necessity of an analytical consensus, on blood collection tube (BCT), incubation time at room temperature (RT), centrifugation steps, and quantification methodologies that will be useful in consideration for the optimization of cfDNA measurements and development of a standard operating procedure.
Influence of preanalytical variables in processing and recovery of cfDNA
Collection tubes
The anticoagulant and hydrolytic enzyme’s inhibition property are crucial to prevent 90% of deoxyribonuclease activity in blood plasma.23,24 Different anticoagulants (ethylenediaminetetraacetic acid (EDTA), citrate, or heparin) and cross-linking reagents in BCTs cause variation in the quality and integrity of cfDNA isolated from blood plasma. This is mainly due to lysis of blood cells, eminently from leukocytes, and due to DNA damage caused by traditional cell-stabilizing reagents such as formaldehyde and glutaraldehyde.25,26 Among the available anticoagulant and stabilizing agents, EDTA (dipotassium 1.5–2.2 mg/mL blood, tripotassium 1.5–2.2 mg/mL blood, and disodium 1.4–2.0 mg/mL blood), citrates, heparin, and oxalates are mostly preferred in clinical studies. 27 However, K2EDTA and K3EDTA are standard anticoagulants with DNAseI inhibiting property 28 that has been used in cfDNA studies. However, it was found that total plasma DNA (pDNA) concentrations were stable in K2EDTA, only if whole blood was processed into plasma within 6 h. 29 Scheduled comparison of K2EDTA versus BCT Streck™ tubes for 1,3, 5, and 7 days at RT showed an elevated level of cfDNA in K2EDTA tubes. 29 Equally, on comparing the blood storage at two different conditions (ice vs RT) at 2, 6, and 48 h, there were no changes observed, affecting the stability of cfDNA for up to 6 h. However, at 48 h, the cfDNA level declined in K2EDTA tube, with no such observation recorded in the BCT Streck™ tubes. 7
However, Fernando et al. 30 reported the stability of cfDNA BCT over K3EDTA vials. Similarly, Nortan et al. also attempted to investigate the difference between K3EDTA blood collection vials against Cell-Free DNA BCT Streck™ tubes. The result of the study indicated that blood in K3EDTA tubes incubated at 6°C, 22°C, and 37°C showed an increase in pDNA concentration, while in BCT Streck™ tubes, it remained stable. 31 Neto et al. showed that delay in plasma processing of blood collected in K3EDTA vials showed a drastic decrease in pDNA concentration by questioning the stability and utility of K3EDTA vials over time.32,33 Conclusively, cfDNA BCT Streck™ tubes on testing have shown to stabilize cell membranes in whole blood by minimizing cell lysis and subsequent release of cellular DNA into plasma.34,35 Hence, proving its utility in clinical studies as a crucial preanalytical factor in cfDNA optimization studies.
Serum or plasma as a better source of cfDNA
Serum and plasma feature the reliable sources of cfDNA. The detection of pathological conditions such as malignancies, inflammatory bowel disease, systemic lupus erythematosus, as well as cell chimerisms from serum or plasma serves as a rich source of biological information.36–38 Isolation of serum or plasma at different time intervals, after blood withdrawal, has confirmed that cfDNA from serum gets contaminated by blood cells and the amount of contamination increases with the number of days between blood withdrawal and serum separation.39,40 The cfDNA concentration ranges from 3- to 24-fold higher in serum than in plasma due to the larger quantity of background maternal DNA and possibly as a result of the liberation of DNA during the clotting process. 41 Interestingly, the influence of time delay in blood processing for plasma and serum is compared only in few studies. 42 Jung et al. did not observe any change in the DNA concentration in plasma samples (at RT or 4°C for up to 24 h). However, the time delay of 2–8 h at RT before centrifugation had a substantial impact on cfDNA with ∼3.8- to 4.8-fold increased cfDNA concentration in serum samples. Moreover, the blood stored at 4°C for 24 h showed an ∼3-fold increase concentration of cfDNA when compared with plasma. 43
On the contrary, Board et al. in lung cancer patients established that the mean DNA concentration in the serum was significantly higher than the plasma of healthy controls (24.6 ng/mL vs 5.07 ng/mL). The time dependency of cfDNA concentration in the serum processed after 24 h was significantly higher than that of serum processed within 1 h in healthy controls (83.6 ng/mL vs 24.6 ng/mL) and patients (51.9 ng/mL vs 16.6 ng/mL). 44 On comparing the levels of cfDNA over time, the plasma yielded a much low quantity than the corresponding serum samples. Furthermore, the mean DNA content in serum increased from 6×10³ copies/mL on Day 0 to 2×10⁵on Day 5 than the mean pDNA level of 1×10³ copies/mL on Day 0 and 3×10⁴ on Day 4. This supports that serum samples contain much more cell-free genomic DNA than plasma samples and the levels of cfDNA in serum increase with storage of the collection tube at 4°C;45,46 while 4–25 h after venipuncture of samples stored at RT showed increased cfDNA concentration by 1.6 fold, indicating that a high false-positive result can be obtained after 6 h of venesection at RT.47,48
The difference between plasma and serum can arise during separation and storage temperature. 49 Real-time polymerase chain reaction (PCR)-based comparative Δct method of (ct of the mutation-specific PCR – ct of the control PCR) EGFR mutation showed no variance in healthy donors. However, 13 out of 18 patients tested positive for EGFR mutation in their serum. Furthermore, when plasma cfDNA was tested, a mutation was detected in 18 out of 19 collected samples (18/19, 94.7% sensitivity), thereby giving a clear indication toward the reliability of cfDNA from plasma over serum. 50 To determine the preference of cfDNA from plasma and serum, we did a literature search from 2007 to 2016 (Figure 1) on published articles on cfDNA from plasma/serum in PubMed using manage filter option to optimize our search results. Based on the above clinical evidence and the results obtained from PubMed database, blood plasma is the preferred source of cfDNA studies.

The 10-year publication trend in cfDNA from plasma/serum: the published articles in PubMed from 2007 to 2016 showed the higher preference of cfDNA from serum until 2010. However, a consistency from 2011 onwards in publication pattern was observed in cfDNA from plasma.
Blood plasma storage conditions
In case of cfDNA, processing of blood samples after venipuncture for plasma isolation is to prevent cellular DNA contamination that can cause a spike in the authenticity of the study. 51 As far as prolong plasma storage condition is concerned, −80°C and −20°C before cfDNA extraction has no effect on DNA concentration. 52 However, whole blood storage at 4°C or RT is recommended with immediate plasma separation and processing. Isolation of cfDNA within 6 h is also recommended to minimize the increase in cfDNA concentration from the lysis of white blood cells (WBC). 53
Furthermore, based on the literature reviewed and supplementary data obtained from 84 laboratories,20,33 it is evident that 41% of laboratories store plasma at −80°C (Table 1 and Figure 2) until processed further, while 21% of laboratories store isolated plasma at −20°C, and sample kept at 4°C is processed within 15 min to 6 h of arrival. Therefore, plasma stored at −80°C is recommended until processed further for cfDNA isolation. 63
Overview of different isolation techniques, centrifugation speed, storage temperature, quantification approach, and estimation of cell-free DNA based on concentration and fragment length.

EDTA: ethylenediaminetetraacetic acid; RT: room temperature; PCR: polymerase chain reaction.

Plasma storage distribution: data of 84 laboratories show that 36% of laboratories store plasma at 4°C before cfDNA isolation followed by 41% of laboratories storing plasma at −80°C. The number of laboratories participating in the study was obtained from the supplementary data of Malentacchi et al. and Table 1. The data support storage of plasma samples at −80°C and −20°C (with not much difference in the number of laboratories storing plasma at 4°C).
Quantitative evaluation of cfDNA prior to downstream application
The inconsistency encountered in cfDNA-based research is due to its low concentration and quantification approach prior to the downstream application. 64 The quality control–based evaluation is performed by one of these methods: (1) measuring the intensity of a band on an agarose gel, 65 (2) fluorescence measurements of DNA-binding dyes, and (3) estimation of ultraviolet (UV) absorbance at 260 nm. 66 However, most of them do not cover all the physiological cfDNA concentration range.67,68 The substantial limitation of UV absorbance is the large contribution of nucleotides, single-stranded nucleic acids, and proteins to the elevated absorbance value; the inability to distinguish between DNA and RNA; and the low sensitivity of the assay (it requires ≥2 μg/mL dsDNA). Because of this shortcoming, alternative techniques for the reliable quantification with more efficacy and less variance has to be sought for cfDNA quantification. 69 The most commonly used available methods of cfDNA quantification apart from the spectrophotometric method are fluorescent dyes–based Hoechst 33258, 70 PicoGreen, 71 and multi-copy gene quantitative polymerase chain reaction (qPCR) analysis. 72 Hoechst 33258 allows the detection and quantification of DNA at concentrations as low as 10 pg/μL. The quantitative measurement using PicoGreen presently is very popular and allows detection of dsDNA in a final concentration as low as 25 pg/μL. The disadvantage is that the assessment of nucleic acids by fluorescent dyes underestimates the concentration of double-stranded DNA with a size less than 23 kbps.73,74 Another method used for cfDNA quantification is qPCR, and because of its high sensitivity and specificity for molecular applications, it is an excellent choice for qualitative and quantitative assessments of DNA. The applications of qPCR targets for ribosomal DNA, 75 Alu repeats of 83–115 bp (smaller/longer fragments) and 244–247 bp (longer fragments), and glyceraldehyde 3-phosphate dehydrogenase (GAPDH) of 125 bp can develop the qPCR sensitivity over the inadequate sensitivity of conventional PCR.76–78 Apart from this, based on the technical advancement, the two most excellent choice of cfDNA quantification is Qubit fluorometer and Bioanalyzer 2100©. Qubit fluorometer offers quantification using cfDNA sample concentrations of, as low as 10 pg/μL, by offering high analytical sensitivity, high throughput, and improved tolerance to contaminants. As such, an increasing number of laboratories have adopted this approach as a best practice for next-generation sequencing (NGS) applications. 79 The second choice of quantitative and qualitative assessments is Bioanalyzer 2100© system from Agilent Technologies which is a chip-based nucleic acid analysis system, where microfluidic technology is used to pass 1 μL of the sample through a microchannel. The result is in the form of electropherogram which provides information regarding the size range of fragments that make up the nucleic acid sample.80,81 Based on the mentioned techniques of quantification, the popularity of Qubit fluorometer has emerged over other technologies in cfDNA quantification prior to downstream applications.
cfDNA isolation techniques and impact of differential centrifugation speed
The advancement of science and technology rests upon the pillars of conventional methodologies by utilizing its principal in designing the advanced approach. These advancements in the form of commercially available kits have minimized the time consumption and error. Looking at the current scenario, there are 11 methods of cfDNA isolation (Table 1), that is, Triton/Heat/Phenol (THP) protocol, phenol/chloroform method (Hufnagl et al.), modified phenol/chloroform (MPC), phenol/chloroform, NucleoSpin Plasma XS, FitAmpTM plasma/serum DNA isolation kit, Polymer Mediated Enrichment (PME)-free circulating DNA extraction kit, QIAamp circulating nucleic acid kit, chemagic circulating nucleic acid kit, Quick-cfDNATM serum/plasma kit, and Norgen cfDNA kit. All the above-mentioned kits on testing demonstrated a discrete quantified values of cfDNA based on the reading obtained by qPCR of GAPDH, β-actin, and β-globin, ranging from 264.28 to 9581 ng/mL in the advanced stage of cancer patients. In case of direct quantification using Qubit, the isolated cfDNA ranged in between 4 and −146 ng/mL.82,83
As far as the concentration of cfDNA yield per milliliter of plasma is concerned, four different extraction kits, that is, QIAamp® DNA Blood Mini Kit, QIAamp® Circulating Nucleic Acid Kit, NucleoSpin® Plasma XS Kit, and FitAmp® Plasma/Serum DNA Isolation Kit were used. The quantification was done using qPCR for HPRT, GAPDH, and ACTBL2 genes. The QIAamp® DNA Blood Mini and QIAamp® CNA Kits gave the highest quantities of cfDNA per milliliter of plasma (mean 264.28 and 239.85 ng/mL, respectively), that is, 10-fold higher than the other two kits. The qPCR results, upon validated using Qubit, highlighted an increased value of cfDNA (360 and 390 ng/mL). The results indicated a huge variability in cfDNA recovery with a need for further optimization and standardization of isolation techniques prior to the downstream application. 57 Based on differential centrifugation speed, Herrera et al. in 2005 demonstrated that one centrifugation step at 1600g for 5 min and double centrifugation at 1600g for 10 min showed a dramatic difference in sample yield of blood banked stored esophageal cancer samples (819 μg/L) and fresh (13 μg/L) samples. Similarly, for optimization, Swinkels et al. showed that two-step centrifugation step of 8000g followed by 16,000g is enough to remove the cell remains in plasma fraction to produce absolutely cell-free pDNA.25,84
However, cancer patients have higher plasma concentrations of cfDNA than healthy individuals, which varies dramatically among groups, that is, healthy controls and cancer patients. In 1 mL of plasma, healthy controls contain 0.3–10.3 ng of cfDNA, whereas in cancer patients it is 8–798 ng of cfDNA, respectively. 85 According to the reports, in healthy group, mean concentration of cfDNA varies from 1 to 27 ng/mL between the studies due to different techniques being used for the sample processing, DNA extraction, and quantification. 86 Most liquid biopsy studies have focused on the advanced stages of cancer with relatively high concentrations of cfDNA. Detailed information on early-stage cancer and low concentrations of cfDNA are lacking. 87 Moreover, there are no generally accepted units of measurement for cfDNA quantification. In literature, the data are presented in median CT, percent value to total cfDNA or multiple of median (MoM), genome equivalents per milliliter of plasma (GE/mL), or its logged equivalent. This inconsistency complicates the data analysis, reproducibility, and comparability of the tests. 88
Cancer-related identified genetic alteration in cfDNA
Extracellular nucleic acids also referred to as cfDNA hold a range of molecular alterations found in tumor cells such as somatic DNA mutations. CfDNA released from the tumor into the blood makes it an absolute blood-based cancer diagnosis inquest. CfDNA as a biomarker is easily accessible, reliable, and reproducible.12,89 As far as cfDNA from plasma and tissue biopsy is concerned, there exist 76.4% of concordancy between the two, with identified genetic alteration of P53, PIK3CA, PTEN, AKT1, IDH2, and SMAD4 in breast cancer. 90 To determine the status of cfDNA-identified alteration, we gathered information on the most common cancers from already published articles with prostate, lung, liver, stomach (gastric cancer), breast, 91 head and neck, esophageal, and colorectal cancer. 92 We have highlighted the identified somatic mutations in cfDNA (Table 2).
Somatic mutations identified in cancer using cell-free DNA.

PCR: polymerase chain reaction.
Over the past few years, next-generation technology has emerged as a revolutionizing tool against the cancer genome analysis. Genome profiling of tumor-originated cfDNA serves as a rich source of biological information in contradiction to tissue biopsy.105,106 CfDNA-based non-invasive method can be used in detection and monitoring specific biomarkers that are recommended for the proper treatment and management of cancer patients using qPCR, digital PCR, and high-throughput sequencing approach.87,107,108 At the other end, whole-genome sequencing and targeted sequencing using customized 50 and 409 genes panel are capable of providing the global real-time picture of tumor progression and management.109,110 It was found that cfDNA from pancreatic ductal adenocarcinoma revealed the mutation status in KRAS, P53, PIK3CA, PTEN, AKT1, IDH2, and SMAD4 by decoding the genomic profile through whole-genome sequencing. 109 Furthermore, the methylation profile of important events concerning GSTP1, APC, and TP53 hypermethylation status of most common somatic alterations present in the circulation of prostrate and colorectal cancer, with CST6 hypermethylation in breast cancer, can also be determined using NGS.40,111 CfDNA can provide the exact trail of pathogenicity in cancer and emerge as a precise molecular marker against a variety of other tumor sub-types. 92
Conclusion
The methods used in the diagnosis and monitoring of cancer are sensitive but are not sufficient to overcome inherent limitations, such as the need for the large quantity of samples as a testing material. 112 These procedures are extremely invasive and potentially hazardous. 93 Traditionally, diagnosis of cancers is based on histology, morphological features identified by routine hematoxylin and eosin (H&E) staining, and the site of origin. 113 Despite these advances, a tissue sample is a required necessity for tumor tissue biopsy, excision, or another invasive procedure such as fine needle aspiration. 114 Particularly with the well-recognized difficulties in repeatedly obtaining tissue biopsies, cfDNA through liquid biopsy approach can be an effective method for cancer detection. 115 The analysis of cfDNA is a promising area of investigation that will allow interrogation of tumor-specific molecular alterations in the cfDNA. 116 Prior to this, crucial factors in the continued development of cfDNA biomarkers require addressing the technical issues regarding sample collection, processing, and molecular techniques. Thereafter, these protocols must be validated in well-designed prospective patient cohorts providing sufficient power and sample size. 90 However, the desirability of using cfDNA as a biomarker lies in its non-invasive nature and accessibility, and a combined use with previously established tumor markers (Table 2) could be the first step toward the clinical approach to improve cancer diagnosis, treatment, and minimal residual disease monitoring. 117 Furthermore, technological advances via NGS have already revolutionized the field of cancer genomics by facilitating the detection of cancer-specific alterations in KRAS, EGFR, BRAF, and PIK3CA in plasma samples of lung, breast, and colorectal cancer patients as a new and developing area of research. 114
Although biomarker discovery is a budding field, several other tumor entities still lack frequent genetic changes, accentuating the necessity for the discovery of cancer-specific signatures in improving the analytical and diagnostic sensitivity of cancer. 118 With the Food and Drug Administration (FDA)’s approval of its first liquid biopsy in lung cancer, it is time to prepare for the clinical appearance of cfDNA in various other tumor subtypes. Considering this, at present, there are more than 60 clinical trial studies involving cfDNA-based liquid biopsy approach waiting for their approval in different cancer types. 119 The clinical faith of liquid biopsies depends on the practical advantages for patients, clinicians, infrastructure, and its cost-effectiveness. At present, only specialized laboratories process cfDNA samples; although, in future, hospital laboratories may carry out analysis locally if appropriate steps in the processing of cfDNA can be established.120,121 But the key limitations in the success of liquid biopsy lack the standardization approach in preanalytical factors. 85 The blood collection procedures, collection tubes, anticoagulant, blood storage condition, blood centrifugation speed for plasma isolation, and plasma storage condition and yield are also some of the key limiting factors associated with the standardization of cfDNA into clinical practice.
However, standardized procedures in liquid biopsy approaches will probably provide improved diagnostic power, only if the preanalytical factors in blood processing and cfDNA isolation are optimized using standard operating procedures. Addressing these issues will require a common effort and collaboration of different research groups involved in the similar area of research. Further based on this review article, we recommend optimization in key factors (blood collection, plasma isolation, plasma storage, cfDNA isolation, and quantification) for blood processing and cfDNA isolation (Table 3), which will hopefully allow the widespread introduction of a minimally invasive procedure for diagnostic and prognostic applications in cancer.
Recommendations for blood processing and cfDNA isolation.
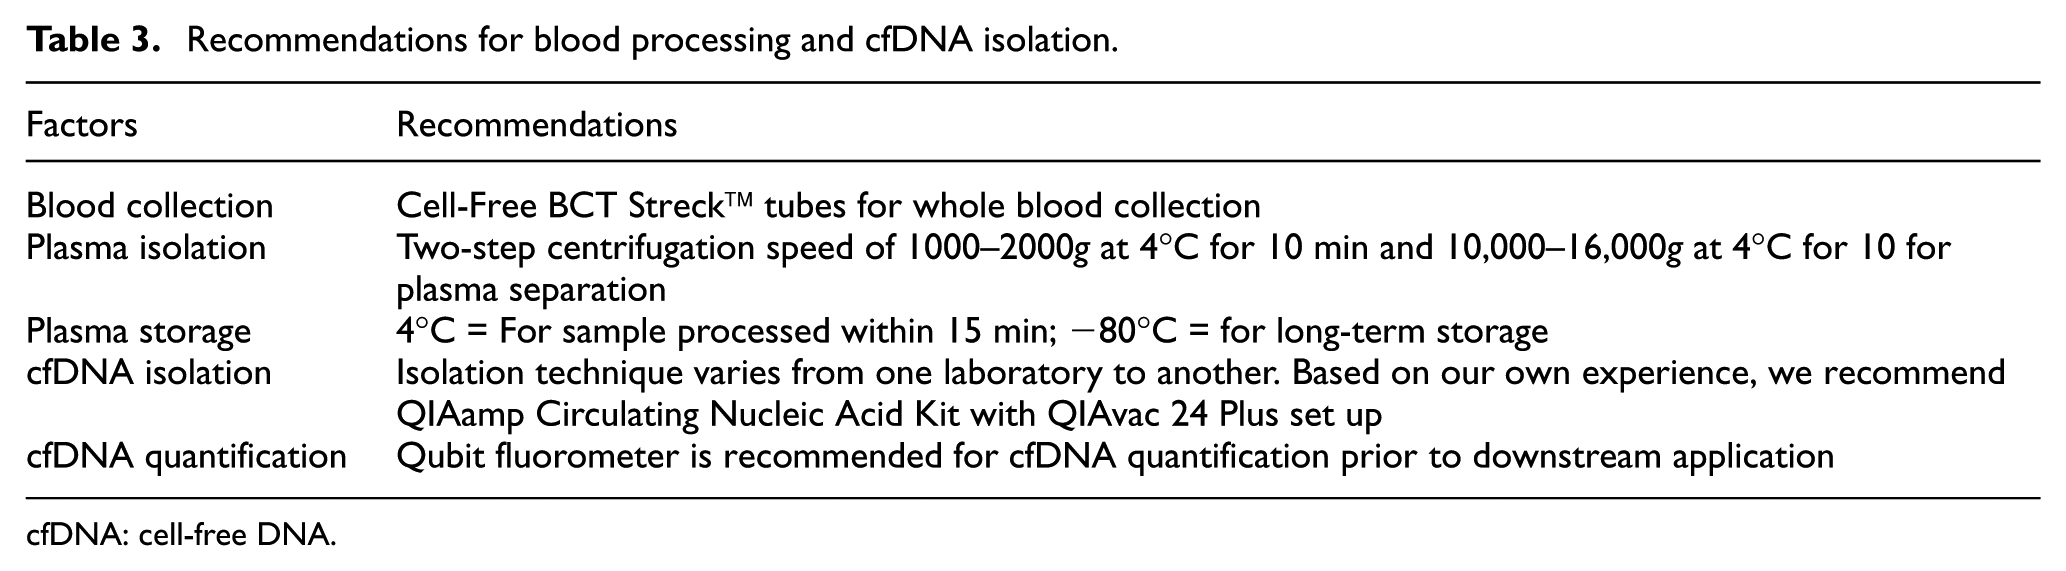
cfDNA: cell-free DNA.
Footnotes
Acknowledgements
The authors acknowledge the Department of Science and Technology, Government of India, for providing the financial support for carrying out the research in the area of liquid biopsy.
Declaration of conflicting interests
The author(s) declared no potential conflicts of interest with respect to the research, authorship, and/or publication of this article.
Funding
The author(s) received no financial support for the research, authorship, and/or publication of this article.