
Abstract
Radiation therapy is one of the choices to treat malignant tumors. In radiation therapy, existence of radiation-resistant cell is a major problem to overcome. We established clinically relevant radioresistant cells that had been obtained by exposing to 2 Gy/day X-rays for more than 30 days. These cells are resistant to 2 Gy/day X-ray exposure and anticancer agents. However, the underlying resistance mechanism remains unclear. We investigated the resistance of clinically relevant radioresistant cells to hydrogen peroxide (H2O2), confirming a degree of resistance. Neither catalase enzyme activity nor aquaporins appeared to be involved in H2O2 resistance. Mitochondrial DNA copy number, adenosine triphosphate (ATP) concentration, and plasma membrane potential were decreased. The timing of H2O2 intake was delayed and lipid peroxidation was decreased. Sensitivity of clinically relevant radioresistant cells to H2O2 was enhanced by 1-palmitoyl-2-(5′-oxo-valeroyl)-sn-glycero-3-phosphocholine administration. These results suggest that the membrane status is a major factor conferring H2O2 resistance in clinically relevant radioresistant cells, and we should further investigate how membrane status could be used to enhance the therapeutic effect on cancer.
Introduction
Nuclear DNA is thought to be the main target for ionizing radiation (IR), and of the damage it causes, DNA double-strand breaks (DSBs) are regarded as the most severe and lead to cell death. 1 The induction of DSBs is a direct effect, but almost two-thirds of radiation-induced damage is due to indirect effects, such as the production of reactive oxygen species (ROS). 2 ROS have higher reactivity than ground-state oxygen, and they can peroxidize the membrane lipids of cells and its organelles, DNA, and proteins and lead to cell death. 3 This property of ROS is exploited in the use of hydrogen peroxide (H2O2) in radiation therapy (RT) where it is used as a sensitizer, inducing apoptosis in cancer cells by generating ROS in the cancer tissues.2,4 Lipid peroxidation resulting from ROS generation in the cell membrane is important because it reacts with other cell components and affects biological process. 5
Fractionated RT for cancer has advantages over the use of a single dose of IR because it increases the anticancer therapeutic effect and decreases side effects in normal tissues.6,7 In conventional fractionated RT, approximately 2 Gy of radiation is given per day, approximately 10 Gy per week, and up to approximately 60 Gy over 6 weeks in total. 8 RT is effective against many cancer cells, but the existence of radiation-resistant cells is a major obstacle to successful clinical treatment.
Previous studies have described the establishment of radioresistant cells by fractionated X-ray;9,10 however, the dose administered was higher than that used in RT. Wei et al. 9 established radiation-resistant lung cancer cells with a total dose of 52 Gy (eight doses of 6.5 Gy). Ogawa et al. 10 established radioresistant pancreatic cancer cells with an exposure of 10 Gy/day at 2-week intervals. To investigate the molecular mechanisms of radioresistance in cancer cells, we established radioresistant cell lines by step-wise fractionated X-ray exposure.11–14 Established cells are exposed to 2 Gy X-rays per day for at least a month, inducing radiation resistance. Because the dose given is the same as that used in RT, we named the established cells “clinically relevant radioresistant (CRR)” cells. 11 CRR cells show low levels of DNA DSBs after IR exposure, 11 have low mitochondrial membrane potential, and have low mitochondrial superoxide production. 15 In addition, they show resistance not only to IR but also to docetaxel, an ability that is possibly connected with the level of mitochondrial ROS production. 15 Furthermore, DNA array analysis shows higher expression of guanine nucleotide-binding protein 1 (GBP1) in CRR cells than in parental cells. CRR cells in which GBP1 has been knocked down by small interfering RNA (siRNA) lose radioresistance in cell culture and in xenograft. 16 Treatment with everolimus, a mammalian target of rapamycin (mTOR) inhibitor, cancels the IR resistance properties of CRR. 13 Moreover, the autophagy inducer rapamycin increases the radiosensitivity of CRR cells; the autophagy inhibitor 3-methyladenine induces radiation resistance in parental cells. 17 These results point to a relationship between radiation resistance and the autophagy pathway and indicate that the mechanism of radioresistance in CRR cells is being elucidated.
However, despite the importance of H2O2 in cancer therapy, the mechanism of resistance to H2O2 in CRR cells has not been investigated to date. We have investigated the effects of H2O2 on CRR cells and considered the H2O2 resistance mechanism. Results show that the plasma membrane is a target of H2O2 and that plasma membrane status is more important than internal oxidative stress–scavenging enzyme activity in CRR cells.
Materials and methods
Cell culture
Human cervical cancer (HeLa) and oral squamous cell carcinoma (SAS) cell lines were obtained from the Cell Resource Center for Biomedical Research, Institute of Development, Aging and Cancer, Tohoku University. CRR cells were established by exposing the cells to gradually increasing doses of X-rays (0.5–2 Gy).9–11 Cells were maintained in Roswell Park Memorial Institute (RPMI) 1640 medium (Nacalai Tesque Inc., Kyoto, Japan) supplemented with 5% fetal bovine serum (Gibco Invitrogen Corp., Carlsbad, CA, USA) in a humidified atmosphere at 37°C with 5% CO2. Exponentially growing cells were used in all experiments.
Cell survival assay
The effect of H2O2 on cell proliferation was analyzed by water-soluble tetrazolium salt (WST) assay using Cell Count Reagent SF (Nacalai Tesque Inc., Kyoto, Japan) according to the manufacturer’s protocol. Briefly, 5 × 10³ cells growing exponentially were plated in a 96-well plate 24 h before experiments. Cells were incubated for 48 h in RPMI 1640 medium containing H2O2. Subsequently, 10 μL of Cell Counter Reagent SF was added to each well and the optical density of each well was determined in a microplate reader (model Multiskan JX; Thermo Fisher Scientific Inc., Waltham, MA., USA). Each procedure was performed in triplicate.
DNA and RNA extraction for quantitative polymerase chain reaction
Genomic DNA containing mitochondrial DNA was extracted by phenol extraction. 18 Ten nanograms of DNA was used for quantitative polymerase chain reaction (QPCR) to detect nuclear genomic DNA and mitochondrial DNA. Total RNA was isolated from cells by ISOGEN (Nippon Gene, Toyama, Japan) according to the manufacturer’s protocol. DNA and RNA quality were checked by absorbance at 260 nm and electrophoresis. All complementary DNAs (cDNAs) were prepared by reverse transcription of 1 µg total RNA using oligo dT (20) primer (0.4 µM/50 µL final volume) and ReverTra Ace (TOYOBO CO Ltd., Osaka, Japan) according to the manufacturer’s protocol. After 10-fold dilution in Tris-EDTA (TE), 0.5 µL of cDNA (equivalent to 1 ng of total RNA) was used for QPCR. The QPCR reactions were performed with Step One Plus (Applied Biosystems, Foster City, CA, USA) using TUNDERBIRD qPCR Mix (TOYOBO). β-actin was used as the control. To amplify catalase and ND1, one cycle of denaturation (95°C, 10 min) was performed, followed by 40 cycles of amplification (95°C for 10 s, 55°C for 30 s, 72°C for 40 s). To amplify ATP1A1 (plasma membrane Na+/K+ transporting subunit alpha 1 gene), ATP2B1 (plasma membrane Ca2+ transporting 1 gene), GPx1, GPx4, AQP8 (aquaporin 8), and MnSOD (manganese superoxide dismutase), one cycle of denaturation (95°C, 10 min) was performed, followed by 40 cycles of amplification (95°C for 10 s, 60°C 60 s). Each experiment was performed in triplicate. The primer sequences used in this experiment are listed in Table 1.
Primer sequences used in this study.

Catalase activity
Catalase activity was measured using the Catalase Assay Kit (Sigma-Aldrich, St Louis, MO, USA) according to the manufacturer’s protocol. Briefly, 5 µL of 5 × 10³ cells was mixed with 1× assay buffer (50 mM potassium phosphate buffer, pH 7.0) and adjusted to 75 µL. Samples were then incubated with 25 µL of 200 mM H2O2 solution. After 5-min incubation, 10 µL of reaction mixture was removed and mixed with 1 mL of Color Reagent. After color development, A520 was measured by Ultrospec 2100 pro (GE Healthcare, Chicago, IL, USA) and the remaining H2O2 amount was calculated. Each procedure was performed in triplicate.
ATP concentration
ATP concentration in CRR cells was measured using the adenosine 5′-triphospate (ATP) bioluminescent somatic cell assay kit (Sigma-Aldrich) according to the manufacturer’s protocol. Bioluminescence was detected using a Mithras LB940 microplate reader (Berthold Technologies GmbH & Co. KG, Bad Wildbad, Germany). Each procedure was performed in triplicate.
Measurement of plasma membrane potential and internal H2O2
Plasma membrane potential was measured using bis-(1,3-dibutylbarbituric acid) trimethine oxonol sodium salt (DiBAC4(3)) (Dojindo, Kumamoto, Japan), and internal H2O2 was visualized using HYDROP (Goryo Chemical Inc., Hokkaido, Japan) as reported previously. 19 Cells on glass-bottomed dishes (Matsunami Glass Ind., Ltd., Osaka, Japan) were treated with 5 µM DiBAC4(3) for 10 min at 37°C or with 2.5 µM HYDROP for 20 min at 37°C. After incubation, dyes were washed out and fluorescence images were obtained using BZ-8000 fluorescence microscope (KEYENCE Corporation, Osaka, Japan). Fluorescence intensities were measured using ImageJ (Rasband, W.S., ImageJ, U.S. National Institutes of Health, Bethesda, Maryland, USA; http://rsb.info.nih.gov/ij/, 1997–2012.)
Intracellular uptake of H2O2 using a stable isotope
H2O218O2 solution (Sigma-Aldrich) was used to detect intracellular uptake of H2O2. Cells were exposed to 50 µM H2O218O2 solution for 2 h. After treatment, cells were washed with PBS three times. After washing, cells were collected in 2 mL tubes and freeze-dried in an FDU-2200 freeze drier (Tokyo Rikakikai Co, Ltd, Tokyo, Japan) for 3 h. Dried samples were sent to Taiyo Nippon Sanso Corporation and the 18O2 content in treated cells was analyzed using a stable isotope ratio mass spectrometer. Results were shown as delta ‰ compared to Standard Mean Ocean Water (18Oδ SMOW ‰). Each procedure was performed in triplicate.
Detection of AQP8 mutation
AQP8 amplification was performed using 5 µM primer, 2 ng of the template cDNA, 250 µM of dNTP Mix, 1× Ex-Taq buffer, and 1 U of Ex-Taq DNA polymerase. To amplify AQP8 gene, one cycle of denaturation (95°C, 2 min) was performed, followed by 40 cycles of amplification (95°C for 10 s, 55°C 10 s, 72°C 30 s). The PCR products were purified and sequenced with BigDye Terminator v3.1 Cycle Sequencing Kit (Thermo Fisher Scientific) according to the manufacturer’s protocol. After the reaction, AQP8 sequence was determined by Applied Biosystems 3100-Avant Generic Analyzer (Thermo Fisher Scientific). The primer sequences of AQP8 are listed in Table 1.
Detection of mitochondrial superoxide
To detect mitochondrial superoxide, MitoSOX (Thermo Fisher Scientific) staining was conducted. Cells were cultured in glass-bottomed dishes, and 5 µM of MitoSOX with Microscope observation (MIC) buffer (130 mM NaCl, 5.3 mM KCl, 0.8 mM MgSO4, 1 mM Na2HPO4, 2 mM glucose, 20 mM HEPES, 1 mM sodium pyruvate, 2.5 mM NaHCO3, 1 mM ascorbic acid, 1.5 mM CaCl2, and 1.5 mg/mL bovine serum albumin (BSA)) was added to the cells. After 10-min incubation at 37°C, MitoSOX with MIC buffer was removed and fluorescence images were obtained using BZ-8000 fluorescence microscope (KEYENCE Corporation).
Measurement of iron-related gene expression and total iron amount
To investigate the involvement of iron in response to H2O2 treatment, gene expression of transferrin receptor, ferritin, and mitoferrin was measured by QPCR. PCR conditions were as follows: one cycle of denaturation (95°C for 10 min) was performed, followed by 40 cycles of amplification (95°C for 10 s, 60°C for 60 s). The primer sequences of iron-related genes are listed in Table 1. The total iron amount in CRR cells was measured using Metalloassay kit (Ferrozine method) according to the manufacturer’s protocol (MG Metallogenics Co., Ltd, Chiba Japan). The optical density of each well was determined in a microplate reader (model Multiskan JX; Thermo Fisher Scientific). Each procedure was performed in triplicate.
Detection of visualized internal hydroxyl radical
Internal hydroxyl radical was detected by HPF (hydroxyphenyl fluorescein: Goryo Chemical Inc.) according to the manufacturer’s protocol with slight modification. About 10 µM of HPF with MIC buffer was added to the cells in glass-bottomed dishes. After 15-min incubation at 37°C, HPF with MIC buffer was removed and fluorescence images were obtained using BZ-8000 fluorescence microscope. Each procedure was performed in triplicate.
Detection of lipid peroxidation using 4-hydroxy-2-nonenal antibody
One of the major membrane lipid peroxidation products, 4-hydroxy-2-nonenal (HNE), was detected using HNE antibody (Japan Institute for the Control of Aging: JaICA, Shizuoka, Japan). Cells grown on glass-bottomed dishes were fixed with 4% formaldehyde in phosphate-buffered saline (PBS) for 30 min and rinsed three times with PBS. Plasma membranes were permeabilized by incubation in 95% ethanol with 5% acetic acid for 10 min. After washing five times with PBS, cells were incubated for 30 min in blocking solution (1% BSA in phosphate-buffered saline with Tween 20 (PBST)). Anti-HNE monoclonal antibody was used as a first antibody (dilution factor: 1:200) and Alexa Fluor 488 goat anti-mouse IgG (Thermo Fisher Scientific) was used as a second antibody (dilution factor: 1:200).
Administration of oxidized lipid
To examine whether membrane status at different degrees of lipid peroxidation was involved in oxidative stress tolerance, 50 µM of 1-palmitoyl-2-(5′-oxo-valeroyl)-sn-glycero-3-phosphocholine (POVPC; Avanti Polar Lipids Inc, Alabaster, AL, USA), the oxidized lipid, was administrated to the cultured medium by ethanol injection method. 20 This lipid has been shown to localize to the plasma membrane after administration to the cultured medium.21,22 Briefly, POVPC was dissolved in EtOH (20 mM). The solution was diluted to the appropriate concentration with RPMI 1640 (but without phenol red and 0.1% fetal bovine serum (FBS)). After 10-min treatment, POVPC was removed and cells were treated with H2O2 for 48 h. Cell survival was analyzed by WST assay using CCK-8 assay kit (Dojindo) as described previously. 22 Each procedure was performed in triplicate.
Statistical analysis
One-way analysis of variance (ANOVA) with Scheffe’s F-test was performed for the WST assay. All other statistical analyses were performed using Student’s t-test. All p values less than 0.01 were considered to be statistically significant. Results were expressed as means ± standard error (SE).
Results
Sensitivity of CRR cells to H2O2 and catalase status
Both CRR cell lines were significantly more resistant to H2O2 than their corresponding parental tumor cell lines. In brief, the observed viabilities of the HeLa parent and HeLa CRR cells were 0.32 and 0.70 with 25 µM H2O2 and were 0 and 0.31 with 50 µM H2O2, respectively (p < 0.01; Figure 1(a)). The observed viabilities of the SAS parent and SAS CRR cells were 0.30 and 0.51 with 25 µM H2O2 and were 0 and 0.20 with 50 µM H2O2, respectively (p < 0.01; Figure 1(b)). The half-maximal inhibitory concentration (IC50) values for H2O2 for HeLa parent and HeLa CRR were approximately 20 and 37 µM, respectively, and for SAS parent and SAS CRR were approximately 20 and 25 µM, respectively.
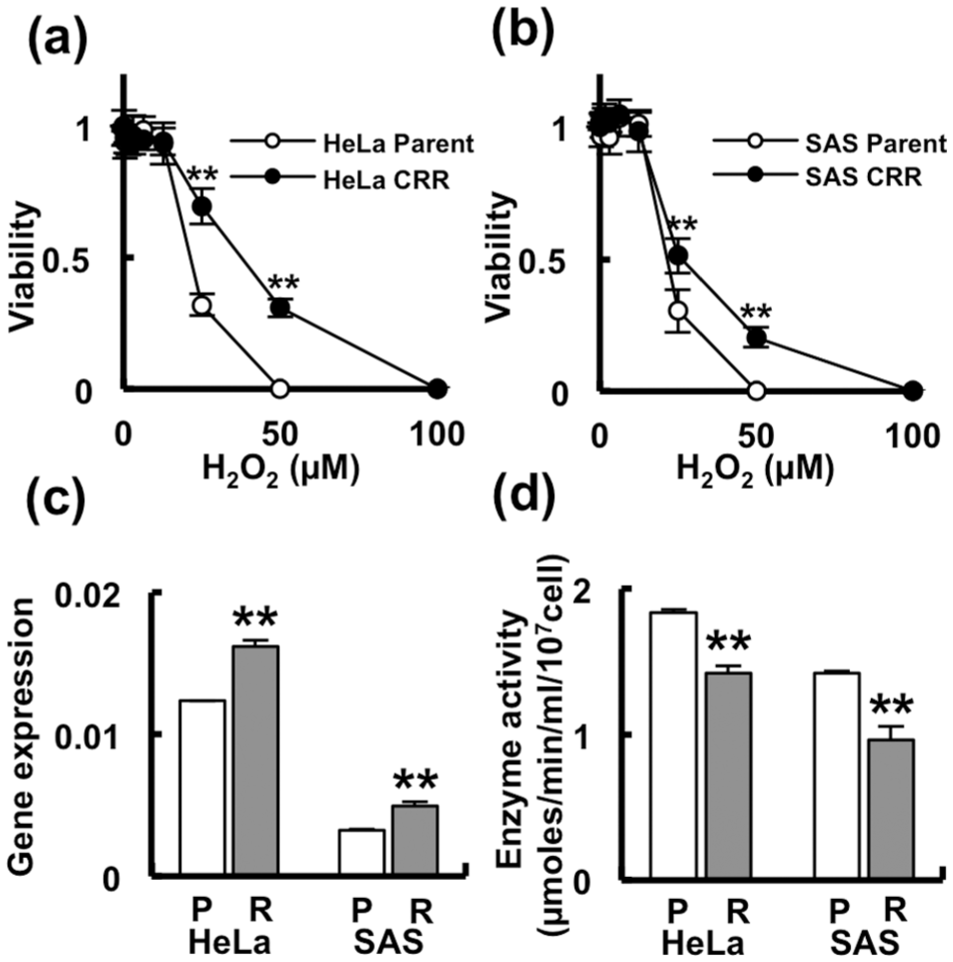
CRR cells were resistant to H2O2 but did not show high catalase enzyme activity compared with the parental cells. (a) and (b) Viability of CRR cells from HeLa and SAS cell lines treated with H2O2: (a) HeLa parent versus HeLa CRR cells and (b) SAS parent versus SAS CRR cells. Both CRR cell lines were significantly resistant to H2O2 at concentrations >25 µM. **p < 0.01. (c) Catalase gene expression and (d) catalase enzyme activity. Catalase gene expression was upregulated in CRR cells but enzyme activity was downregulated in CRR cells. **p < 0.01.
The expression of the catalase gene was higher in CRR cells than in parental cells. The expression ratios of the HeLa parent and HeLa CRR cells were 1.24 × 10⁻² and 1.62 × 10⁻² and those of the SAS parent and SAS CRR cells were 3.25 × 10⁻³ and 4.92 × 10⁻³, respectively (p < 0.01; Figure 1(c)). Catalase activity was lower in CRR cells than in parental cells, despite higher H2O2 resistance phenotype. The enzyme activity values were 1.84, 1.42, 1.42, and 0.96 in HeLa parent, HeLa CRR, SAS parent, and SAS CRR cells, respectively (p < 0.01; Figure 1(d)).
Mitochondrial DNA copy number, ATP concentration, and ATPase expression
The mitochondrial DNA (mtDNA) copy number was significantly lower in CRR cells. The mtDNA copy numbers were 436 in the HeLa parent and 212 in the HeLa CRR cells and were 197 in the SAS parent and 121 in the SAS CRR cells (p < 0.01; Figure 2(a)). The ATP concentration was significantly lower in CRR cells compared with that in their parental cells. The ATP concentrations were 1.04 × 10⁻¹⁴ mol/cell in the HeLa parent and 7.52 × 10⁻¹⁵ mol/cell in the HeLa CRR cells. The corresponding values were 9.21 × 10⁻¹⁵ mol/cell in the SAS parent and 8.04 × 10⁻¹⁵ mol/cell in the SAS CRR cells (p < 0.01; Figure 2(b)). Next, we investigated the gene expression of ATP1A1 and ATP2B1. These genes are involved in ion gradients within and outside the cell. These gene expressions were upregulated in CRR cells, except for ATP2B1 expressions in SAS cells. The ATP1A1 gene expression in SAS cells tended to be upregulated without statistical significance. The ATP1A1 gene expression ratios of the HeLa parent and HeLa CRR cells were 0.10 and 0.14, respectively (p < 0.01) and those of the SAS parent and SAS CRR cells were 1.68 and 1.78, respectively (p = 0.26; Figure 2(c)). The ATP2B1 gene expression ratio of the HeLa parent and HeLa CRR cells were 1.79 × 10⁻² and 2.88 × 10⁻², respectively, and those of the SAS parent and SAS CRR cells were 0.18 and 0.08, respectively (p < 0.01; Figure 2(d)).

Mitochondrial DNA copy number, ATP production, and ATPase gene expression: (a) mtDNA copy number expressed as the gene expression of ND1 and β-actin ratio and (b) ATP concentration of CRR and parental cells. A significant decrease in mtDNA copy number and ATP concentration was seen in CRR cells. (c) and (d) Gene expression in CRR and parental cells: (c) ATP1A1 (plasma membrane Na+/K+ transporting subunit alpha 1 gene) and (d) ATP2B1 (plasma membrane Ca2+ transporting 1 gene). ATPase gene expression was upregulated in HeLa CRR cells but not in SAS CRR cells. Results are given as mean ± SE.
Plasma membrane potential
DIBAC4(3) treatment results showed significantly lower plasma membrane potential (as indicated by fluorescence intensity) in CRR cells in comparison with parental cells in both HeLa and SAS cell lines. The plasma membrane potential ratio of the HeLa CRR and HeLa parent cells was 0.76 and that of the SAS CRR and SAS parent cells was 0.64 (p < 0.01; Figure 3(e)). The sample sizes were 336 in the HeLa parent, 154 in the HeLa CRR, 117 in the SAS parent, and 55 in the SAS CRR cells.

Plasma membrane potential detected by DiBAC4(3) dye. (a) HeLa parental cells, (b) SAS parental cells, (c) HeLa CRR cells, (d) SAS CRR cells, and (e) relative fluorescence intensity of plasma membrane equating to relative plasma membrane potential. In CRR cells, the plasma membrane potential was significantly lower than that in parental cells. Results are given as mean ± SE.
Internal H2O2 measurement
Fluorescence microscopy results following treatment with H2O2 showed that parental cells from both HeLa and SAS cell lines had significant increases in internal H2O2 in comparison with the controls, whereas internal levels in CRR cells reduced in comparison with the controls, with significant decreases in SAS CRR. The relative HYDROP intensity increased 1.60 times in HeLa and 1.23 times in SAS parent cells after H2O2 treatment (p < 0.01; Figure 4(i) and (j)). The relative HYDROP intensity was 0.97 in HeLa (p = 0.38) and 0.94 in SAS CRR (p = 0.03) cells after H2O2 treatment (Figure 4(i) and (j)). The sample sizes were 634 in the HeLa parent control, 368 in HeLa parent 2 h, 564 in HeLa CRR control, 273 in HeLa CRR 2 h, 119 in SAS parent control, 204 in SAS parent 2 h, 247 in SAS CRR control, and 201 in SAS CRR cells.

Internal H2O2 amount and intracellular uptake of H2O2. (a)–(h) Fluorescence images of HYDROP. Cells were treated with 50 µM H2O2 for 2 h. (a) Control HeLa parental cells, (b) hydrogen peroxide–treated HeLa parental cells, (c) control SAS parental cells, (d) hydrogen peroxide–treated SAS parental cells, (e) control HeLa CRR cells, (f) hydrogen peroxide–treated HeLa CRR cells, (g) control SAS CRR cells, (h) hydrogen peroxide–treated SAS CRR cells, and (i) and (j) relative fluorescence intensities (equating to relative H2O2 concentrations) after H2O2 treatment in HeLa and SAS, respectively. Internal H2O2 concentration increased in parental cells but not in CRR cells. Results are given as mean ± SE. **p < 0.01; *p < 0.05. (k) Intracellular uptake of H2O2 by stable isotope. Cells were subjected to 50 µM of H2O2 18O2 solution and the 18O2 content in treated cells was analyzed using stable isotope ratio mass spectrometer. In HeLa cells, there was no significant difference in uptake between CRR and parental cells. In SAS cells, uptake was significantly less in CRR cells than in parental cells. Results are given as mean ± SE. **p < 0.01.
Intracellular uptake of H2O2
Results from treatment with 18O2-labeled H2O2 showed that, in HeLa cells, there was no significant difference in uptake between CRR cells and parental cells. The 18Oδ SMOW ‰ of the HeLa parent and CRR cells was 18.4 and 18.6, respectively (p = 0.56; Figure 4(k)). The uptake in SAS CRR cells was significantly lower than in parental cells. The 18Oδ SMOW ‰ of SAS parent and CRR was 25.7 and 19.0, respectively (p < 0.01; Figure 4(k)).
AQP8 mutation and AQP8 gene expression
AQP8 gene sequencing was performed to detect C53S mutation that had been shown to be resistant to H2O2 treatment. 23 AQP8 gene sequencing showed no evidence of C53S mutation in either CRR or parental cells (Figure S2(a)–(d)). Results also showed that AQP8 gene expression was downregulated in CRR cells. The expression ratios of HeLa parent and HeLa CRR cells were 5.24 × 10⁻⁵ and 6.54 × 10⁻⁶ (p < 0.01; Figure S2(e)) and those of the SAS parent and SAS CRR cells were 3.75 × 10⁻⁵ and 5.48 × 10⁻⁶, respectively (p < 0.01, Figure S2(e)).
Superoxide production in mitochondria in HeLa cells
Since hydrogen peroxide uptake did not change in either HeLa parent or CRR cells after H2O2 treatment but internal H2O2 did increase in HeLa parent cells, we investigated mitochondrial superoxide production. Results showed higher mitochondrial superoxide production in HeLa parental cell (Figure S3(a) and (b)). Investigation of the gene expression for MnSOD in HeLa cells showed that it was upregulated in parental cells compared with CRR cells. The expression ratios of the parent and CRR cells were 4.47 × 10⁻³ and 3.65 × 10⁻³, respectively (p < 0.01; Figure S3(c)).
Expression of iron-related genes and total iron amount
Higher transferrin receptor and ferritin gene expression was observed in CRR cells. The ratios of transferrin of receptor gene expression in the HeLa parent and HeLa CRR cells were 1.02 × 10⁻² and 2.53 × 10⁻² (p < 0.01) and those in the SAS parent and CRR cells were 4.11 × 10⁻³ and 4.99 × 10⁻³, respectively (p < 0.01; Figure S4(a)). The ratios of ferritin gene expression in the HeLa parent and HeLa CRR cells were 0.39 and 1.08 (p < 0.01) and those in the SAS parent and CRR cells were 0.09 and 0.35 (p < 0.01; Figure S4(b)). Mitoferrin expression decreased. The mitoferrin gene expression ratios of the HeLa parent and HeLa CRR cells were 1.02 × 10⁻² and 5.81 × 10⁻³ (p < 0.01) and those of the SAS parent and CRR cells were 6.85 × 10⁻³ and 3.99 × 10⁻³ (p < 0.01; Figure S4(c)). There was no difference in total iron in parental and CRR cells. The total iron levels were 2.67 × 10⁻⁶ µg/µg protein in HeLa parent and 2.76 × 10⁻⁶ µg/µg protein in HeLa CRR cells (p = 0.62) and 2.55 × 10⁻⁶ µg/µg protein in SAS parent and 2.44 × 10⁻⁶µg/µg protein in SAS CRR cells (p = 0.71; Figure S4(d)).
Internal hydroxyl radical production
Results from HPF treatment revealed higher levels of internal hydroxyl radical in HeLa and SAS parental cells compared with CRR cells. The relative intensity of HPF fluorescence was increased 1.67 times in HeLa and 1.22 times in SAS parent cells (p < 0.01; Figure S5). The sample sizes were 390 in HeLa parent, 190 in HeLa CRR, 65 in SAS parent, and 65 in SAS CRR cells.
Lipid peroxidation after H2O2 treatment
Following peroxide treatment, the amount of lipid peroxidation increased in both HeLa and SAS parent cells but not in CRR cells from either. The relative intensity of HNE staining was increased 1.96 times in HeLa and 2.05 times in SAS parent cells after H2O2 treatment (p < 0.01). The relative intensity of HNE staining in HeLa CRR and SAS CRR cells was 0.92 and 1.02 times, respectively (p = 0.02 and p = 0.43, respectively; Figure 5). The sample sizes were 307 in HeLa parent control, 543 in HeLa parent 2 h, 388 in HeLa CRR control, 250 in HeLa CRR 2 h, 552 in SAS parent control, 486 in SAS parent 2 h, 340 in SAS CRR control, and 349 in SAS CRR 2 h cells.

Detection of lipid peroxidation using HNE antibody. Immunofluorescence images of HNE are shown in (a)–(h). (a) Control HeLa parental cells, (b) hydrogen peroxide–treated HeLa parental cells, (c) control SAS parental cells, (d) hydrogen peroxide–treated SAS parental cells, (e) control HeLa CRR cells, (f) hydrogen peroxide–treated HeLa CRR cells, (g) control SAS CRR cells, (h) hydrogen peroxide–treated SAS CRR cells, and (i) and (j) relative intensities of HNE (equating to lipid peroxidation level) after H2O2 treatment in HeLa and SAS cell lines, respectively. Peroxidation increased in parental cells only. Results are given as mean ± SE.
Cell sensitivity to H2O2 following treatment with oxidized lipid POVPC
Administration of the oxidized lipid POVPC significantly increased sensitivity of CRR cells to subsequent treatment with H2O2 increasing cell death. The viabilities of HeLa CRR H2O2 and HeLa CRR H2O2 + POVPC cells were 0.44 and 0.07, respectively (p < 0.01 vs control and vs H2O2 treatment) and were 0.37 in SAS CRR H2O2 and 0.03 in SAS CRR H2O2 + POVPC cells (p < 0.01 vs control and vs SAS CRR H2O2 + POVPC; Figure 6).

Oxidized lipid enhances cell death by H2O2 treatment. H2O2 (50 µM) treatment was performed after 50 µM of POVPC administration. Administration of oxidized lipid enhanced the H2O2 sensitivity in CRR cell.
Discussion
In the present study, we have shown that CRR cells are significantly more resistant to H2O2 than their parental cells (Figure 1(a) and (b)). However, catalase activity in CRR cells was not upregulated (Figure 1(c) and (d)). Since glutathione peroxidases (GPXs) are known to be essential components for the elimination of H2O2 in cells, 24 we investigated their gene expression by QPCR (Figure S1), finding that GPX expression did not show a common tendency between parent and CRR cells. These results suggest that internal ROS scavenging activity, such as via catalase activity, may not be a major factor in H2O2 resistance in CRR cells.
Mitochondrial DNA copy number and ATP concentration were lower in CRR than in parental cells (Figure 2(a) and (b)). It has been reported that a low mtDNA copy number in laryngeal cancer patients is associated with poor prognosis, 25 an observation that shows a possible connection between low mtDNA copy number and resistance to anticancer reagents. The decrease we found in mitochondrial membrane potential and superoxide production in CRR cells (Figure S2) is in agreement with a previous study 14 and suggests that mitochondrial dysfunction in CRR cells could cause a reduction in ATP, influencing ion gradient formation. In this study, ATPase expression differed between parental and CRR cells (Figure 2(c) and (d)), and membrane potential was lower in CRR cells than in parental cells (Figure 3). These results indicate that mitochondrial dysfunction could lead to an alternate status of the cell membrane via Na+/K+- and Ca2+-ATPase hypofunction, due to the paucity of ATP in CRR cells.
It has been reported that ATP signaling induces ROS such as H2O2 via membrane-bound NADPH oxidase. 26 The decrease in cell membrane potential might lead to reduced reactivity against external stress, such as oxidative stress, leading to resistance to H2O2 in CRR cells. Indeed, the internal H2O2 concentration in CRR cells did not increase even after 2-h exposure in our experiments (Figure 4), while intracellular H2O2 increased in parent cells following the same treatment. To investigate whether exogenous H2O2 is actually taken into the cell, we examined the intake of H2O2 used by stable isotope. Although uptake of H2O2 was seen in both parental and CRR cells, the amount taken in by CRR cells was not higher than control cells after 2-h treatment; H2O2 uptake was significantly lower in SAS CRR versus parent cells, while no significant difference was seen between HeLa parent and CRR cells (Figure 5).
AQP in plasma membranes function as water channels, 27 and it has been shown that AQP 1, 3, 8, and 9 permit the passage of H2O2.23,28–30 When the C53S mutation is observed in AQP8, the intake of H2O2 decreases, and it has been reported that this mutation is involved in resistance to oxidative stress. 23 In this study, we looked for the presence of the AQP8 C53S mutation in CRR cells, but results were negative (Figure S2). The AQ8 gene expression pattern in CRR cells was downregulated compared with parental cells (Figure S2). Lipid peroxidation in the cell membrane showed a significant increase after 2 h of H2O2 treatment in control cells, but in CRR cells there was almost no increase (Figure 5). From these results, it is considered that H2O2 resistance in CRR cells involves a difference in reactivity of the cell membrane itself rather than a change in AQP, a cell membrane constituent protein. It could be that the reactivity in the CRR cell membrane is lower than in parent cells, explaining the reduced inflow of H2O2 into the cell compared to parental cells. In addition, the parent cells may facilitate intracellular H2O2 production induced by external H2O2; an increase in intracellular ROS is observed in human embryonic palatal mesenchymal cells, peripheral blood lymphocytes, 31 and spinal cord neurons. 32 In this study, intracellular H2O2 production in HeLa parent cells might be greater than that in CRR cells; indeed, superoxide production in parent cell mitochondria was greater than that in CRR cells (Figure S3). We found that MnSOD gene expression was higher in HeLa parent cells than in HeLa CRR cells (Figure S3(c)). This led to increased H2O2, increased hydroxyl radicals, and increased lipid peroxidation in the HeLa parental cells (Figure 5).
Recently, ferroptosis, a type of cell death dependent on free iron, hydroxyl radicals, and lipid peroxidation, has been reported.33–35 Our data show that expression of the transferrin receptor and the ferritin gene is lower in parent cells than in CRR cells (Figure S4), possibly suggesting increased internal free iron. Moreover, hydroxyl radical in parent cells was higher than in CRR cells (Figure S5). These data indicate the possibility that endogenously produced H2O2 might be immediately converted to the hydroxyl radical via Fenton’s reaction in HeLa parent cells, leading to increased lipid peroxidation (although in this study using stable isotope H2O2 we could not detect significant differences between HeLa parent and CRR cells). In addition, in SAS CRR cell, it is suggested that lipid peroxidation in the cell membrane is lower than in parent cells and the H2O2 uptake of SAS CRR cells is lower (Figure 4(k)). Therefore, SAS CRR cells would show lower H2O2 sensitivity than SAS parent cells. As a result, plasma membrane lipid peroxidation would be suppressed in CRR cells, and one might expect to see resistance to H2O2. In fact, in this study, administration of 50 µM POVPC enhanced H2O2 sensitivity in both CRR cell lines (Figure 6); this contrasts with a report that a 25-µM concentration of POVPC had little effect on necrosis in melanoma cell lines. 21 Taken together, our data suggest that the difference in external H2O2 sensitivity may depend mainly on membrane lipid peroxidation, which may enhance intracellular H2O2 production. Therefore, oxidized lipids such as POVPC would be potential pharmaceutical candidates against cancer cells that show resistance to anticancer treatments.
The maintenance of plasma membrane status, rather than intracellular ROS scavenging enzyme activity, may be an important factor for tolerance by cells to external oxidative stress. If so, then alteration of membrane status could lead to changes in external oxidative stress tolerance. This may be a key factor in enhancing the effects of anticancer agents, potentially overcoming the difficulties presented by CRR cells, a major problem in cancer therapy.
Supplemental Material
Supplemental_material_Tumor_Biology_(rev1-1) – Supplemental material for Clinically relevant radioresistant cells exhibit resistance to H2O2 by decreasing internal H2O2 and lipid peroxidation
Supplemental material, Supplemental_material_Tumor_Biology_(rev1-1) for Clinically relevant radioresistant cells exhibit resistance to H2O2 by decreasing internal H2O2 and lipid peroxidation by Kazuo Tomita, Yoshikazu Kuwahara, Yuko Takashi, Kento Igarashi, Taisuke Nagasawa, Hideki Nabika, Akihiro Kurimasa, Manabu Fukumoto, Yoshihiro Nishitani and Tomoaki Sato in Tumor Biology
Footnotes
Acknowledgements
The authors would like to thank Enago (![]() ) for the English language review. Tomoaki Sato conceived and supervised the study; Kazuo Tomita, Yoshikazu Kuwahara, Hideki Nabika, Akihiro Kurimasa, Manabu Fukumoto, Yoshihiro Nishitani, and Tomoaki Sato designed experiments; Kazuo Tomita, Yoshikazu Kuwahara, and Yuko Takashi performed experiments; Kento Igarashi and Taisuke Nagasawa analyzed the data; Kazuo Tomita and Tomoaki Sato wrote the manuscript. Kazuo Tomita and Yoshikazu Kuwahara contributed equally to this work
) for the English language review. Tomoaki Sato conceived and supervised the study; Kazuo Tomita, Yoshikazu Kuwahara, Hideki Nabika, Akihiro Kurimasa, Manabu Fukumoto, Yoshihiro Nishitani, and Tomoaki Sato designed experiments; Kazuo Tomita, Yoshikazu Kuwahara, and Yuko Takashi performed experiments; Kento Igarashi and Taisuke Nagasawa analyzed the data; Kazuo Tomita and Tomoaki Sato wrote the manuscript. Kazuo Tomita and Yoshikazu Kuwahara contributed equally to this work
Declaration of conflicting interests
The author(s) declared no potential conflicts of interest with respect to the research, authorship, and/or publication of this article.
Funding
The author(s) disclosed receipt of the following financial support for the research, authorship, and/or publication of this article: This work was supported by a Grant from the Kodama Memorial Fund for Medical Research to Kazuo Tomita and JSPS KAKENHI (Grant-in Aid for Scientific Research C: No. 16K11513 to Kazuo Tomita; 16K00538 to Yoshikazu Kuwahara).
References
Supplementary Material
Please find the following supplemental material available below.
For Open Access articles published under a Creative Commons License, all supplemental material carries the same license as the article it is associated with.
For non-Open Access articles published, all supplemental material carries a non-exclusive license, and permission requests for re-use of supplemental material or any part of supplemental material shall be sent directly to the copyright owner as specified in the copyright notice associated with the article.