
Abstract
Human testis, gonocytes, and adult germ cells mainly express estrogen receptor beta, and estrogen receptor beta loss is associated with advanced tumor stage; however, the molecular mechanisms of estrogen receptor beta–protective effects are still to be defined. Herein, we provide evidence that in human seminoma TCam-2 cells, E2 through estrogen receptor beta upregulates the mitochondrial deacetylase sirtuin-3 at protein and messenger RNA levels. Specifically, E2 increases sirtuin-3 expression through a transcriptional mechanism due to the occupancy of sirtuin-3 promoter by estrogen receptor beta, together with the transcription factor Sp1 as evidenced by Chip reChIp assay. This complex binds to a GC cluster located between −128 bp/+1 bp and is fundamental for E2 effects, as demonstrated by Sp1 small interfering RNA studies. Beside, after 24 h, E2 stimulus significantly increased activities of superoxide dismutase and catalase to scavenge reactive oxygen species produced by 30 min of E2 stimulus. In summary, this article indicates a novel functional interplay between estrogen receptor beta and sirtuin-3 counteracting reactive oxygen species production in TCam-2 cells. Our findings thus show that an important tumor-suppressive pathway through estrogen receptor beta is target of E2, actually proposing a distinctive protecting action against seminoma. Future studies may lead to additional strategies for the current therapy of seminoma.
Introduction
Testicular germ cell tumors (TGCTs) represent the most common invasive malignant tumors in young male that arise from blocking in maturation of primordial germ cells.1–3 The most widely accepted model of TGCTs development proposes a tumorigenic event in utero followed by a dormancy period until puberty when TGCTs emerge, suggesting that hormonal stimulus could be determinant in postpubertal development of TGCTs.3,4
For instance, estrogen hormones, synthetized by aromatase in the Leydig cells 5 and germ cells are considered germ cell survival factors. 6 Testicular estrogens interact with estrogen receptors (ERs; ERα and ERβ) which in turn mediate the transcription of tissue-specific genes. In vitro estrogens via ERs activation stimulate proliferation of rat neonatal gonocytes and induce spermatogenesis in the hypogonadal mouse. 7 Conversely, estradiol (E2) inhibits human testicular seminoma cell proliferation through an ERβ-dependent mechanism. 8
Human testis, gonocytes, and adult germ cells mainly express ERβ, and ERβ loss is associated with advanced tumor stage. 9 In agreement with a protective action of ERβ against cancer, we recently reported that E2/ERβ isoform produce autophagy and necroptosis in human seminoma cell line TCam-2 by inducing the expression of the tumor suppressor gene PTEN (phosphatase and tensin homolog). 10
Tumor suppressors belong to a family of cellular genes coding for factors capable to influence the cell-growth control and are inactivated in many types of cancers. Mitochondrial deacetylase sirtuin-3 (SIRT3) can function as a tumor suppressor, depending on the cell- and tumor type,11–13 although SIRT3 itself plays critical roles in the deacetylation of the tumor suppressor PTEN, suggesting a molecular link between two components. 14
SIRT3 attenuates reactive oxygen species (ROS) and protects the cell from ROS both directly through the deacetylation of manganese superoxide dismutase (MnSOD), catalase (CAT) and superoxide dismutase 2 (SOD2)12,15 and indirectly via interaction with transcription factors such as forkhead box O3 (FOXO3a). 16
Consistent with its tumor-suppressing role, the absence of SIRT3, observed in many transformed cell lines and human tumors, 17 correlates to abnormally high levels of ROS and decreased activity of mitochondrial detoxifying enzymes that directly induce genomic instability and indirectly pro-proliferative pathways, as well as an increase in hypoxia-inducible factor 1α (HIF-1α) protein levels.11,18 Critically, overexpression of SIRT3 decreases tumorigenesis in xenografts, even when induction of the sirtuin occurs after tumor initiation. 19 An increase in cellular growth rate, correlated with metabolism and ROS deregulations, was also observed in cancer cell characterized by Myc or Ras mutation along with the lack of SIRT3. 12
In recent years, several promising strategies directed at tumor suppressor genes or the pathways controlled by these genes have emerged. Hence, finding new ways and understanding the underlying mechanism of inducing oncosuppressor genes are needed.
In this article, in the aim of further exploring ERβ protective effects in seminoma, we investigate how E2 stimulus via ERβ may influence ROS levels through SIRT3 transcriptional control.
Materials and methods
Cell cultures
Human TCam-2 seminoma cell line (a gift from Dr Leendert H.J. Looijenga, Department of Pathology, Medical Center Rotterdam, Josephine Nefkens Institute with the permission of Sohei Kitazawa, Division of Molecular Pathology, Kobe University) was grown in RPMI 1640 plus 10% fetal bovine serum, 1% penicillin/streptomycin (Sigma), and 200 mM glutamine (SH30034.01; HyClone Laboratories, Thermo Scientific) at 37°C in a humidified cell culture incubator with 5% carbon dioxide.
Chemicals
Estradiol ((17β)estra-1,3,5,(10)-triene-3,17β-diol; E2), the mithramycin, and acrylamide bis-acrylamide were purchased from Sigma-Aldrich (A2917). The specific ERs inhibitor ICI 182,780 (ICI) was purchased from Tocris Bioscience (cat. no. 1047). E2 and ICI were dissolved in ethanol (0.02% final concentration). Peroxidase-coupled anti-rabbit IgG horseradish peroxidase (HRP; sc-2004) and anti-mouse IgG HRP were purchased from Santa Cruz Biotecnology, Inc. (sc-2005). Salmon sperm DNA/Protein A Agarose was also purchased from Santa Cruz Biotecnology, Inc. (sc-2001). Fugene 6 reagent was purchased from Roche Diagnostics (11815091001). Enhanced chemiluminescence (ECL) system was purchased from Amersham Pharmacia Biotech (RPN 2108). Total RNA Isolation System Kit enzymes, buffers, nucleotides, and 100 bp ladder used for reverse transcription polymerase chain reaction (RT-PCR) were purchased from Promega Corporation (Z3100). TRIzol reagent was purchased from Invitrogen (cat. no. 15596-018). Bradford protein assay was performed using a kit from Bio-Rad Laboratories (cat. no. 500-0002).
Plasmids
The firefly luciferase reporter plasmid contains the 788-bp SIRT3 promoter region (pGL2/788/SIRT3) as we previously reported. 20 The Renilla luciferase expression vector pRL-TK (Promega) was used as a transfection standard. The ERβ antisense plasmid (AS/ERβ) contains, in reverse orientation, a 1170-bp fragment of the coding sequence of the human ERβ cloned in pIRESpuro2 vector (Clontech Laboratories).
Western blotting
The analysis was performed as previously described. 21 Briefly, TCam-2 cells were grown in 10 cm dishes to 70%–80% confluence and shifted into RPMI without phenol red plus 10% dextran-coated charcoal (DCC) for 24 h. Then, cells were exposed to treatments as indicated for further 24 h. Cells were lysed in ice-cold lysis buffer containing 50 mM 4-(2-hydroxyethyl)-1-piperazineethanesulfonic acid (HEPES; pH 7.5), 150 mM NaCl, 1.5 mM MgCl2, 1 mM ethylene glycol-bis(β-aminoethyl ether)-N,N,N′,N′-tetraacetic acid (EGTA), 10% glycerol, 1% Triton X-100, and a mixture of protease inhibitors (aprotinin, phenylmethylsulfonyl fluoride (PMSF), and sodium orthovanadate). The protein content was determined using Bradford dye reagent (Bio-Rad). Equal amounts of total protein were resolved on sodium dodecyl sulfate (SDS)–polyacrylamide gels and transferred onto a nitrocellulose membrane. Blots were incubated overnight at 4°C and probed with the specific primary antibodies.
Total RNA extraction, RT-PCR, and real-time RT-PCR assay
Total RNA was extracted from TCam-2 cells using TRIzol reagent, and complementary DNA (cDNA) was synthesized by reverse transcription PCR method using a RETROscript kit. The expression of SIRT3 was quantified by real-time PCR using iCycler iQ Detection System (Bio-Rad).
A volume of 5 µL of diluted (1:4) cDNA was analyzed using SYBR Green Universal PCR Master Mix, following the manufacturer’s recommendations. Assays were performed in triplicate, and the results were normalized for 18S ribosomal RNA (rRNA) expression and then calculated as fold over vehicle.
Transfections and luciferase assays
TCam-2 cells plated in 24-well plate were transfected using the FuGENE 6 reagent as recommended by the manufacturer using 0.5 µg/well of the reporter plasmid. Treatments were added 6 h after transfection, and cells were incubated for 18 h. Renilla luciferase plasmid (25 ng/well) was used as standard. Firefly and Renilla luciferase activities were measured using a Dual Luciferase Kit (Promega, Milan, Italy) as described. 22
Lipid-mediated transfection of small interfering RNA duplexes
Cells were transfected with four functionally verified small interfering RNA (siRNA) directed against Sp1 or with a non-specific siRNA (Qiagen) that does not match with any human messenger RNA (mRNA) used as a control for non-sequence specific effects. Cells were transfected using Lipofectamine 2000 reagent (Invitrogen) and then treated as indicated.
Chromatin immunoprecipitation and re-chromatin immunoprecipitation assays and real-time chromatin immunoprecipitation
Cells were treated for 1 h as indicated before harvesting for the assay. Briefly, the immuno-cleared chromatin was precipitated with antibodies Sp1, ERβ, and RNA Pol II. Immunoprecipitated DNA was analyzed in triplicates by real-time PCR by using 5 µL of the diluted (1:3) template DNA. SIRT3 promoter primers, corresponding to the GC cluster region between −128 bp and +1 bp for PCR, were as follows: forward 5′-ATTTTGGCCAGGCTGGTCT-3′ and reverse 5′-GCACGCCTATAATCCCAGCT-3′ (Invitrogen). Real-time PCR data were normalized with respect to unprocessed lysates (input DNA). Input DNA quantification was performed using 5 µL of the diluted (1/50) template DNA. The relative antibody bound fractions were normalized to a calibrator that was chosen to be the basal, untreated sample. Final results were expressed as percent to the relative inputs.
SOD activity assay
This assay was performed using the Superoxide Dismutase Assay Kit from Sigma on the basis of Marklund and Marklund method. 23 The assay was performed according to the manufacturer’s instructions.
CAT activity assay
CAT activity was measured as described by Claiborne. 24 Cell extracts (200–400 µg) were added to 3 mL of 10-mM H2O2 in 50-mM potassium phosphate buffer (pH 7.8) and disappearance of H2O2 was immediately measured at 240 nm.
Measurement of intracellular ROS
Intracellular ROS content was determined by measuring the fluorescence of 2,7-dichlorofluorescein (DCF). 2′-7′-dichlorofluorescein diacetate (DCFH-DA) was added to the medium of cells at a final concentration of 20 µM and incubated at 37°C for 30 min following E2 treatment. The cells were then washed twice with phosphate-buffered saline (PBS) carefully. The DCFH-DA-fluorescence intensities (representing the intracellular ROS levels) were determined using conventional fluorescence microscopy (Olympus). Experiments were repeated three times independently.
Statistical analysis
Each datum point represents the mean ± SD of at least three independent experiments. Data were analyzed by Student’s t-test using the GraphPad Prism 4 software program; p < 0.05 was considered as statistically significant.
Results
E2-induced ROS production
Physiological concentrations of E2 stimulate a rapid production of intracellular ROS in epithelial cells. 25 To evaluate whether E2 can rapidly trigger the production of intracellular ROS in human seminoma, we treated TCam-2 cells, an in vitro model for the study of human seminoma expressing ERβ, 26 for 30 min with different concentrations of E2 and next incubated with the redox-sensitive fluorescent dye DCFH-DA. Results obtained show a significant production of ROS when cells were stimulated with 10 and 100 nM E2 (Figure 1). Cotreatment with antiestrogen ICI 182,780 known to induce ER degradation counteracted 10 nM E2 action demonstrating that the effect was mediated by ERβ.

E2 induces ROS production. Fluorescence images (upper panel) and quantitation (lower panel) of relative fluorescence intensity representing cytosolic ROS detection by DCFH-DA fluorescence of TCam-2 cells after 30 min treatment with E2 and/or 1 µM ICI as indicated. Quantitated values are shown as means of three independent measurements (bars, SD; *p ≤ 0.05 vs untreated cells; **p ≤ 0.05 vs E2 10 nM).
SIRT3 is expressed in TCam-2 cells and E2 stimulus increases SIRT3 protein and mRNA levels
It is reported that the increase in ROS levels stimulates tumor suppressor SIRT3 expression. 27 SIRT3 is involved in the functional regulation of the tumor suppressor PTEN 14 which is able to establish a functional molecular link with ERβ driving E2 action in TCam-2 cells. 10
We first characterized protein expression levels of SIRT3 in these cells as illustrated in Figure 2(a). Next, to evaluate a potential cross-talk between E2/ERβ signaling and SIRT3, we studied the effect of increasing concentrations of E2 on SIRT3 expression. After prolonged treatment (24 h), E2 (10 and 100 nM) significantly induced the SIRT3 protein levels and ICI cotreatment abrogated 10-nM E2-induced effect. Moreover, E2 significantly increased SIRT3 mRNA amount as evidenced by real-time PCR (Figure 2(b)), and transfection of TCam-2 cells with ERβ antisense plasmid (AS/ERβ) counteracted E2 effects, strongly indicating that E2 effects are mediated by ERβ isoform.

E2 through ERβ upregulates SIRT3 protein and mRNA levels in TCam-2 cells. (a) Western blotting analysis of SIRT3. TCam-2 cells were treated with E2 and/or 1 µM ICI as indicated. GAPDH was used as loading control. Autoradiograph shows the results of one representative experiment. Columns are mean of three independent experiments in which band intensities were evaluated in terms of optical density arbitrary units and expressed as fold over vehicle, which was assumed to be 1 (bars, SD; *p ≤ 0.05 vs vehicle-treated cells; **p ≤ 0.05 vs 10 nm E2). (b) Real-time PCR assay of SIRT3 mRNA expression in TCam-2 cells transfected with vector control or ERβ antisense plasmid (AS/ERβ) treated with vehicle (−) or E2, as indicated. 18S rRNA was determined as control. Columns are the mean of three independent experiments each in triplicate (bars, SD; *p ≤ 0.05 vs vehicle-treated cells; **p ≤ 0.05 vs 10 nM E2).
E2 through ERβ induces SIRT3 gene promoter activity
To investigate whether E2/ERβ could modulate SIRT3 gene promoter transcriptional activity, we performed transient transfection assays in TCam-2 cells, using the luciferase reporter construct containing the 788 bp of SIRT3 promoter sequence depicted in Figure 3 in the upper panel. 20 We found that 24 h of E2 (10 and 100 nM) significantly increased the activity of the promoter construct and cotreatment with the antiestrogen ICI and counteracted this effect further confirming the involvement of ERβ in the regulation of SIRT3 transcription (Figure 3, lower panel).

E2 transactivates SIRT3 gene promoter in TCam-2. (Upper panel) Schematic representation of SIRT3 promoter region containing the GC cluster located between −128 bp and +1 bp. (Lower panel) SIRT3 promoter construct was transiently transfected in TCam-2 cells, treated with vehicle (−) or E2 or 1 µM ICI or 100 nM mithramycin (Mytr) as indicated. Columns are mean of three independent experiments and expressed as fold change over untreated, which was assumed to be 1 (bars, SD; *p ≤ 0.05 vs vehicle; **p ≤ 0.05 vs E2 10 nM).
The analysis of SIRT3 promoter sequence showed the presence of several GC-rich motifs clustered in proximity of the transcription start site. These sites are recognized by the transcription factor Sp1 which interacts with ERs and mediates gene transcription by a nonclassical mechanism. 28 We found that 100 nM mythramycin, a drug able to bind to GC boxes inhibiting Sp1 binding, 29 prevented SIRT3 promoter transactivation upon 10 nM E2 treatment, indicating that Sp1 could play a fundamental role in the transcriptional regulation of SIRT3 by E2/ERβ (Figure 3, lower panel).
ERβ associates with SIRT3 promoter “in vivo”
To gain further insight into the mechanism involved in the E2-induced transactivation of SIRT3, we performed ChIP assay (Figure 4). TCam-2 cells were exposed for 1 h to either control vehicle or 10 nM E2, after which chromatin was cross-linked with formaldehyde, and protein–DNA complexes were immunoprecipitated with antibodies directed against Sp1. The quantitative polymerase chain reaction (qPCR) primers used encompass the GC-rich site we identified within the SIRT3 promoter (upper panel). Results obtained after E2 treatment demonstrate an enhanced recruitment of Sp1 complex together with ERβ allowing the access of RNA polymerase II to the SIRT3 promoter. Sp1-specific siRNA strongly reduced E2 effects (lower panel); as a control, we did not see recruitment to an unrelated SIRT3 promoter region located upstream of the GC-rich motifs (Sp1 site; data not shown).
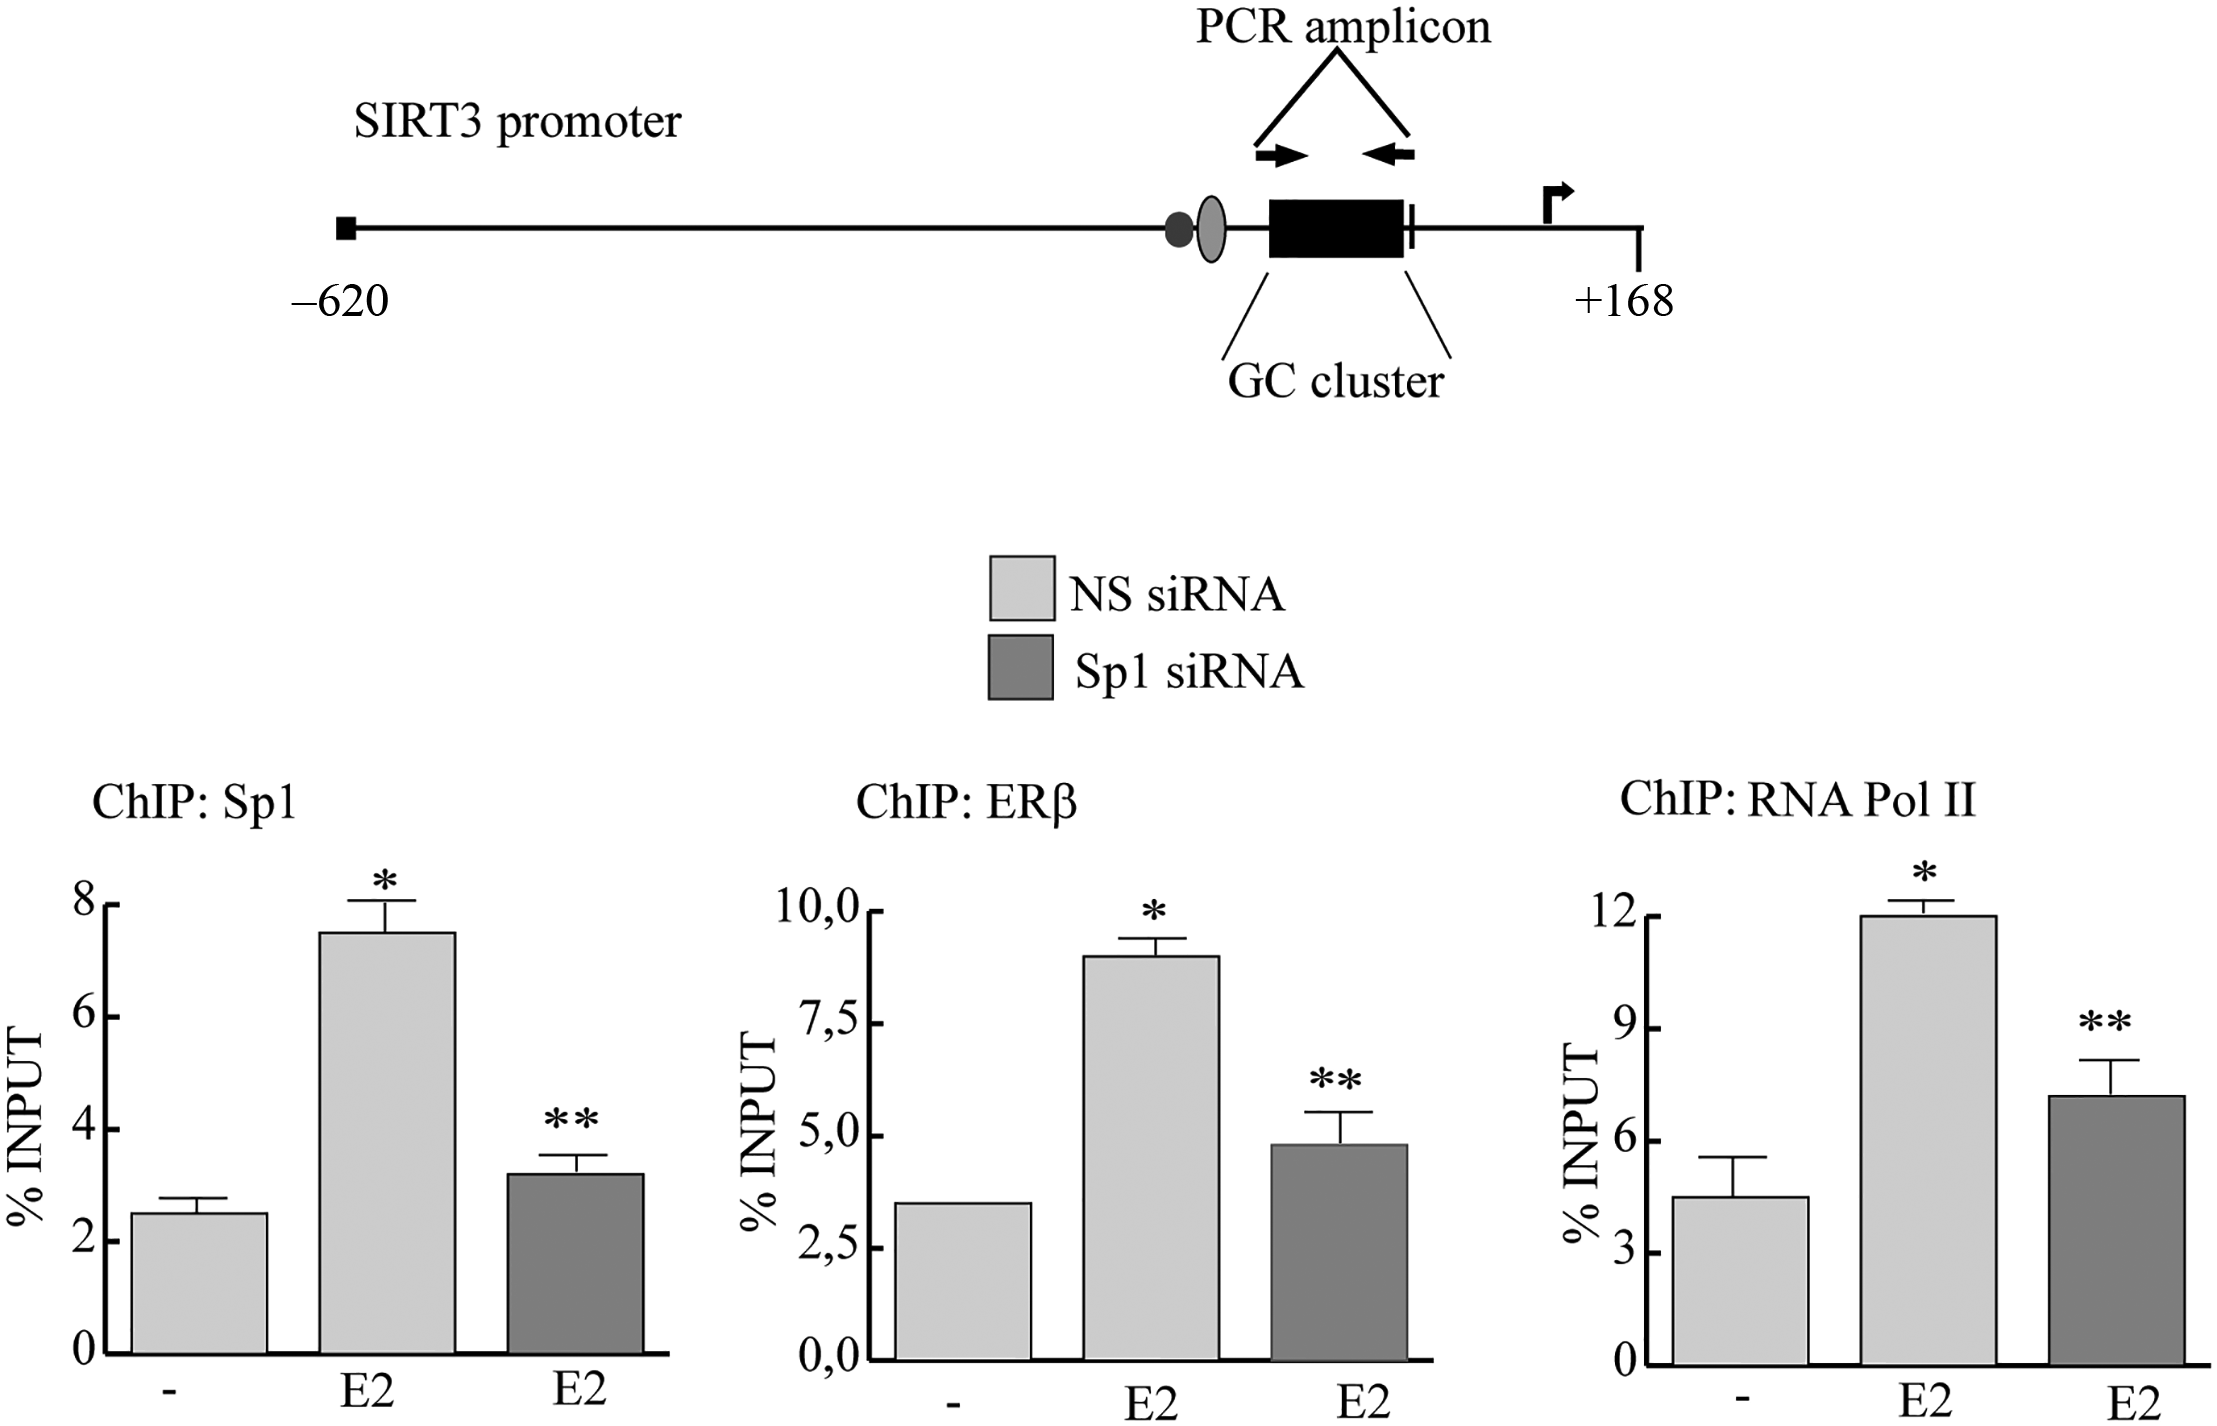
Ligand-activated ERβ binds the SIRT3 gene promoter together with Sp1. (Upper panel) Schematic representation of SIRT3 promoter region indicating the analyzed PCR amplicon. (Lower panel) ChIP and re-ChIP qPCR of TCam-2 cells transfected with non-specific (NS) siRNA or targeted against Sp1 siRNA treated with vehicle (−) or 10 nM E2. ChIP-qPCR was performed using primers as depicted in the upper panel and antibodies are used as indicated. Columns are the mean of three independent experiments (bars, SD; *p ≤ 0.05 vs vehicle; **p ≤ 0.05 vs 10 nM E2).
E2-induced superoxide dismutase and CAT activity
To scavenge ROS, 27 SIRT3 binds to deacetylates and activates superoxide dismutase (SOD), a class of enzymes that catalyze the detoxification of superoxide into oxygen and hydrogen peroxide, which is then converted to oxygen and water by CAT. Thus, we investigated the effect of E2/ERβ on SOD and CAT activities in TCam-2 cells. As shown in Figure 5, activities of SOD and CAT were significantly increased after 24 h of E2 stimulus when compared to matched control cells. The antiestrogen ICI was effective in suppressing both activities. On the contrary, no effect was observed on the glutathione S-transferase (GST) activity after E2 treatment (data not shown).

Ligand-activated ERβ induces activities of antioxidant enzymes in the TCam-2 cells (1 × 10⁶) which were treated with E2 and/or ICI for 24 h. Activity of (a) superoxide dismutase and (b) catalase were determined as described. Columns are the mean of three independent experiments (bars, SD; *p ≤ 0.05 vs vehicle; **p ≤ 0.05 vs 10 nM E2).
Discussion
TGCTs are a heterogeneous group of neoplasms with diverse histopathology and clinical behavior representing more than 90% of testicular neoplasms. 30 There is an increasing scientific interest to provide additional molecular target involved in the TGCTs biology, although the signaling pathways acting on initiation and progression are still to be defined. In this concern, our recent acquisition underlines a functional interplay between E2/ERβ and PTEN modulating autophagy and necroptosis in TCam-2 cells. 10 In this study, our data further support a protective role of ERβ just as a key regulator of SIRT3 expression.
We define the molecular mechanisms by which the ERβ-specific ligand determines the upregulation of SIRT3. Estradiol action occurs at transcriptional level as demonstrated by functional studies. Interestingly, we identified the presence of several GC-rich motifs clustered in proximity of the transcription start site, crucial for SIRT3 promoter induction by E2. These sites are recognized by the transcription factor Sp1 which mediates the recruitment of ERβ to the identified promoter sequence, as demonstrated by re-ChIP studies using a specific Sp1 siRNA.
SIRT3, a major mitochondria nicotine adenine dinucleotide (NAD)+-dependent deacetylase, may act on mitochondrial proteins for lysine deacetylation. 31 Thus, SIRT3 regulates the mitochondrial adaptive response to stress, such as metabolic reprogramming and antioxidant defense mechanisms. Accumulating evidence has recently demonstrated that SIRT3 may function as a tumor suppressor by enhancing the expression of mitochondrial MnSOD. 12 Loss of SIRT3 leads to increased mitochondrial ROS, which then promotes cellular transformation and tumor growth. 32
An important finding in this article is the significant increase in the functional SIRT3 amount, resulting from the cooperation of two concomitant mechanisms modulated by E2/ERβ. One mechanism is due to transcriptional regulation of SIRT3 by the enhanced recruitment of a complex Sp1/ERβ, facilitating the access of RNA polymerase II to the SIRT3 promoter. The second mechanism is reasonably dependent by the early increase in intracellular ROS after 30-min E2 treatment, which could stimulate SIRT3 gene expression as previously reported. 27 Therefore, our data suggest that ERβ intercepts a negative feedback mechanism to counterbalance the increase in intracellular ROS by increasing SOD2 enzyme activity through SIRT3, thus influencing seminoma cell fate decision.
In line with this, our previous data 10 report that a collaborative part between E2/ERβ and the tumor suppressor gene PTEN drives to autophagy and necroptosis TCam-2 demonstrating a role for the receptor in the inhibition of cell survival via PTEN. Taken together, our results support the idea that E2 through ERβ is able to turn on two different tumor-suppressive pathways in seminoma cell lines involving both PTEN and SIRT3. The latter activates SOD2 and CAT to scavenge ROS.
ROS levels control cell destiny toward life or death. Low production of ROS works as trigger of autophagic/mitophagic process, with consequent removal of damaged mitochondria and in turn cellular survival. On the other hand, high levels of ROS lead to cell death promoting the apoptotic pathway when pro-survival attempt fails. 33
Thus, the most convincing interpretation of our results is that E2 by rapidly enhancing ROS and activating ERβ determinates the later induction of the functional SIRT3, which causes the activation of SOD. This converts O2− into H2O2, which is further detoxified into H2O and O2 by CAT, thus finally contrasting intracellular ROS levels (Figure 6). Indeed, ERβ depletion after ICI cotreatment greatly attenuated the activation of SOD2 by E2, suggesting a molecular cross-talk intercepting SIRT3. In other words, this article highlights how E2 inducing SIRT3 expression via genomic action may counteract the early ROS production in TCam-2 cells.

Proposed model for E2/ERβ effects on SIRT3 in human seminoma TCam-2 cells (see text for details).
In summary, we have demonstrated a significant role for E2/ERβ signaling in a human seminoma cell line converging on tumor suppressor features mediated by SIRT3. Taking into account our previous study, 10 we conclude that ERβ may represent a crucial regulator of seminoma cell biology which drives autophagy and necroptosis but also ROS level reduction via SIRT3 regulation. Our findings thus indicate that an important tumor-suppressive pathway through ERβ is target of E2, actually proposing a distinctive protecting action against seminoma. Future studies may lead to additional strategies for the current therapy of seminoma.
Footnotes
Acknowledgements
S.P. and M.S. are joint first authors. D.B. and S.A. are joint senior authors.
Declaration of conflicting interests
The author(s) declared no potential conflicts of interest with respect to the research, authorship, and/or publication of this article.
Funding
The author(s) disclosed receipt of the following financial support for the research, authorship, and/or publication of this article: This work was supported by Ministero Istruzione Universita’ e Ricerca (ex60% 2014), Associazione Italiana Ricerca sul Cancro (AIRC; grant nos IG11595 and IG15738).