
Abstract
The goal of this study was to isolate cancer stem-like cells marked by high expression of CD44, a putative cancer stem cell marker, from primary oral squamous cell carcinomas and identify distinctive gene expression patterns in these cells. From 1 October 2013 to 4 September 2015, 76 stage III–IV primary oral squamous cell carcinoma of the gingivobuccal sulcus were resected. In all, 13 tumours were analysed by immunohistochemistry to visualise CD44-expressing cells. Expression of CD44 within The Cancer Genome Atlas–Head and Neck Squamous Cell Carcinoma RNA-sequencing data was also assessed. Seventy resected tumours were dissociated into single cells and stained with antibodies to CD44 as well as CD45 and CD31 (together referred as Lineage/Lin). From 45 of these, CD44+Lin– and CD44–Lin– subpopulations were successfully isolated using fluorescence-activated cell sorting, and good-quality RNA was obtained from 14 such sorted pairs. Libraries from five pairs were sequenced and the results analysed using bioinformatics tools. Reverse transcription quantitative polymerase chain reaction was performed to experimentally validate the differential expression of selected candidate genes identified from the transcriptome sequencing in the same 5 and an additional 9 tumours. CD44 was expressed on the surface of poorly differentiated tumour cells, and within the The Cancer Genome Atlas–Head and Neck Squamous Cell Carcinoma samples, its messenger RNA levels were higher in tumours compared to normal. Transcriptomics revealed that 102 genes were upregulated and 85 genes were downregulated in CD44+Lin– compared to CD44–Lin– cells in at least 3 of the 5 tumours sequenced. The upregulated genes included those involved in immune regulation, while the downregulated genes were enriched for genes involved in cell adhesion. Decreased expression of PCDH18, MGP, SPARCL1 and KRTDAP was confirmed by reverse transcription quantitative polymerase chain reaction. Lower expression of the cell–cell adhesion molecule PCDH18 correlated with poorer overall survival in the The Cancer Genome Atlas–Head and Neck Squamous Cell Carcinoma data highlighting it as a potential negative prognostic factor in this cancer.
Introduction
Oral squamous cell carcinomas (OSCC) are among the more prevalent cancers worldwide, with an estimated 300,373 cases and 145,353 deaths in 2012 as per GLOBOCAN reports.1,2 It is among the leading causes of cancer-associated deaths among both men and women in India.2,3 The widespread use of smokeless tobacco contributes to more than half of these cancers in India that predominantly manifest as lesions in the gingivobuccal region of the oral cavity and hence are referred to as OSCC of the gingivobuccal sulcus or OSCC-GB.4,5 The somatic mutation landscape of OSCC-GB revealed several features that are shared, as well as some that are distinct from ‘Head and Neck Squamous Cell Carcinoma’ (HNSCC).6–8 The latter represents tumours in a heterogeneous set of anatomical sites, including the oral cavity.
The mainstay treatment for this cancer type is surgery; however, frequent loco-regional recurrences account for a large number of mortalities.9,10 Small numbers of undifferentiated, epithelial tumour cells with stem cell–like properties (termed in literature as cancer stem cells (CSCs)), which may be left behind after surgery or generated via epithelial-to-mesenchymal transition (EMT), re-grow and may contribute to such recurrences.11–14 It is therefore likely that a molecular understanding of CSCs and their therapeutic targeting may offer avenues for better prognosis, as well as a more effective treatment option for this cancer type. 15
At the very minimum, two critical pieces of information – the identity of the tumour cell subpopulation that possesses stem cell-like features and a knowledge of some unique features of these cells that would then allow their distinction from other tumour and normal cells – are required for evolving CSC-based prognostic or targeting strategies. In this vein, several cell surface markers have been tested, and a few among these have been experimentally proven to identify subpopulations of CSCs in some cancer types. For example, only the subset of CD44+ CD24– breast cancer cells, but not the other marker combinations, generated tumours in immune-deficient nonobese diabetic/severe combined immunodeficient (NOD/SCID) mice. 16 In intestinal cancers, Lgr5+ intestinal crypt cells constituted the CSC compartment, 17 and in HNSCC, a minority population of CD44+Lin– cells was enriched for CSCs which in very few numbers could form a tumour in immunosuppressed mice. 18
Importantly, molecular signatures derived from the Lgr5+ intestinal crypt cells were predictive of colorectal cancer relapse, 19 and breast cancer CD44+CD24– cells showed gene expression features that correlated with poor patient outcome. 20 In addition, in HNSCC, the presence of higher numbers of CD44+Lin– cells, as well as higher levels of CD44 expression, portended poorer prognosis.21,22 Thus, it is possible that gene expression signatures unique to the CSC subpopulation in HNSCC or OSCC may reveal genes important for tumour spread, recurrence or those whose expression levels may be indicative of prognosis.
Here, we report differences in expression profiles of CSC and non-CSC tumour cell subpopulations, sorted on the basis of surface CD44 expression from patient-derived, primary OSCC-GB tumours. This analysis identified candidate genes, including some involved in cell adhesion, which could have potentially important roles in determining prognosis and/or tumour behaviour.
Materials and methods
Patients and tumour sample information
In all, 76 resected Stage III or Stage IV tumour tissues from adult, operable cases of oral cancer at the Kidwai Memorial Institute of Oncology (KMIO), Bengaluru, as first line of treatment, and enrolled between 1 October 2013 and 4 September 2015 were used in this study. RNA isolated from 14 such primary tumours was analysed during this study. Tissue sections from 13 primary tumours were used to perform immunohistochemistry (IHC) experiments.
Cell lines and antibodies
MDA-MB-231 cell line (ATCC HTB-26) was obtained as a gift from the laboratory of Dr Annapoorni Rangarajan (IISc, Bengaluru) and T47D cell line (ATCC HTB-133) was obtained as a gift from Dr Shambhavi Naik (inStem, Bengaluru).
The following commercial antibodies were used for IHC: anti-CD44 (NCL-CD44-2; Leica Biosystems); anti-Involucrin (SY5, ab68; Abcam); anti-p63 (4A4, MU418-100; BioGenex); anti-CD45 (BioGenex) and Peroxidase AffiniPure Goat Anti-Mouse IgG (H + L; 115-035-003; Jackson ImmunoResearch). The following commercial fluorescent dye–conjugated antibodies were used for fluorescence-activated cell sorting (FACS): anti-CD44 (G44-26, 559942; BD Biosciences); anti-CD45 (HI30, 11-0459-42; Affymetrix eBioscience); anti-CD31 (WM59, 11-0319-42; Affymetrix eBioscience) and Mouse IgG2b-APC (130-098-890; Miltenyi Biotec).
IHC
IHC analysis was done on 3–5 µm formalin-fixed paraffin-embedded (FFPE) sections collected on (3-aminopropyl)triethoxysilane-coated slides by immunoperoxidase methods with respective antibodies as per manufacturers’ instructions. Primary antibodies were used at the following dilutions in blocking solution (1×phosphate-buffered saline (PBS) containing 5% fetal bovine serum (FBS) or donkey serum and 0.3% Triton X-100): CD44 antibody at 1:25, CD45 antibody at 1:100, p63 antibody at 1:5 and Involucrin at 1:150. Antigen retrieval was achieved by the heat-induced epitope retrieval method in buffer containing sodium citrate or tris. The sections were incubated in primary antibody at 4 °C overnight and later with horseradish peroxidase–conjugated secondary antibody (Jackson ImmunoResearch) for 30 min at room temperature. A volume of 50–60 μL of diluted 3′,3-diaminobenzidine substrate (SK-4105; Vector Laboratories) was added to each section, and a visible colour change to brown was monitored. The sections were then counterstained with Haematoxylin (H-3404; Vector Laboratories). Appropriate positive and negative controls were included.
For quantification of CD45 staining after IHC, multiple images were captured at random locations through the entire stained section. Using ImageJ software, positively stained cells (brown colour) as well as the total number of cells in each captured image were marked and counted. At least 12 such images were captured and the cells in them were counted. CD45-positivity was calculated as

Expression analysis of TCGA data
The TCGA-HNSCC RNA-sequencing data were probed using the Cancer Browser heat map tool available at https://genome-cancer.ucsc.edu (accessed in March 2016) to generate the heat map displayed in Figure 2. The expression values of the genes of our interest in the TCGA-HNSCC RNA-sequencing data were downloaded using the UCSC Xena Functional Genomics Explorer at https://xenabrowser.net/ accessed on 12 April 2018. These data were used to generate the boxplots shown in Figure 6(a) using RStudio version 1.1.423.
Tissue dissociation and fluorescence activated cell sorting (FACS)
After surface decontamination of the resected tissue in EpiLife plus EDGS medium (Invitrogen) containing 2× gentamicin and amphotericin B (from 500× stock; Invitrogen), finely cut tissue pieces were incubated with 2 units/mL dispase (Sigma-Aldrich) and accutase (Invitrogen) to facilitate dissociation. Dissociation was performed on a rotating platform at 4 °C for 8–12 h followed by incubation at 37 °C for 30 min. Dissociated cells were strained successively through 100 and 40 µm filters to obtain single cells. RBCs were lysed using the human erythrocyte lysing kit (R&D Systems). The remaining cells were counted and stained using antibodies for FACS as per manufacturers’ protocols. No fixation or permeabilization steps were performed. 7-AAD was added to samples prior to analysis in order to discriminate dead cells. Sorting was performed on the FACS Aria fusion sorter (BD Biosciences). From the 70 resected tumours that were dissociated for generating single cells, CD44+Lin– and CD44–Lin– populations could be successfully isolated from 45 tumours by FACS.
RNA isolation and quantitative polymerase chain reaction analysis
RNA was isolated using TRIzol (Invitrogen) and purified with columns (Zymo Research) as per manufacturer’s instructions. RNA was reverse-transcribed using Superscript III RT (Invitrogen) and fold change was calculated relative to actin using the 2–ΔΔCt method. Quantitative polymerase chain reactions (QPCRs) were performed using SYBR Green (Applied Biosystems). The p values were calculated from the ΔCt values using the Welch Two-Sample t-test in RStudio. Sequences of all the primers used in this study are available upon request.
RNA quality check and library preparation
RNA was quantified using Nanodrop as well as the Qubit RNA Assay kit (Invitrogen). RNA integrity number (RIN) was calculated by running RNA samples on the Pico chip in a Bioanalyzer (Agilent). From 45 sorted pairs of cells, good-quality RNA could be isolated from 14.
Libraries were prepared using the RNA-Seq V2 kit (Illumina) from 100 ng of total RNA using the manufacturer’s protocol. Pre-prepped libraries were quantified using Qubit dsDNA HS Assay kit and validated for quality by running an aliquot on the High-Sensitivity Bioanalyzer Chip (Agilent). The average insert size of the libraries was 350 basepair. The libraries were then quantified for adapter ligated fragments by QPCR using the KAPA SYBR library quantification kit (KAPA Biosystems).
Analysis of RNA-sequencing (RNA-Seq) data
The RNA-Seq libraries were barcoded, pooled and multiplexed across three lanes of an illumina Hiseq flowcell. Sequencing was done on illumina HiSeq1000 system using paired-end chemistry. Quality of raw reads was analysed using the FastQC (http://www.bioinformatics.babraham.ac.uk/projects/fastqc/) tool. 23 Low-quality reads were filtered and adapter sequences were trimmed using Trimmomatic (sliding window of 4 with Q > 20 and minimum length 50). 24 High-quality filtered and trimmed reads were aligned to the Human Reference Genome hg38. (Retrieved from UCSC on 15/12/2015 http://hgdownload.soe.ucsc.edu/goldenPath/hg38/bigZips/.) Sequence alignment was performed using TopHat2 program (version 2.1.0) with default parameters (including no-mixed option to filter orphan mapped reads). 25 Gene expression was estimated using uniquely mapped reads in Cufflinks program (version 2.2.2). 26 Differential expression analysis was performed using Cuffdiff program (version 2.2.2). 26
Reads that did not map to the human genome were extracted from BAM files and then converted to the fastq format using bam2fastq (https://gsl.hudsonalpha.org/information/software/bam2fastq). Reference virus genomes, including human papilloma virus (HPV) 16 and 18, were downloaded from the National Center for Biotechnology Information (NCBI) Viral Genome Browser (https://www.ncbi.nlm.nih.gov/genome/viruses/). Fastq sequences were mapped to the virus genome databases using the Burroughs Wheeler Algorithm (BWA) 27 to screen for the presence of viral sequences in the data.
Survival analysis
Survival analysis of the TCGA-HNSCC data was performed using the Survival module of the Tumour IMmune Estimation Resource or TIMER at https://cistrome.shinyapps.io/timer/. 28 Kaplan–Meier plots were drawn using TIMER to explore the association between clinical outcome and gene expression and to visualise the survival differences.
Results
CD44 is expressed on the cell surface of non-terminally differentiated tumour epithelial cells
To identify the cells or cell types that express the putative head and neck CSC marker CD44 in OSCC, we first stained OSCC-GB sections with antibodies to CD44 and Involucrin, a terminal differentiation marker of keratinocytes. As shown in the representative images in Figure 1(a), CD44 stained the surface of several tumour cells, and interestingly, this staining was mutually exclusive with the staining observed for Involucrin. Cells that stained strongly for CD44 stained poorly for Involucrin and vice versa (Figure 1(a)). The epithelial nature of the CD44+ tumour cells was further confirmed by p63 staining. TP63, a p53-family transcription factor, is a basal keratinocyte marker that is required for the formation of stratified epithelia in mammals.29–31 Most if not all tumour cells that stained positive for CD44 also showed positive nuclear staining for p63 (Figure 1(b)).
Similar to the observations in tumour sections, in sections of hyperplastic epithelia where the basement membrane is still intact, CD44 marked cells in the basal layer and in an additional three supra-basal layers, distinctive from Involucrin that stained cells in the superficial layers (Figure 1(c)). Both in tumour and hyperplastic epithelia, the CD44+ epithelial cells interfaced the stroma (Figure 1(a) and (c)). Some stromal cells also stained positive for CD44, in agreement with the known expression of CD44 in multiple haematopoietic cell types (Figure 1(c)).

Staining pattern of the CSC marker, CD44 and the terminal differentiation marker, Involucrin is mutually exclusive in OSCC-GB. (a) Serial sections of an OSCC-GB tissue specimen were stained independently with antibodies to CD44 and Involucrin. The dotted rectangles represent regions of the 100× image magnified (at 200×) below. (b) Serial sections of an OSCC-GB tissue specimen were stained independently with antibodies to CD44 and p63. The dotted box identifies the region in the CD44-stained section that is represented in its p63-stained counterpart. (c) Serial sections of hyperplastic oral epithelia were stained independently with antibodies to CD44 and Involucrin. The dotted line represents the basement membrane at the junction of the epithelium and sub-epithelial connective tissue. In all the images in panels (a), (b) and (c), brown colour indicates positive staining and blue colour represents the haematoxylin–stained nuclei.
We also investigated the expression of CD44 in head and neck tumours and solid tissue normal that were available from TCGA (The Cancer Genome Atlas) network. 32 The expression of CD44 was higher in tumours compared to the normal tissues and additionally mirrored the expression of basal epithelial markers, TP63 and the keratin, KRT14 (Figure 2). As expected, expression of epithelial genes such as Claudins, CLD4 and CLD7, and the tight junction protein, TJP3, was higher in the normal compared to tumour tissues, while expression of mesenchymal genes such as Fibronectin (FN1) and Slug (SNAI2) was higher in the tumour tissues (Figure 2). The observations from IHC experiments as well as these TCGA expression data on CD44 could be readily reconciled with previous studies that discovered and described CD44 as a CSC marker in HNSCC. 18
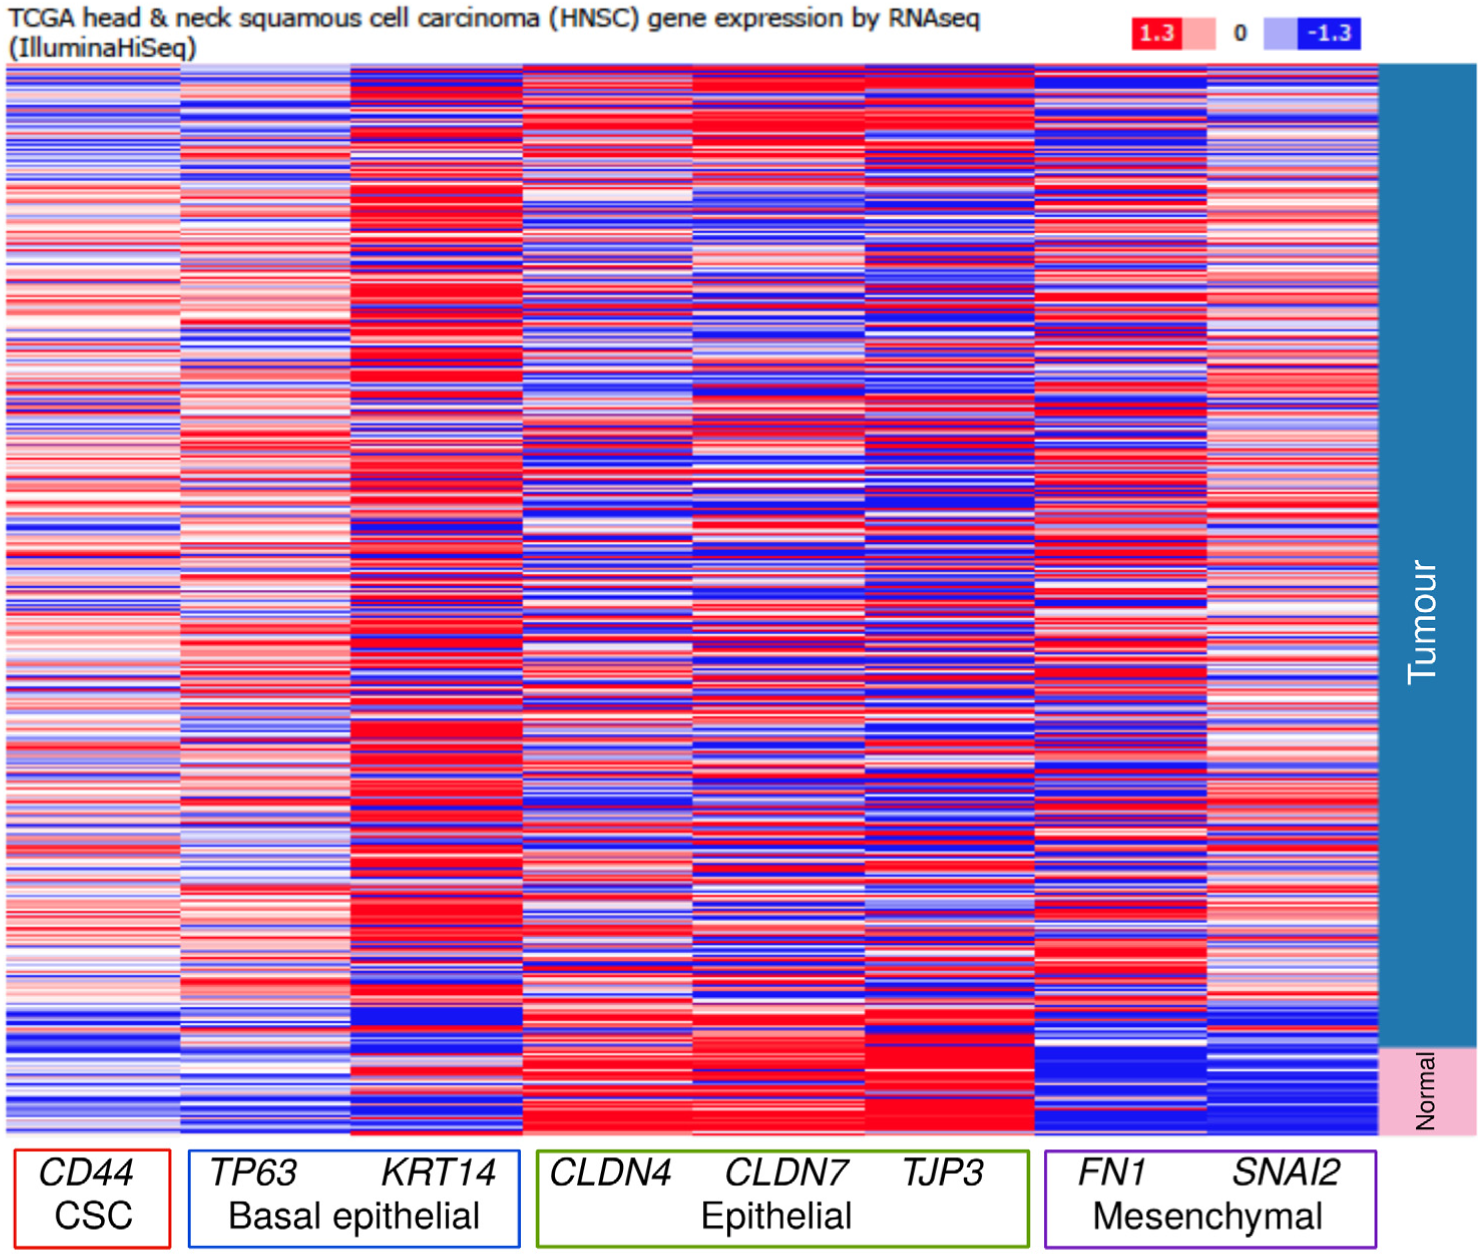
The expression levels of CD44 are higher in head and neck tumour samples as compared to solid tissue normal samples. Heat map showing the expression profiles of CD44, and genes associated with epithelial and mesenchymal states in 564 HNSCC and solid tissue normal. This display was generated based on the data available from the TCGA network analysed using tools available at https://genome-cancer.ucsc.edu accessed on 16 March 2016.
CD44+ tumour cells can be reproducibly isolated using a 3-antibody cocktail in a FACS-based purification strategy
To confirm the specificity of the CD44 antibody that we intended to employ in Fluorescence Activated Cell Sorting (FACS) for isolating CD44+ tumour cells, we used it to stain two breast cancer cell lines; namely, T47D that do not express CD44 and MDA-MB-231 that express high levels of CD44. 33 While MDA-MB-231 cells displayed increased APC fluorescence upon staining with the CD44-APC antibody, CD44-APC antibody-stained T47D cells resembled unstained cells (Figure S1(a) and (b)). Furthermore, the histograms of isotype control antibody-stained T47D and MDA-MB-231 cells were indistinguishable from their unstained counterparts (Figure S1(a) and (b)). Together, these data confirmed that the CD44-APC antibody was specific to CD44.
Enzymes used for tissue dissociation can have profound effects on the tissue-resident cell populations isolated by FACS. 34 This has been largely attributed to their non-specific effects on cell surface proteins, and antibodies that target cell surface proteins are typically used in such cell sorting experiments. For instance, trypsin has been reported to cleave CD44, while accutase does not. 35 Treatment of MDA-MB-231 cells with a combination of accutase and dispase did not also affect CD44 detection (Figure S1(c)). Therefore, we used a combination of accutase and dispase to dissociate freshly resected OSCC-GB tissues.
Epithelial cancers are an admixture of tumour epithelial cells and several other cell types, including tumour-infiltrating immune cells, stromal fibroblasts and endothelial cells. Using a pan-lymphocyte CD45 antibody, we estimated that as many as 50% of the cells in OSCC-GB tumour sections may represent CD45-positive cells (Figure S2). Multiple combinations of antibodies have been used to sort and separate the different tumour-resident cell populations.18,21,36 We used a combination of CD45 and CD31 antibodies for separating tumour-infiltrating immune cells and endothelial cells (together referred to as Lineage or Lin-positive cells) from the rest of the cells, which henceforth we will refer to as Lin-negative (Lin–) cells.
In agreement with our estimate of CD45-positive cells, the percentages of Lin-negative cells (gate P1 in Figure 3(a)) in the OSCC-GB specimens that we analysed ranged between 30% and 50% (Figure 3(a)). In addition, the expression of epithelial cell–specific genes such as dNP63, KRT14, KRT5 and TGM1 was several fold higher in Lin-negative cells as compared to the Lin-positive cells (Figure 3(b)). Like-wise, haematopoietic cell markers such as CD2 and HCK were detected at much higher levels in the Lin-positive cells vis-à-vis the Lin-negative cells, thus re-confirming the identities of the two populations (Figure 3(b)). Lin-negative cells were further plotted as a function of CD44-APC fluorescence, and CD44+Lin– and CD44–Lin– subpopulations were delineated (gates P2 and P3, respectively, in Figure 3(a)). In each case, an aliquot of the sorted cells was reanalysed to confirm the identity and purity of the sorted populations (Figure 3(a)).
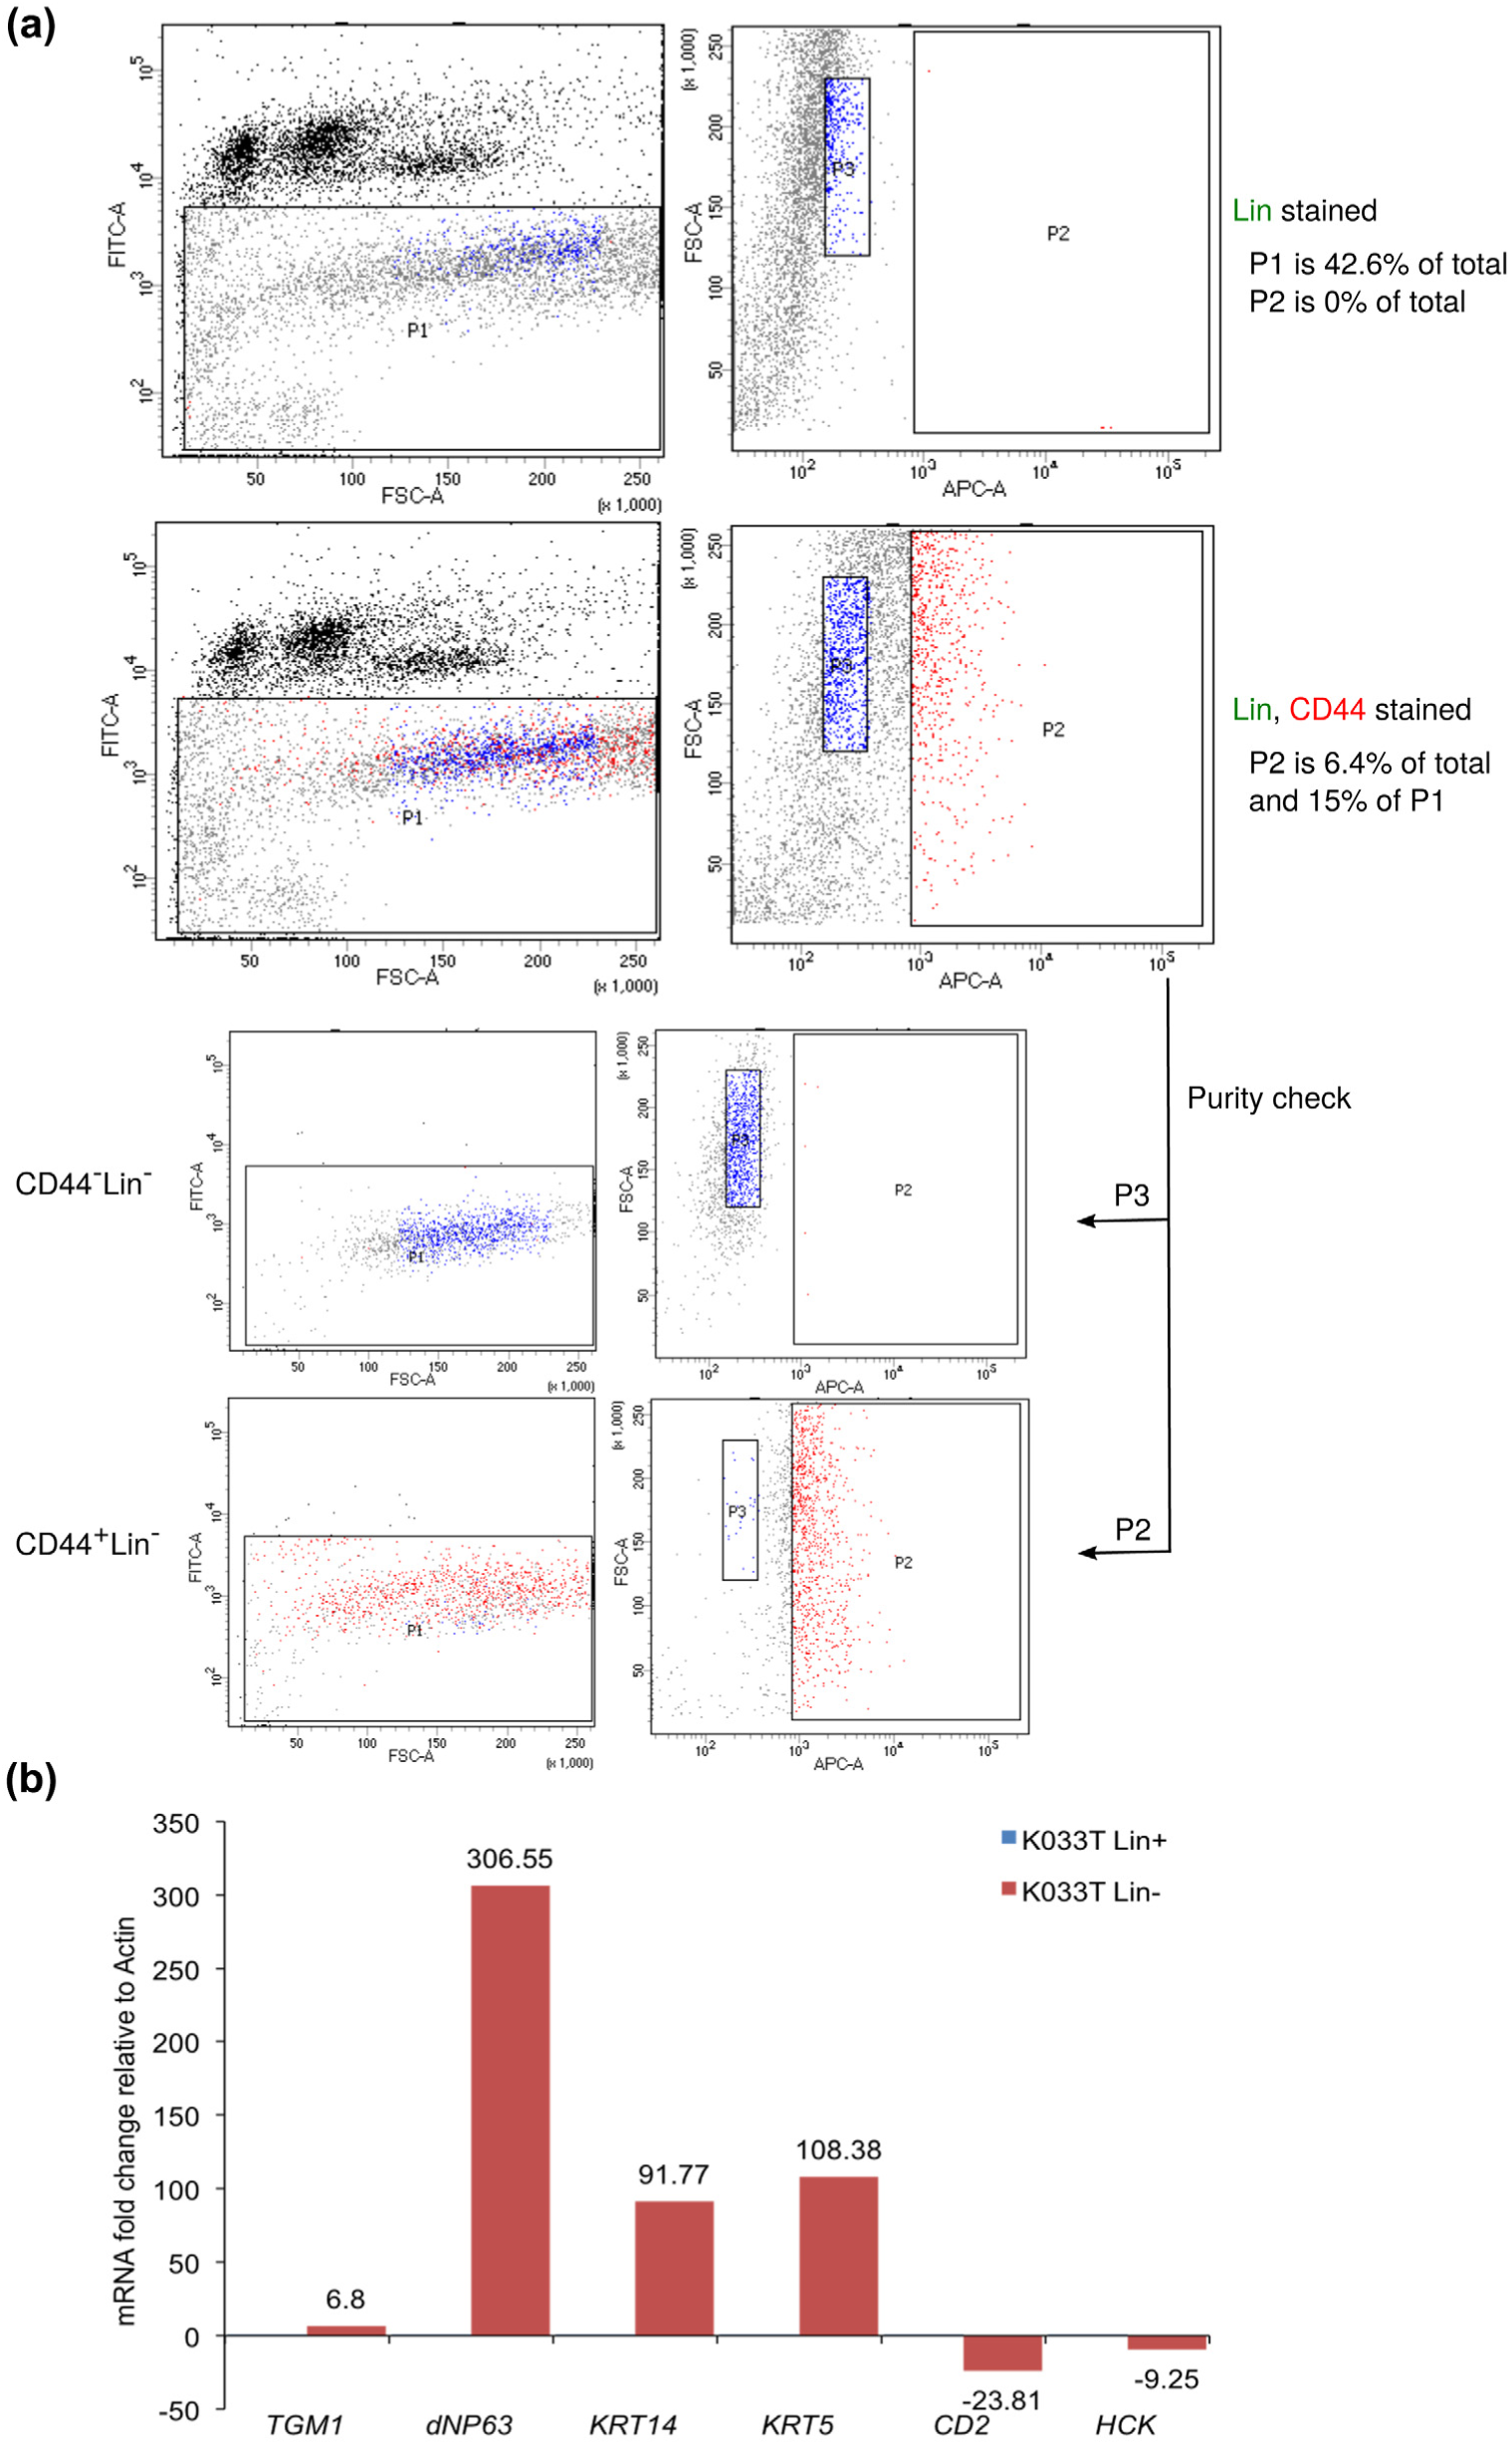
CD44+Lin– cells represent a minority OSCC-GB sub-population that can be reproducibly isolated after exclusion of CD45- and CD31-positive cells. (a) Dot plots of a representative FACS-based purification of CD44+Lin– and CD44–Lin– cells from an OSCC-GB specimen are shown. Gate P1 was drawn to exclude the CD45- and CD31-positive cells as well as apoptotic cells. Gates P2 and P3 were drawn to identify CD44-positive (red dots) and CD44-negative (blue dots) subpopulations within the Lin-negative P1 fraction for sorting. Dot plots obtained by re-analysing an aliquot of the sorted cells are also shown. (b) RNA isolated from Lin-negative (Lin–) and Lin-positive (Lin+) subpopulations of an OSCC-GB specimen, K033T was analysed by RT-QPCR with specific primers for genes indicated in the x-axis. The fold change was calculated relative to Actin mRNA levels and plotted with respect to the value for the Lin+ sample, which was taken as 1.
RNA sequencing of five sets of matched CD44+Lin– and CD44–Lin– samples identifies several differentially regulated genes in common
Libraries from quality-checked RNA samples representing five different OSCC-GB specimens, labelled P1, P2, …., P5, were paired-end sequenced on a Hiseq1000 (Supplementary Table 1). The number of quality-filtered, de-multiplexed reads obtained from the 10 libraries sequenced ranged from 25 million to 128 million reads. In each sample, greater than 94% of the sequenced data had good quality reads. Furthermore, in every case, >95% of such reads could be mapped to the human genome and transcriptome assemblies.
Differential gene expression analysis was performed between each CD44+Lin– sample vis-à-vis its matched CD44–Lin– sample from the same OSCC-GB specimen (Figure 4(a)). Hundreds of differentially expressed genes were identified in each of the five comparisons; although, only a handful of genes were identified as differentially expressed in common to all five comparisons (Supplementary Table 2). Applying a log2 fold change cut-off of greater than 2 occurring in at least 3 out of 5 comparisons, 102 genes were determined as upregulated in the CD44+Lin– subpopulation (Figure 4(a) and (b)). Similarly, using a log2 fold change cut-off of less than −2 occurring in at least 3 out of 5 comparisons, 85 genes were denoted as downregulated in the CD44+Lin– subpopulation (Figure 4(a) and (b)).

RNA-Seq analysis identifies specific enriched categories of genes that are differentially regulated between the CD44+Lin– and CD44–Lin– subpopulations of OSCC-GB tumours. (a) A simplified flowchart of the RNA-Seq experiment and downstream Bioinformatics analysis pipeline. (b) Heat maps depicting genes that were differentially expressed in the CD44+Lin– samples versus the CD44–Lin- samples in at least three OSCC-GB specimens. The scale of the heat map ranges from −10 (dark blue) through 0 (white) to +10 (bright red). (c) The 102 upregulated and 85 downregulated gene sets were functionally annotated using DAVID gene ontologies, biological pathway (BP) and cellular component (CC). The top two functional clusters obtained using these gene sets are indicated along with p values. (d) Location of RNA-Seq reads in the genomic loci of candidate differentially expressed genes, PCDH18, KRTDAP and GATA2. These visualisations are IGV snapshots of normalised RNA-Seq reads from CD44+Lin– and CD44–Lin– samples of P1 and P2 specimens.
Gene ontology analysis of the candidate differentially expressed genes using DAVID revealed a preponderance of genes involved in specific cellular pathways. 37 For instance, genes involved in regulating the immune response were highly enriched among the 102 upregulated genes (Figure 4(c)). The 85 genes whose expression was deemed lower in the CD44+Lin– cells were enriched for those with roles in cell adhesion (Figure 4(c)). Given that cell adhesion is one of the most common functions of the extracellular matrix (ECM), not surprisingly, it emerged as the most statistically significant cellular component (Figure 4(c)). Using the sequence data, the genomic regions of some candidate genes were visualised on the Integrative Genomics Viewer (IGV).38,39 An abundance of reads mapping to the genomic region of these genes in either the CD44+Lin– or CD44–Lin– sample, but not in both, confirmed the differential expression of these genes (Figure 4(d)).
The differential expression of experimentally validated candidate genes is reconfirmed in additional OSCC-GB specimens
We examined the expression of some selected cell adhesion and ECM-related genes such as KRTDAP, PCDH18, MGP and SPARCL1 by QPCRs on the sequencing libraries. The levels of these genes were lowered by ∼80% in the CD44+Lin– subpopulations when compared to their counterpart CD44–Lin– subpopulations, in at least 3 out of the 5 OSCC-GB specimens analysed (Figure 5(a)). These results mirrored the inference drawn from the RNA-sequencing data. Similarly, the upregulation of immunoregulatory genes such as C-KIT, GATA2, CXCR5 and IL1RL1 could also be experimentally validated by QPCRs on the libraries (Figure 5(b)).
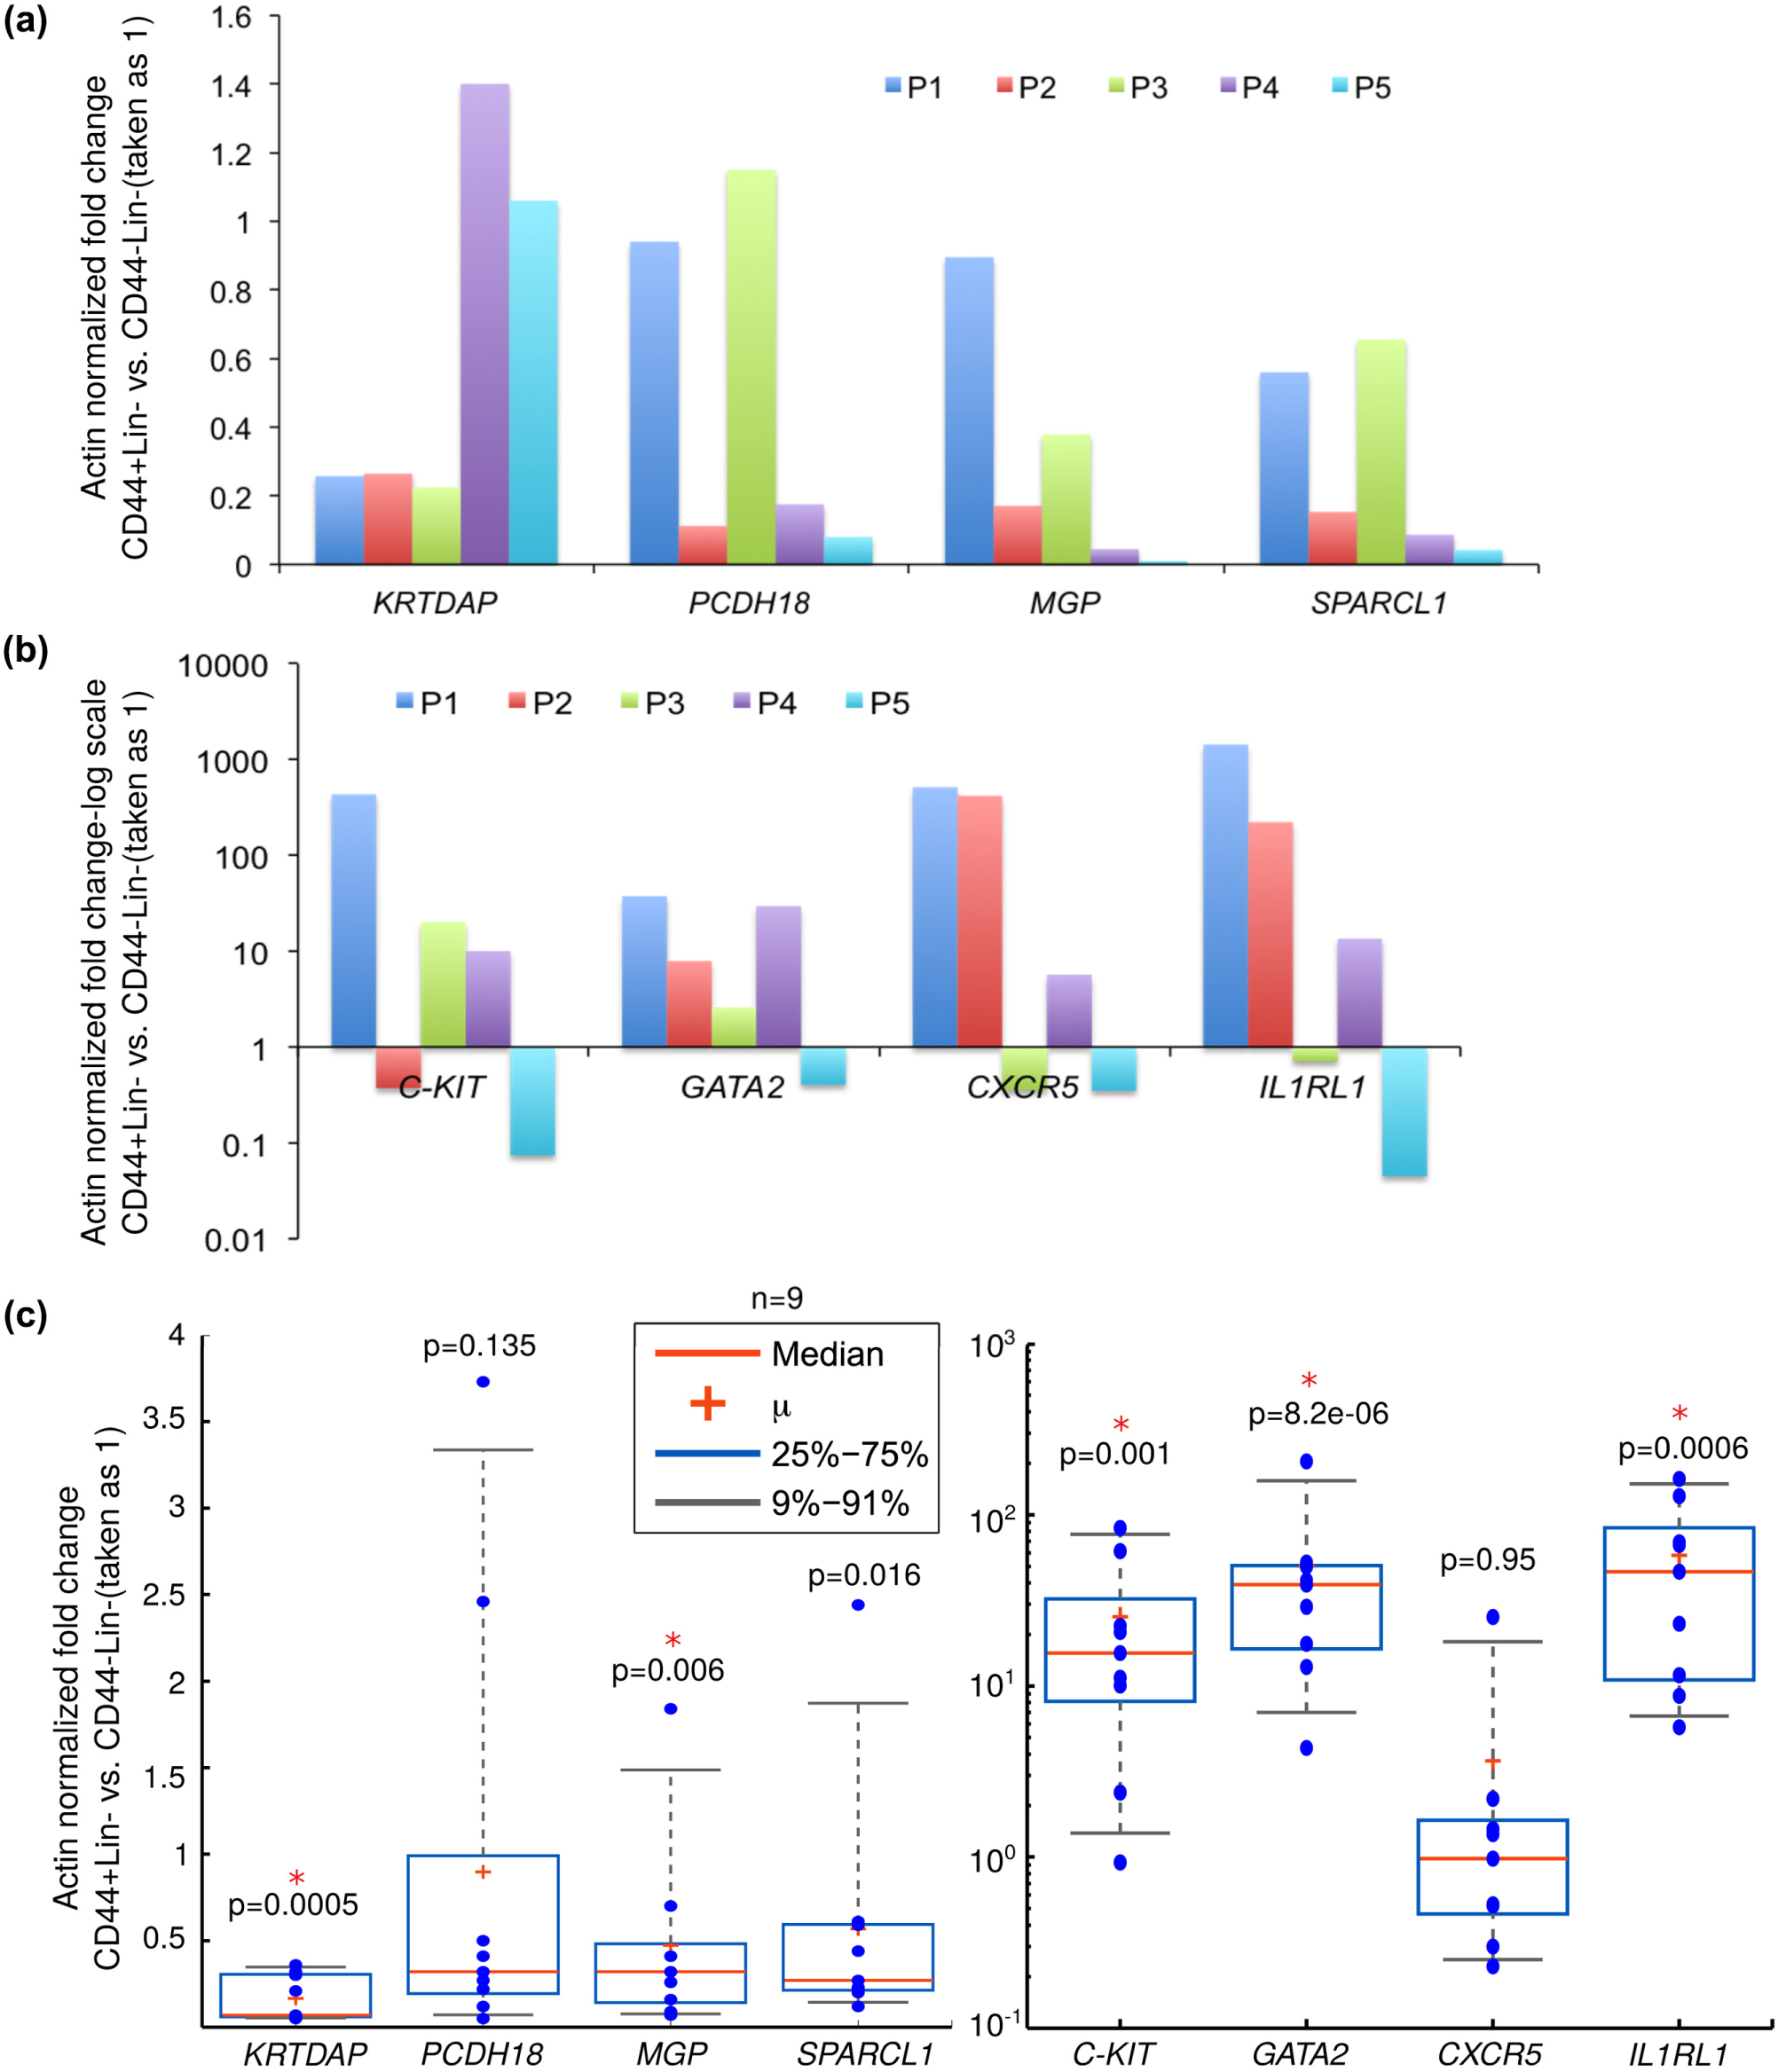
Decreased expression of cell adhesion–related genes and increased expression of immune-regulation genes in the putative CSCs, CD44+Lin– cells. (a) RNA-Seq libraries prepared from CD44+Lin– and CD44–Lin– subpopulations of five OSCC-GB specimens, P1–P5 were analysed by QPCR with specific primers for genes indicated in the x-axis. The fold change was calculated relative to Actin mRNA levels and plotted with respect to the value for the CD44–Lin− sample, which was taken as 1. (b) Same as panel A above, except that the values were plotted on the y-axis in logarithmic scale. (c) RNA isolated from CD44+Lin– and CD44-Lin- subpopulations of nine independent OSCC-GB specimens were analysed by RT-QPCR with specific primers for genes indicated in the x-axis. Fold change was calculated relative to Actin mRNA levels and with respect to the value for the CD44–Lin– sample, which was taken as 1. The box and whiskers plots shown here represent the fold change values obtained for the indicated genes across the nine OSCC-GB specimens (each value is represented by a blue-colour filled circle). The p values from the Welch Two-Sample t-test are also indicated, and those with p values <0.005 were considered significant.
Next, we determined the expression of these experimentally validated genes in sorted CD44+Lin– and CD44–Lin– subpopulations from nine additional OSCC-GB specimens. KRTDAP levels were decreased by more than 50% in all the nine CD44+Lin– samples analysed vis-à-vis their matched CD44–Lin– controls (Figure 5(c)). In a similar analysis, the messenger RNA (mRNA) levels of MGP and SPARCL1 were found to be downregulated in the CD44+Lin– subpopulations in eight out of the nine OSCC-GB specimens analysed, while PCDH18 mRNA was downregulated by at least 50% in seven specimens (Figure 5(c)). Barring CXCR5, mRNA levels of the rest of the upregulated genes, C-KIT, GATA2 and IL1RL1, were increased by an average of at least 10 fold in the nine OSCC-GB specimens analysed. These results argue for a broad relevance of these genes in OSCC-GB.
Lowered expression levels of PCDH18 correlates with poorer prognosis in HPV-negative HNSCC
We were particularly interested in the candidate downregulated genes because of their imminent connections to cell adhesion and migration and thus potentially to tumour spread. We analysed the expression levels of PCDH18, KRTDAP, MGP and SPARCL1 in RNA-sequencing data from normal tissues, primary HNSCC tumours and metastatic tissues available from the TCGA network. The expression of at least three of the genes analysed was significantly lower in the primary tumour and metastatic tissues compared to solid tissue normals, thus supporting the inference from our QPCR data (Figure 6(a)).

Lower expression levels of PCDH18 portend poorer prognosis in HPV-negative HNSCC. (a) Boxplots showing the expression levels of the candidate genes, PCDH18, KRTDAP, MGP and SPARCL1 in 44 solid tissue normals (blue-filled boxes), 520 primary HNSCC tumours (red-filled boxes) and 2 metastatic sites (unfilled boxes) available from the TCGA network. The p values from one-way ANOVA are also indicated, and those with p values <0.005 were considered significant. (b) Kaplan–Meier plots showing the association between PCDH18, KRTDAP, MGP and SPARCL1 expression levels and overall survival in 294 HPV-negative HNSCC patients. Log-rank p values are also indicated.
Next, we sought to test if the expression level of these genes was correlated to the overall survival of HNSCC patients. In this context, it was important to consider HPV status as HPV is a well-known prognostic indicator in HNSCC. HPV-positive tumours, which are primarily oropharyngeal tumours, have a favourable prognosis compared to HPV-negative tumours. 40 We mapped the non-human reads obtained from RNA-Seq to the high risk HPV16 and HPV18 viral genomic sequences, and found that in each case, less than 10 reads mapped to these viral sequences (Supplementary Table 3). We thus categorised our samples as HPV-negative similar to the criteria used by the TCGA network. 32 We then analysed the survival data of HPV-negative HNSCC tumours available in the TCGA database. Using the Survival Module in TIMER (Tumour IMmune Estimation Resource), we plotted Kaplan-Meier curves comparing survival probabilities between the top one-third (∼35%) and the bottom one-third of PCDH18, KRTDAP, MGP and SPARCL1-expressing tumours. 41 As seen in Figure 6(b), tumours expressing lower levels of PCDH18, fared significantly poorly than those expressing higher levels of PCDH18 (log-rank p value <0.05).
Discussion
The initial part of this study largely confirmed previous findings that have described CD44 as a CSC marker in HNSCC. IHC experiments showing the mutually exclusive localisation of CD44 and Involucrin and the TCGA expression data on CD44 reinforced this concept. In the latter part, RNA-Seq of the CD44+ cancer stem-like subpopulation revealed new validated candidate genes that could be potentially useful in prognosis, and whose further study could reveal unknown aspects of the pathobiology of oral cancer. We identified several genes involved in cell–cell or cell–matrix adhesion to be downregulated in the CD44+ tumour cells of 14 independent primary OSCC-GB tumours. While this may seem paradoxical in the context of CD44 being a cell adhesion molecule, it is in sync with reports that the levels of several genes involved in cell–cell adhesion, cell–matrix adhesion and differentiation are decreased during the transformation process. 42
Among the genes that we successfully validated, the proto-cadherin PCDH18 was particularly interesting, having emerged from our study as a potential negative prognosticator. Loss of the Pcdh18 ortholog in zebrafish resulted in loosely held cells implying its essential role in preserving cell adhesion and cell–cell contact. 43 In addition, overexpression of PCDH18 in colorectal cancer cell lines suppressed migration, and conversely, loss of PCDH18 in colonic epithelial cells resulted in enhanced migration. 44 Given these observations, one may speculate that decreased PCDH18 levels may make it easier for the tumour epithelial cells to bud off and spread from the site of the primary tumour. Decreased levels of Keratinocyte differentiation–associated protein or KRTDAP, a gene highly expressed in the suprabasal epidermis, reconfirmed the poor differentiation status of the CD44+ tumour cells. 45
The upregulation of several genes involved in immunoregulation may possibly reflect the stromal proximity of CD44+ cells in these tumours. It is likely that an interaction between the CD44+ tumour cells and stromal immune cells could result in the expression of certain immunoregulatory and angiogenesis-related molecules in the former. Interestingly, oral tumourspheres that are believed to comprise stem-like cells also expressed high levels of angiogenesis- and invasion-promoting genes. 46 Alternatively, these immunoregulatory genes could also have direct tumour-promoting functions. For example, one of the genes in this category, GATA2, functions as an oncogene and a driver of metastasis in RAS-pathway mutant non-small-cell lung cancer (NSCLC) cells and in prostate cancer, respectively.47,48 Analysing the TCGA data for HNSCC using the cBio portal, we found that about 5% of head and neck tumours harbour amplifications of the GATA2 locus.49,50
Interestingly, we did not identify genes involved in EMT or genes associated with pluripotency and stemness to be uniquely expressed in the CD44+ tumour cells. Earlier studies have shown high Bmi-1,18,51–54 Nanog and Oct-455–57 expression in CSCs from HNSCC and the subtype of tongue squamous cell carcinomas in particular. While this manuscript was in preparation, a study described a subpopulation of CD44bright cells in human oral carcinomas that also did not overexpress EMT genes. 58 These cells were slow cycling, metastasis seeders that were uniquely defined by a lipid metabolism signature. The absence of an obvious EMT gene signature in the tumourigenic CD44+ subpopulation in OSCC suggested that EMT might not be a pre-requisite for the metastatic process, at least in this subtype. Alternatively, this observation could be the outcome of a heterogeneous CSC population in OSCC for which there is a growing body of evidence in literature.59–61 That the differentially expressed genes could be grouped into distinct and disparate functional subsets lends further credence to the idea of a heterogeneous CSC population in this cancer type. The relatively small numbers of differentially expressed genes identified in common among the five tumours that were sequenced and analysed also indicated, in a broad sense, the heterogeneity present within the OSCC-GB tumour subtype.
However, our small sample numbers, the use of a sole CSC marker and a lack of functional data on the candidate genes are significant limitations of our study. Further experiments testing the functional role of some of the identified candidate genes are required to better understand the roles of cell adhesion and migration in regulating the tumourigenic behaviour of the oral CSC subpopulation.
Supplemental Material
figure_S1 – Supplemental material for Decreased expression of cell adhesion genes in cancer stem-like cells isolated from primary oral squamous cell carcinomas
Supplemental material, figure_S1 for Decreased expression of cell adhesion genes in cancer stem-like cells isolated from primary oral squamous cell carcinomas by Amrendra Mishra, Harshini Sriram, Pinal Chandarana, Vivek Tanavde, Rekha V Kumar, Ashok Gopinath, Raman Govindarajan, S. Ramaswamy and Subhashini Sadasivam in Tumor Biology
Supplemental Material
figure_S2 – Supplemental material for Decreased expression of cell adhesion genes in cancer stem-like cells isolated from primary oral squamous cell carcinomas
Supplemental material, figure_S2 for Decreased expression of cell adhesion genes in cancer stem-like cells isolated from primary oral squamous cell carcinomas by Amrendra Mishra, Harshini Sriram, Pinal Chandarana, Vivek Tanavde, Rekha V Kumar, Ashok Gopinath, Raman Govindarajan, S. Ramaswamy and Subhashini Sadasivam in Tumor Biology
Supplemental Material
Supplementary_tables – Supplemental material for Decreased expression of cell adhesion genes in cancer stem-like cells isolated from primary oral squamous cell carcinomas
Supplemental material, Supplementary_tables for Decreased expression of cell adhesion genes in cancer stem-like cells isolated from primary oral squamous cell carcinomas by Amrendra Mishra, Harshini Sriram, Pinal Chandarana, Vivek Tanavde, Rekha V Kumar, Ashok Gopinath, Raman Govindarajan, S. Ramaswamy and Subhashini Sadasivam in Tumor Biology
Footnotes
Acknowledgements
The authors are grateful to all the patients and their families who consented to participate in this study and donated samples. The authors thank Narayanaswamy (KMIO) and the pathology laboratory at KMIO for their excellent technical assistance. The authors thank the Central Imaging and Flow Facility (CIFF) at the National Centre for Biological Sciences (NCBS) and the Next-Generation Sequencing (NGS) facility at the Centre for Cellular and Molecular Platforms (CCAMP) for excellent assistance with FACS and RNA-Seq, respectively. S.S. thanks Yashoda Ghanekar (DeepSeeq Bioinformatics) and Venky Krishnan (TIFR-CAM) for their assistance in using the IGV browser and MATLAB respectively. S.S. and H.S. thank Colin Jamora (inStem) for his support. A.M., S.S. and S.R. thank Dr Geetashree Mukherjee (Tata Memorial Centre, Kolkata, and formerly KMIO) and Dr Manjula BV (Bangalore Baptist Hospital) for their support and clinical guidance. A.M. designed and performed experiments, analysed and presented data. H.S. performed experiments and analysed data; P.C. performed bioinformatics analysis, analysed data and presented figures and tables. V.T. provided conceptual advice to S.S. and P.C. in designing the bioinformatics analysis. R.V.K. participated in tissue grossing and gave conceptual advice to S.S. on oral pathology and clinical features. A.G. participated in conceptualising the project and provided advice to S.S. and A.M. on experimental design. R.G. participated in conceptualising the project and provided advice to S.S. and A.M. on experimental design. S.R. participated in conceptualising the project and provided advice to S.S. and A.M. on experimental design. S.S. designed and performed experiments, analysed and presented experimental and bioinformatics data and wrote the manuscript. All authors have read and approved the manuscript.
Availability of data and material
The raw sequencing data generated and analysed during this study are not publicly available due to privacy and ethics reasons but are available from the corresponding author on reasonable request for research purposes only. All processed data such as the list of differentially expressed genes that was generated during this study are included in this published article [and its supplementary information files].
Ethical approval
All steps in this study were compliant with the WMA Declaration of Helsinki that governs ethical principles for medical research involving human subjects. All patients recruited to this study were adults and consented to participate in this study by signing an informed consent form. Both the established cell lines used in this study (MDA-MB-231 and T47D) were used solely for research purposes, and in the setting of a not-for-profit, non-commercial research institution. Thus, no specific ethics and permissions were involved in using these cell lines. The entire study was approved by the Medical Ethics Committee at KMIO (letter dated 22 October 2013) and by the human ethics (Ref Nos IEC.2 & inStem/IEC-7/004), Biosafety (Ref Nos inStem/G-141 (3)/2012 and inStem/G-141 (3)-06/2016) and Stem cell research (Ref No 021/SCR/VI-29.4.16) committees at the Institute for Stem Cell Biology and Regenerative Medicine.
Declaration of conflicting interests
The author(s) declared no potential conflicts of interest with respect to the research, authorship, and/or publication of this article.
Funding
The author(s) disclosed receipt of the following financial support for the research, authorship, and/or publication of this article: This work was initially supported by a research grant from Sanofi Synthelabo, India to S. Ramaswamy, Subhashini Sadasivam and S. Ramaswamy gratefully acknowledge this support from Sanofi and later from the inStem core. Ashok Gopinath and Raman Govindarajan, who were employees of Sanofi, participated in initial discussions on study design and in analysing data. The authors declare that they have no competing financial interests. Amrendra Mishra gratefully acknowledges the University Grants Commission (UGC), Government of India for a Junior Research Fellowship. The publication of this article was made possible through grant No. BT/PR17576/MED/30/1690/2016 from the Department of Biotechnology, Government of India.
Supplementary material
Supplementary material is available for this article online.
References
Supplementary Material
Please find the following supplemental material available below.
For Open Access articles published under a Creative Commons License, all supplemental material carries the same license as the article it is associated with.
For non-Open Access articles published, all supplemental material carries a non-exclusive license, and permission requests for re-use of supplemental material or any part of supplemental material shall be sent directly to the copyright owner as specified in the copyright notice associated with the article.