
Abstract
Aflatoxin B1, arguably the most potent human carcinogen, induces liver cancer in humans, rats, trout, ducks, and so on, but adult mice are totally resistant. This resistance is because of a detoxifying enzyme, mouse glutathione S-transferase A3, which binds to and inactivates aflatoxin B1 epoxide, preventing the epoxide from binding to DNA and causing mutations. Glutathione S-transferase A3 or its analog has not been detected in any of the sensitive species, including humans. The generation of a glutathione S-transferase A3 knockout (represented as KO or -/-) mice has allowed us to study the induction of liver cancer in mice by aflatoxin B1. In contrast to the induction of hepatocellular carcinomas in other species, aflatoxin B1 induces cholangiocarcinomas in GSTA3-/- mice. In other species and in knockout mice, the induction of liver cancer is preceded by extensive proliferation of small oval cells, providing additional evidence that oval cells are bipolar stem cells and may give rise to either hepatocellular carcinoma or cholangiocarcinoma depending on the nature of the hepatocarcinogen and the species of animal. The recent development of mouse oval cell lines in our laboratory from aflatoxin B1-treated GSTA3-/- mice should provide a new venue for study of the properties and potential of putative mouse liver stem cells.
Keywords
Liver cancer and aflatoxin B1
Hepatocellular carcinoma (HCC) is the 5th most common cancer worldwide1,2 and the incidence is increasing. In the United States, HCC ranks 5th in males and 8th in females among most common cause of cancer death. 3 Early-stage HCC can sometimes be treated with surgery, an option, however, for only a small number of patients. Transplantation may be considered for those with small tumors that have not metastasized, whereas sorafenib is a targeted drug for patients who are not candidates for surgery. Even with advanced treatment, the 1- and 5-year mortality rates are 43% and 71%, respectively.3,4 Globally, most cases of HCC occur in Southeast Asia and sub-Saharan Africa where, along with chronic hepatitis, dietary exposure to a carcinogen aflatoxin B1 (AFB1) is the important risk factor.5–11 Introduction of vaccines for hepatitis B virus (HBV) and selection of alternative crops have greatly reduced HCC in high-risk areas. 12 Aflatoxin (AFB1), a product of Aspergillus flavus mold contamination, is widespread in many foods, such as dairy, grains, and peanuts13–15 as well as in marijuana (NY State Toxicology Laboratory). Its contribution to the etiology of HCC in the United States is not known,16,17 although overall extrinsic and environmental factors are considered responsible for most HCCs. 18
AFB1 and GSTA3
Whereas AFB1 is one of the most potent hepatocarcinogens in humans; wild-type (WT) mice are highly resistant due to binding and detoxification of the AFB1 epoxide by glutathione S-transferase (GSTA3). Upon ingestion, AFB1 is activated by cytochrome P450 (CYP)-mediated oxidation to AFB1-exo-8,9-epoxide (AFBO),19–22 which then forms AFB1–N7-guanine adducts and produces mutations (Figure 1), for example, in the p53 gene.23–25 In the mouse, protection against adducts occurs by detoxification of AFBO by glutathione-S-transferase 3 (GSTA3)-mediated conjugation of AFBO with reduced glutathione (GSH)19,26,27 (Figure 2). GSTA3 is the major constitutively expressed GST in the mouse liver, accounting for about 35% of the total GST activity in males and 47% in females.28,29 GSTA3 has narrow substrate specificity: it is the only GST responsible for detoxification of AFBO in the mouse.30–32 Besides AFB1, hydroperoxides are also substrates for GSTA3 33 and thus GSTA3 is a component of cellular antioxidant defense. GSTA3 expression, at least in part, is controlled by the transcription factor Nrf2.34–36 The GSTA3 promoter, like other GSTs, contains functional antioxidant response elements that Nrf2 binds to after induction with antioxidants.34–36 Humans do not have an equivalent to GSTA3 and are, like other species (rat, hamster, trout, etc.), very sensitive to toxic, mutagenic, and carcinogenic effects of AFB1.

Metabolic activation and DNA binding of AFB1. The 8–9 carbons are modified to produce AFB1-exo-8,9-epoxide. The epoxide is highly activated and binds to DNA (AFB1–N7-guanine).

Detoxification of activated AFB1 8,9-epoxide by glutathione S-transferase.
GSTA3-/- (knockout) mouse
Adult WT mice are highly resistant to AFB1-induced liver injury and cancer development due to the high activity of GSTA3.26,32 Ordinarily, only neonatal mice are susceptible to AFB1 treatment,37,38 which correlates with hepatocyte proliferation and low GST activity 39 in newborns. We have constructed a GSTA3 knockout (KO) mouse (GSTA3-/-), which is sensitive to the toxic and mutagenic effects of AFB1 40 and thus behaves analogously to humans in regard to AFB1 metabolism. The GSTA3-/- mice display striking differences in response to AFB1 compared to WT mice. Whereas WT mice are resistant to the effects of AFB1 at the doses of up to 60 mg/kg, the highest dose of AFB1 that is not lethal to GSTA3-/- mice is only 1–1.2 mg/kg. Also, the GSTA3-/- mice show several hundred-fold more mutagenic AFB1–N7-guanine adducts than WT mice, with females having about three times more adducts than males, as measured by liquid chromatography–mass spectrometry (Figure 3). 41 We further characterized the GSTA3-/- mice and found that there is no compensatory up-regulation of other GST subunits (P1, M1, M5, and A4). 41 In fact, there is an overall reduction in the most abundant mouse subunits, P1 and M1, with a greater decrease in GSTP1 in females than in males. There is no change in the levels of microsomal epoxide hydrolases that activate AFB1, except for an increase in CYP1A2 in male, but not female, KO mice. The urinary excretion of AFB1–N-acetylcysteine (NAC), a product of glutathione adduction of AFB1, is dramatically reduced in GSTA3-/- mice.

AFB1–DNA adducts in WT and GSTA3-/- male and female mice. AFB1–DNA adduct formation 2 h after 0.87 mg/kg AFB1.
GSTA3-/- mice: single dose of AFB1
The highest non-lethal, intraperitoneal (i.p.), dose for GSTA3-/- mice is 1.25 mg/kg for males and 1 mg/kg for females. Both males and females react with acute liver injury, manifested macroscopically as a pale liver and histologically as necrosis. In female mice, 1 mg/kg of AFB1 produces significant acute liver injury followed by gradual regeneration. The liver is uniformly pale; histologically, it changes from ballooning hepatocytes into massive necrosis and hemorrhage by day 5. The most interesting feature of injury and regeneration is extensive oval cell (OC) proliferation, which is first seen on day 7, increases and remains prominent for up to 35 days post AFB1 (OCs on day 10 are shown in Figure 4(b) and (c)). 41 Male -/- mice require about a 25% higher AFB1 dose to produce acute toxicity, with a narrow window between lethality (>1.5 mg/kg) and minimal/no effect (1 mg/kg). Liver injury in males is less extensive and repair is shorter with less extensive OC proliferation. We are still not sure why there is a gender difference when a single AFB1 dose is used, since both male and female -/- mice show similar activities of AFB1 metabolizing enzymes (mouse P450 1A2 and 3A11) and similar levels of AFB1-epoxide (measured as urine AFB1–NAC). However, when given repeated AFB1 injections, males display prolonged injury and OC expansion as extensive as that seen in female mice.

Massive oval cell proliferation after a single AFB1 dose (1 mg/kg). (a) GSTA3-/- female mouse liver, no AFB1. P—portal vein, C—central vein (200×). (b, c) GSTA3-/- female mouse, 10 days after AFB1. Numerous oval cells (arrows). (c) is a higher magnification (400×) of the square in (b) (200×). (d) GSTA3-/- female mouse, 30 days after AFB1. Numerous oval cells (arrows) (200×). H&E.
GSTA3-/- mice: repeated AFB1 dosing and tumor formation
We have developed several models of repeated AFB1 injections (e.g. monthly and bi-monthly (up to 10) injections of 1 mg/kg and weekly and bi-weekly (up to 24) injections of 0.5 mg/kg that result in extensive liver injury and extensive proliferation of OCs in both males and females that progress to the development of premalignant foci, nodules, 42 and tumors). For example, 10 monthly doses of 1 mg/kg result in distorted livers and macro- and microscopic liver nodules, including HCCs. However, in a more extensive study, cholangiocarcinomas (CCAs) were produced when AFB1 is administered for a long time period, in a similar sequence of changes leading to tumors (Figure 5). 41 Thus, male and female mice were treated once per week with 0.5 mg/kg AFB1 for 12 weeks (4 males, 5 females) and 24 weeks (5 males, 6 females) and the livers were analyzed at 12 and 8 months, respectively, after the last AFB1 injection. All mice had grossly distorted livers, with cysts, and type I nodules 42 and tumors, with 24 injections resulting in more numerous and coalescing lesions than 12 injections (Figure 5(a)–(d)). Histologically, these lesions consisted of numerous hepatocellular nodules (mostly of the early or Becker type I grade), cholangiomas, and CCAs (Figure 5(e)–(l)). No distant metastases were found. All vehicle (dimethyl sulfoxide (DMSO))-treated control mice (5 males and 5 females, 12 and 24 weekly injections) had normal livers.

Gross (a–d) and microscopic (e–l) lesions in GSTA3-/- mice treated with weekly (12 or 24) AFB1 injections (0.5 mg/kg). (a) Normal (control) liver, male mouse, 24 injections of vehicle (DMSO) (L, M, R, C—left, middle, right, and caudate lobes). (b) Cysts (short arrows in the middle lobe) and tumor (long arrow in the left lobe), male, 12 injections. (c) Multiple type 1 nodules (short arrows) and tumors (long arrows in the left and right), male, 24 injections. (d) Liver composed of coalescing type I nodules (arrows), female, 24 injections. (e–l) H&E staining. (e) Small type 1 hepatocellular nodule (arrows), male, 12 injections (100×). (f) Large type 1 nodule (arrows), female, 24 injections (40×). (g) Three type 1 nodules (arrows), male, 12 injections (40×). (h) Multifocal cholangiomas (arrows), male, 12 injections (40×). (i) Cholangioma (long arrows) and cholangiocarcinoma (short arrows), female, 24 injections (100×). (j) Early cholangiocarcinoma (arrows), male, 24 injections (100×). (k) Large adenoma and small cholangiocarcinoma (arrows), male, 12 injections (40×). (l) Cholangiocarcinoma (arrows), female, 24 injections (100×).
OCs as liver stem and liver cancer stem cells
In healthy liver, mature epithelial cells (hepatocytes and cholangiocytes) are responsible for maintaining homeostasis without the need for involvement of stem cells. The stem cell compartment is located in the region of the smallest branches of the biliary tree (canals of Hering) and that space (niche) is shared with other, non-parenchymal, cells (stellate, Kupffer, endothelial) that support their stemness features.43–49 However, after injury that is too extensive for mature cells to repair or when proliferation of hepatocytes is inhibited, stem cells become active and proliferate and differentiate until the liver regenerates. The hepatic stem cells are rare cells that divide asymmetrically and can be identified with antibodies against a range of markers, some old and others recently discovered (e.g. CK19/A6/OV-6, α-fetoprotein (AFP), CD133, HNF1β, Sox9, osteopontin, EpCAM, etc.). When activated, stem cells give rise to transit amplifying cells, which divide symmetrically and expand. As these cells expand, they retain some markers of stem cells and gain new ones, some of which may be specific (e.g. Foxl1, Lgr5, Trop2).45,46,48 Depending on the nature of initial injury (hepatocytic or cholangiocytic), transit amplifying cells finally differentiate into either hepatocytes or cholangiocytes, likely under the control of different signaling pathways (Wnt/HGF and EGFR/Notch1, respectively).
OCs are either stem cells or early transit amplifying cells, but until we confirm their dual-lineage potency, we prefer to use this morphologically descriptive and historic term. 50 OCs may present histologically as single cells, cords of cells growing between hepatocytes or in the form of ductules, and are identified with a variety of antigenic markers, depending on the species and underlying pathology. They are seen in human livers associated with severe tissue damage and can be induced experimentally in several species, mostly in various models in rats and, less frequently and at very much reduced numbers, in mice.51–55 Markers of OCs in mouse are not necessarily shared by OCs in rats 56 so we will limit this discussion to mouse OCs only. Their possible origin (cholangiocytes, canals of Hering, or peribiliary, but also hepatocytes, stellate cells, or extrahepatic), identity, and role (differentiation into hepatocytes, bile duct cells, or both) are not resolved and are the subject of numerous reports and review discussions.43–49,57–66
When seen in the context of carcinogen exposure, OCs are thought to function as cancer stem cells that are capable of developing into hepatocellular and/or cholangiocellular carcinomas.65,67 Thus, the study of OCs in animal models is important from two perspectives: as progeny of normal stem cells, for their potential use in regeneration therapy, and as cancer stem cells, as the cells of origin of liver cancer. Both male and female GSTA3-/- mice react to AFB1 exposure with massive OC expansion. This provides, for the first time, a mouse model for the study of the role of OCs in normal liver regeneration and in hepatocarcinogenesis.
There are several other ways to induce OCs in mouse liver, from employing certain chemicals to spontaneous induction in transgenic or KO mice. However, the majority of reports rely on only two models: 3,5-diethoxycarbonyl-1,4-dihydrocollidine (DDC) diet 57 ,62,68–83 and, less frequently, choline-deficient/ethionine-supplemented (CDE) diet.83–89 Both of these models induce a relatively very low level ductular-type OC response compared to the AFB1 response in the KO mice and do not induce liver tumors, and neither agent is relevant for human health. In contrast, the OC proliferation seen in GSTA3-/- mice is associated with the clinically relevant environmental carcinogen (AFB1), is sustained over many weeks, is much more severe, is morphologically different from DDC or CDE, and results in the development of neoplastic liver lesions. The pattern of OC expansion in GSTA3-/- mice is similar to regimens that utilize CDE diet in rats, 90 whereas DDC, CDE, and other models in mice are similar to rat regimens that use 2-acetylaminofluorene (2-AAF), where ductules are a common feature.52,53,91,92 The pattern of OC expansion likely represents the cell type they originated from, that is, ductules from ductular stem cells and single-type OCs from periductular stem cells.65,66,93 Other models in mouse, such as acetaminophen (APAP),56,94 dipin/partial hepatectomy,95–97 diethylnitrosamine (DEN), 98 cocaine/phenobarbital, 99 CCl4 injections,100,101 ethanol and high-fat diet,102,103 and 2-AAF/partial hepatectomy, 88 are far less frequently employed. OCs have also been described in several transgenic and KO mice models.104–113
Like cocaine in the phenobarbital/cocaine mouse model of OC proliferation, 99 AFB1 is one of the few xenobiotics that acutely damages the periportal zone of the liver lobule and not the central zone.114,115 OC proliferation is a prominent feature of AFB1 injury in rats,116–118 woodchucks, 119 and ducks 120 but has never been described in mice until now. The ease of inducing these cells and their large numbers, in both males and females, make AFB1-treated GSTA3-/- mice an ideal model to study the role of liver stem cells during regeneration and carcinogenesis. Markers of mouse OCs range from well-established, such as AFP,99,100,121 A6,69,70,76,96,104 and CK19/OV-6 or pan-CK,56,84,102 to those reported in recent years, mostly in mice given DDC diet, such as CD24a, 71 CD34,69,106 CD44,75,108,122 CD49f, 109 CD133,109,110,123 Sca-1, 69 c-Kit, 101 Dlk-1/Pref-1,124,125 EpCAM,75,101 TROP2, 75 ABCG2, 56 Foxl1,74,126 E-cadherin, 108 and Bgp1. 101 The most useful ones are those that are not shared with other liver cell types and expressed on cell surface, so that they can be used for both tracing and isolation. The practical difficulty, however, is that most OC markers are also present on other cells such as biliary (e.g. CK19, A6, Sox9, osteopontin, EpCAM, CD49f, c-Met) and hematopoietic (e.g. CD133, c-Kit, Thy-1, Sca-1, Flt-3) cells and on fetal or dividing hepatocytes (AFP).
Most recently, the fate of liver stem and OCs in a mouse has been investigated by tracing the cells over long periods of time using genetic markers such as green, yellow, or red fluorescent proteins (GFP, YFP, and RFP, respectively). These are most commonly employed in a system of two transgenic mice: a specific promoter-driven Cre recombinase mouse and a loxP mouse with florescent marker gene (Cre/loxP system).80–82,126–132 Again, the DDC- and CDE-diet-induced injuries are almost always used to activate stem cells and mimic regeneration, and a carcinogen (e.g. DEN) is used to induce liver tumor development. Overall, whereas some report the necessary role of stem cells for liver regeneration or tumor development,74,81,126,128 others find that stem cells are not involved or that mature hepatocytes and cholangiocytes are sufficient for regeneration80,83,129–131 reviewed in Grompe 61 or as cancer-initiating cells.132,133 Stellate cells 134 and even extrahepatic cells135,136 have also been implicated as a possible source of liver stem or mature liver cells.
OC proliferation in mice in vivo
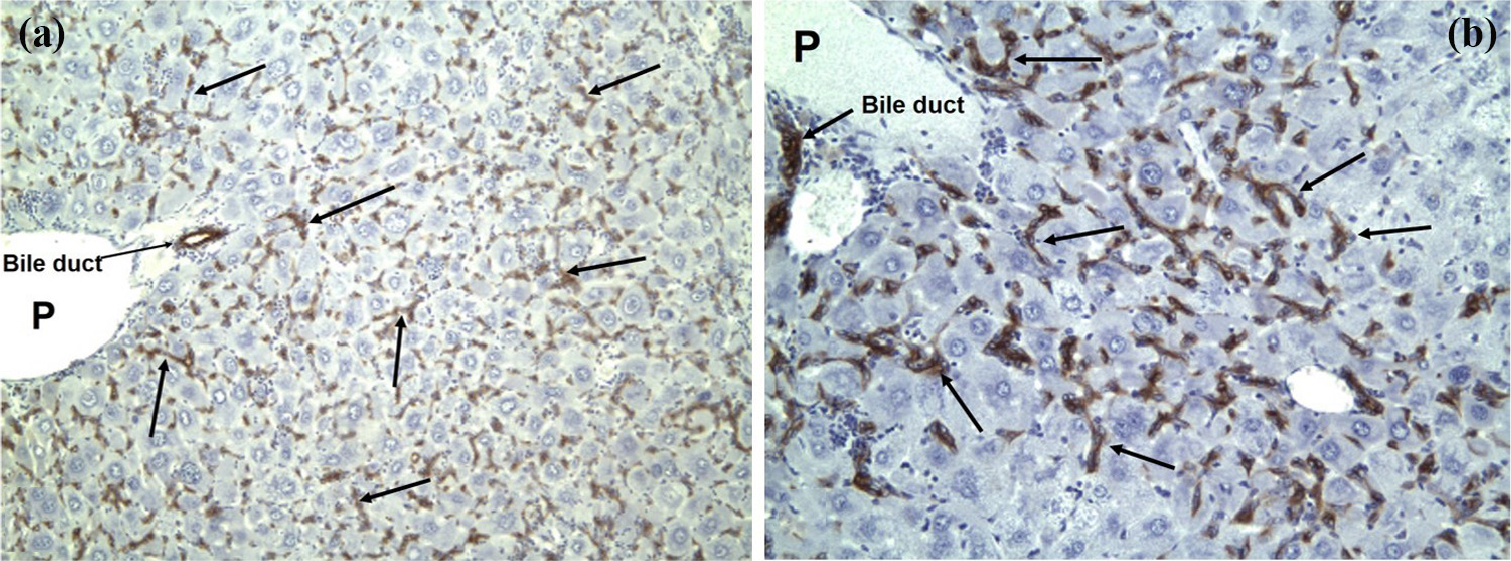
Extensive proliferation of OCs is a prominent feature in GSTA3-/- mice following AFB1-induced liver injury. A single i.p. injection of AFB1 (1 mg/kg) results in the appearance of OCs starting at around day 7 and continues for several weeks (Figure 4(b)–(d)). OCs spread from the portal zone, occupy the entire liver lobule, and are present even at day 30 post AFB1 (Figure 4(d)) after which they start to decrease in numbers. This proliferation is spatially and temporally the most extensive we have seen in any of the mouse model of OCs, including the commonly used DDC diet model. Also, whereas DDC injures bile ducts and thus produces exclusively ductular cell proliferation, OC proliferation in GSTA3-/- mice, in contrast, is much more extensive, and they form fewer ductules and frequently grow out as individual cells or form single-file strings of cells. Thus, in appearance, this response resembles the OC response seen in rats following CDE diet. Besides morphology, OCs are identified immunohistochemically using antibodies against bile duct/OC-specific markers A6 and pan-cytokeratin (pan-CK; Figure 6). We found that they also label with markers specific for immature and progenitor cells of other tissues, such as β-catenin, CD133, and EpCAM (Figure 7(b)–(d)). We used antibodies against CD133, expressed on hematopoietic and some tissue-specific stem cells, and EpCAM, expressed on small liver ductules, to isolate OCs from the liver (see below). A single injection of AFB1 produces more extensive liver injury in female than in male GSTA3-/- mice, and thus we see little OCs in males after one AFB1 dose. However, we found that repeated exposure, for example, weekly 0.5 mg AFB1/kg for 4 weeks and longer, produces injury in both sexes, with extensive OC proliferation that is indistinguishable between males and females (Figure 8).

Oval cells are identified by staining with A6 and pan-cytokeratin markers. At 15 days after AFB1 (1 mg/kg), numerous (a) A6- and (b) pan-CK-labeled oval cells (arrows) are seen in the livers of GSTA3-/- mice (200×).
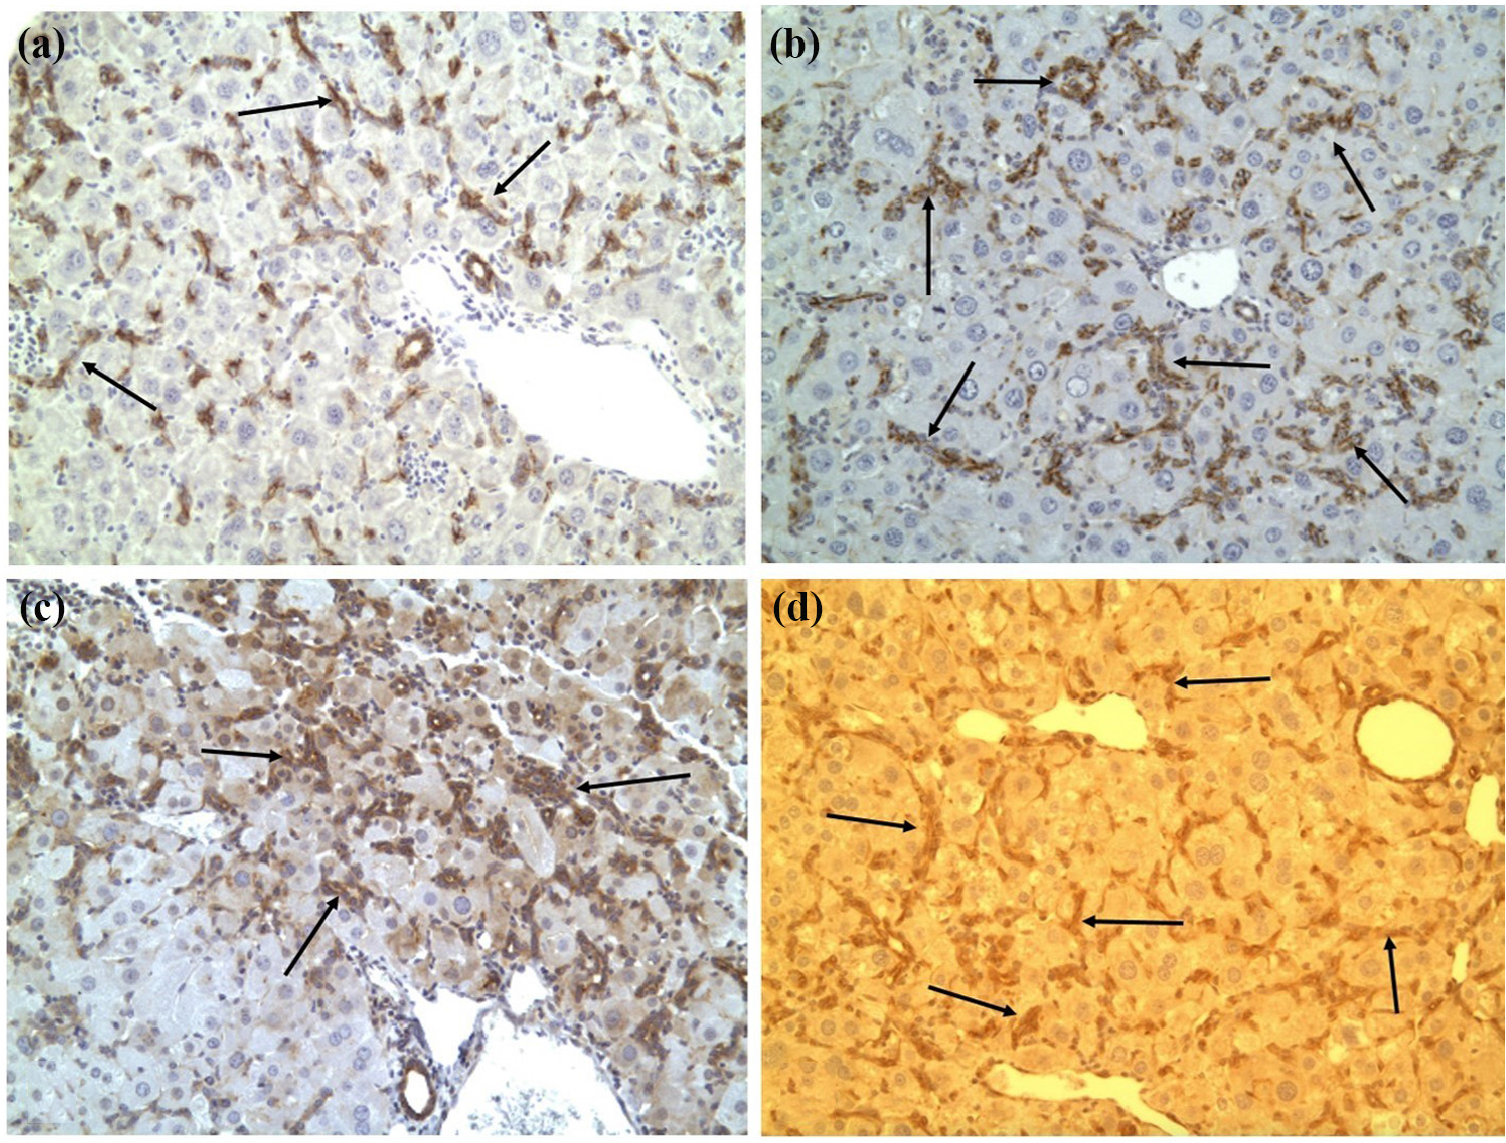
Oval cells labeled with stem cell markers: (a) pan-CK, (b) β-catenin, (c) CD133, and (d) EpCAM, 30 days after a single AFB1 dose in female GSTA3-/- mice (200×).
Oval cells in male GSTA3-/- mice. Numerous hepatic pan-CK+ oval cells in male mice treated with AFB1 for 4 or more weeks: (a) 200× and (b) 400×.
Isolation of OCs
We used antibodies against CD133 and EpCAM, markers associated with the early-appearing liver progenitors45,46,123 to isolate OCs, following the protocol described by Hohne et al., 137 with modifications. Female GSTA3-/- mice were injected i.p. with 1 mg/kg AFB1 and euthanized at day 15, when OCs expand over the entire liver lobule, and the livers were perfused through portal vein with collagenase. 138 After perfusion, the livers were minced in Dulbecco’s modified Eagle’s medium (DMEM) with 0.5% collagenase type IV, 0.01% pronase, and 0.01% DNase. A Percoll gradient was prepared in a 50-mL tube by sequentially layering 10 mL of 70%, 50%, and 30% Percoll. The cell fraction at the interface between 30% and 50% Percoll was collected and then selected for CD133+ and EpCAM+ cells on fluorescence-activated cell sorter (FACS; Figure 9, fraction P7, arrow). Those cells were then placed in the culture containing William’s E Medium supplemented with 10% fetal bovine serum (FBS), 5 mg/mL insulin, and 5 mM hydrocortisone, mHGF, and hEGF. So far, several cell lines, originating from a single cell, have been established; three of those have been selected, passaged, and studied in detail.
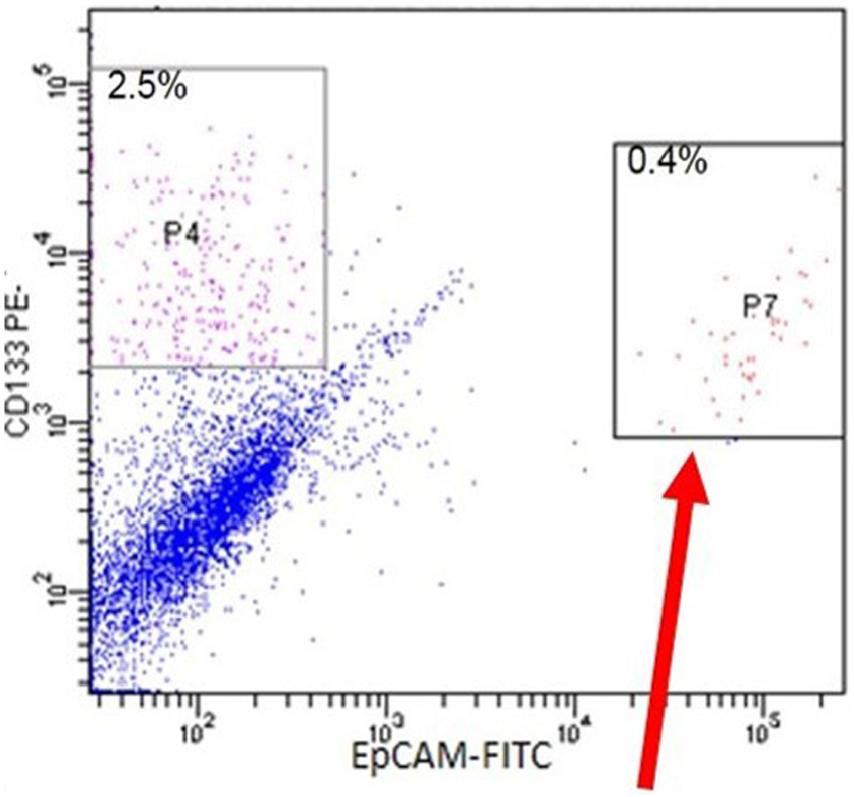
Sorting of CD133+ and EpCAM+ oval cells (P7, arrow) by FACS from AFB1-injured GSTA3-/- mouse liver.
AFP secretion by OCs
A number of primary colonies show increasing secretion of AFP (Figure 10). The AFP secreted by these colonies into the culture medium was measured by sandwich enzyme-linked immunosorbent assay (ELISA) developed in our laboratory. The amount of AFP was calculated from the linear portion of the standard curve. This expression is similar to that seen in cultures of fetal hepatocytes and AFP-secreting hepatomas in rats.

Oval cells secrete α-fetoprotein in culture (measured by ELISA).
Detection of liver stem cell markers by immunofluorescence
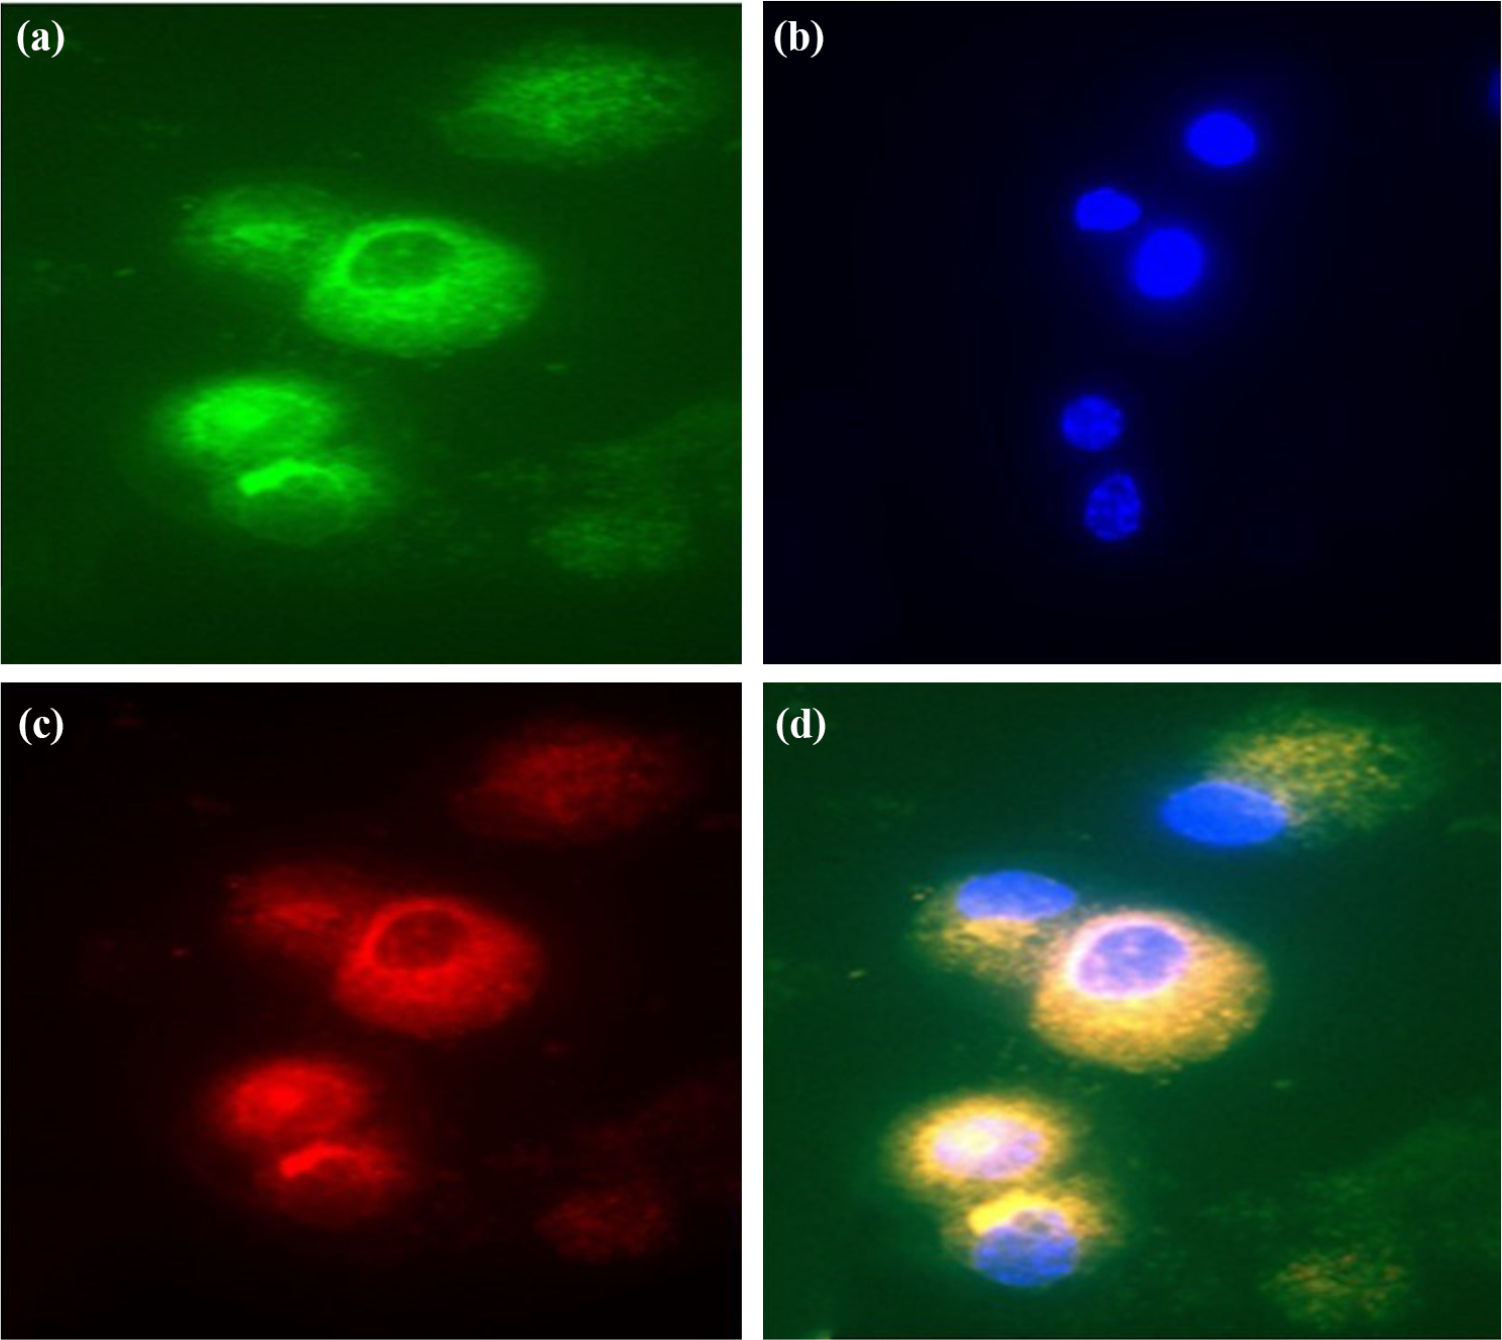
We used fluorescent immunocytochemistry to detect the expression of oval and progenitor cell markers and coexpression of hepatocyte/cholangiocyte markers on the three cell lines. Thus, Figure 11 shows the expression of cholangiocyte/OC-specific markers pan-CK and A6 in cultured cells, whereas Figure 12 shows the expression (and coexpression) of stem cell markers CD133 and EpCAM. Cultured OCs also coexpress albumin (hepatocyte marker) and pan-CK (cholangiocyte/OC marker; Figure 13 (a)–(c)) and AFP (immature hepatocyte/stem cell marker) and pan-CK (cholangiocyte/OC marker; Figure 13 (d)-(f)). Thus, they are bi-potent, a characteristic of progenitor cells.
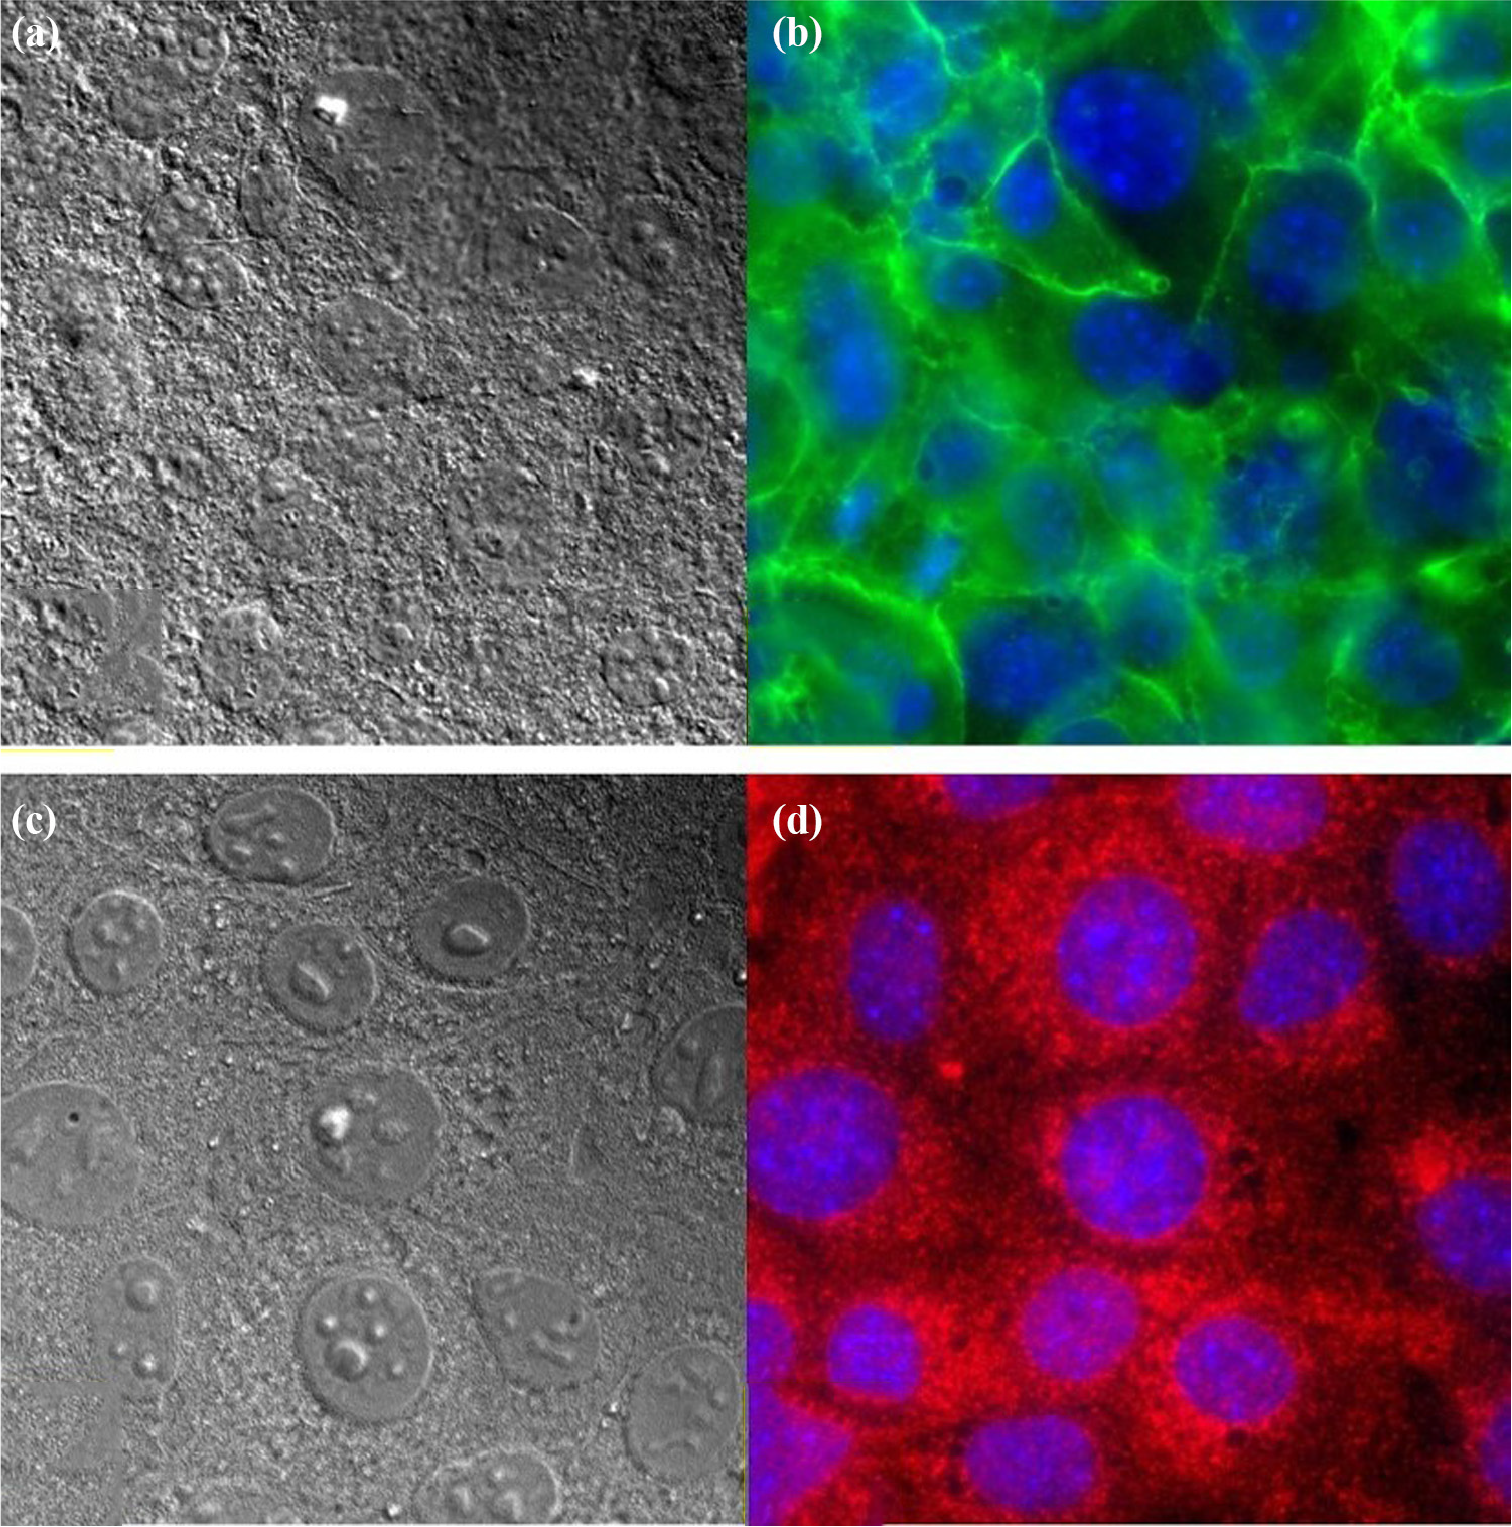
Cultured oval cells labeled with oval cell/cholangiocyte markers: (a) A6 (b, green) and (c) OV-6 (d, red).
Cultured oval cells express progenitor cell markers EpCAM (a, green) and CD133 (c, red) in the same cells (d). (b) DAPI.

Cultured cells are bi-potent. They coexpress albumin (a, green) and pan-CK (b, red) in the same cells (c), and coexpress α-fetoprotein (d, green) and pan-CK (e, red) in the same cells (f).
Detection of liver stem cell markers by western blotting
We performed western blotting to confirm and quantitate the expression of select markers in the cultured OC lines. WT mouse liver, GSTA3-/- mouse liver, and Hepa1-6 cells (mouse hepatoma) were used as controls. As expected, from immunofluorescent data, OCs express markers of mature and immature hepatocytes (albumin and AFP; Figure 14) and progenitor cell markers (CD133 and EpCAM). The expression of albumin was lower than that in WT mouse liver but at similar levels as in mouse hepatoma cell. Cultured cells also express at least one microsomal P450 enzyme (1A2) that is responsible for AFB1 metabolism in the mouse (not shown).

Western blot analysis of albumin and α-fetoprotein (AFP) in cultured oval cells (LSC 1-3) and in mouse hepatoma.
Transplanted OCs give rise to tumors
Cells were implanted subcutaneously (in the leg and neck) into C57Bl/6J (strain of GSTA3-/- mice) and severe combined immunodeficiency (SCID) mice and tumors developed in both (Figure 15(a)). Histologically, tumors display malignant features and a mixture of ductal-like and undifferentiated (Figure 15(b)) and sarcoma-like and undifferentiated (Figure 15(c) and (d)) morphology. Tumor cells are locally invasive, spreading into the underlying muscle (arrows in Figure 15(b) and (d)). Distant metastases (e.g. lung) were not found.

Oval cells give rise to tumors in C57Bl and SCID mice (a). They show a mixture of ductal (b) and sarcoma-like (c, d) histology. Arrows point to invasion into the underlying muscle. (b, c, d)—H&E staining, 100×.
Cell lineages during hepatocarcinogenesis
From the 1950s onward, extensive studies on the development of liver cancer in rats exposed to various hepatocarcinogens demonstrated results that appeared to be conflicting. The prevailing theory was that liver cancer arose from hepatocytes through a series of morphologic intermediates including foci and nodules (see reviews139–142 selected from over 50 on the same subject). With some exceptions,143,144 OCs were considered ductal cells and not part of the carcinogenic process.145,146 However, more extensive studies, using different carcinogenic regimens and AFP and selected monoclonal antibodies as markers for various liver cell populations, a new theory involving liver cell lineage was proposed43,147–149 (Figure 16). Thus, since all the cells in the liver lineage may be induced to proliferation, including the mature liver cells, liver cancers may arise from hepatocytes, ductal cells, or putative liver stem cells (OCs). The above results on the induction of CCAs after extensive OC proliferation in GSTA3-/- mice treated with AFB1 suggest that this induction may be analogous to that of furan in rats, where CCAs are seen. The difference is that furan-induced CCAs are preceded by ductal proliferation, whereas AFB1-induced CCAs are preceded by OC proliferation. Figure 16 includes the possibility of progenitor cells in the ducts or adjacent to the ducts. By the time OC proliferation is readily detectable, it is impossible to tell from whence they came. 150 In the analysis of the proliferating OCs that appear very early after exposure to hepatocarcinogens, the first cells to be labeled with tritiated thymidine (DNA synthesis) are periductular. 151 More recently, evidence that CCAs may arise from hepatocytes was obtained using plasmid transfection of hepatocytes with oncogenes. 152 This is a highly artificial system and may actually be the exception that proves the rule.
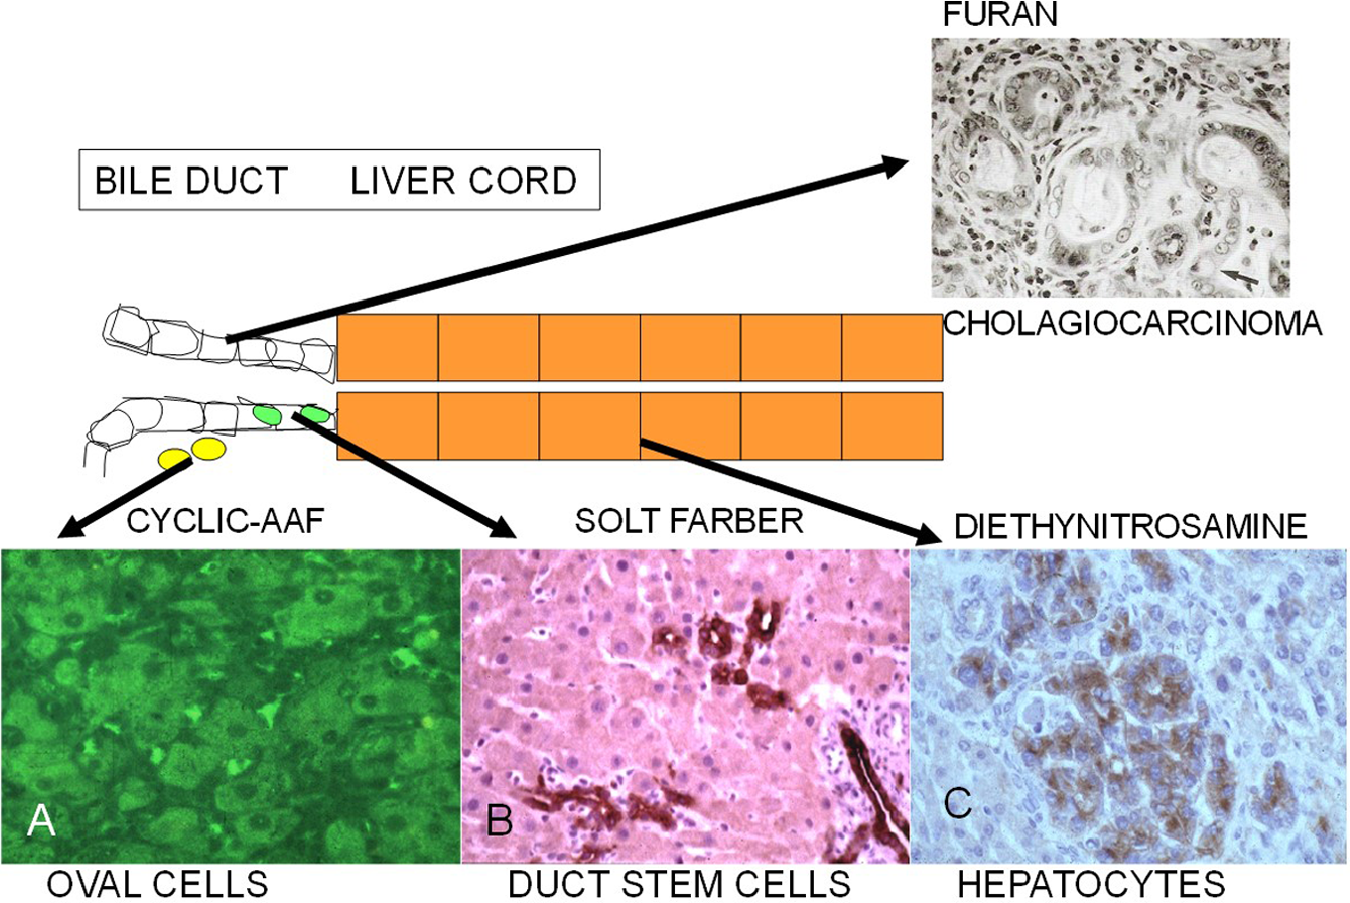
Cellular origin of proliferating cells in the liver lineage during chemical hepatocarcinogenesis in the rat. Diethylnitrosamine (DEN) induces hepatocellular carcinoma (HCC) that arises from small microcarcinomas. The Solt–Farber model induces the proliferation of ductal cells preceding HCC. Cyclic AAF causes diffuse the proliferation of periductal oval cells. Furan induces ductal proliferation and cholangiocarcinomas.
Footnotes
Declaration of conflicting interests
The author(s) declared no potential conflicts of interest with respect to the research, authorship, and/or publication of this article.
Funding
The author(s) disclosed receipt of the following financial support for the research, authorship, and/or publication of this article: The research was supported by the NIH grant R01CA161694.