
Abstract
Prostate cancer is the most common cancer among men in the western world. Clinical practice is continuously challenged by the pitfalls of the available diagnostic tools. microRNAs may represent promising biomarkers in many types of human cancers, including prostate cancer. The aim of this study was to investigate microRNA expression in tumour tissue and matched plasma in a cohort of patients with primary metastatic prostate cancer. The relative expression of 12 microRNAs was assessed in diagnostic needle biopsies from the prostate and matched plasma samples in two prospective cohorts (screening cohorts) comprising 21 patients with metastatic prostate cancer and 25 control patients. An independent validation cohort of plasma samples was collected prospectively from 149 newly diagnosed patients with local/locally advanced prostate cancer. Analyses were performed using real-time polymerase chain reaction. miRNA-93 showed a significant negative correlation between expression in tumour tissue and plasma in patients with metastatic prostate cancer. Furthermore, the plasma level of miRNA-93 significantly decreased after treatment in patients with local/locally advanced prostate cancer compared to baseline plasma level. The expression of six microRNAs (let-7b, miRNA-34a, -125b, -143, -145 and -221) was downregulated, and three microRNAs (miRNA-21, -25 and miRNA-93) were upregulated in tumour tissue compared to benign prostate tissue. In plasma, six microRNAs were upregulated (miRNA-21, -125b, -126, -141, -143 and -375), while let-7b was downregulated in patients with metastatic prostate cancer compared to the control cohort. In the metastatic prostate cancer cohort, the expression of four microRNAs (miRNA-125b, -126, -143 and -221), and miRNA-141 in tissue was associated with Gleason score and prostate-specific antigen, respectively. The expression of miRNA-93 in tumour tissue was correlated with matched plasma levels and showed a significant decrease in plasma level after intervention in local prostate cancer. Differential expression between tumour and benign prostate was detected for several microRNAs in both tissue and plasma.
Introduction
Prostate cancer (PCa) is the most common cancer among men in the Western world with a high mortality rate.1–3 Nevertheless, screening for PCa has always been questionable, balancing between potential harms and benefits. 4 It is recommended neither in the United States nor in the vast majority of European countries.5,6
PCa management in the last three decades has been dependent on the holy trinity of prostate-specific antigen (PSA), histological Gleason score (GS) and clinical stage. However, this triad is challenging in daily practice regarding sensitivity and specificity7–9 leading to overdiagnosis and overtreatment.
Therefore, the need for more specific and sensitive biomarkers in PCa management is still inevitable.
Since its discovery three decades ago, microRNA (miRNA) has shown quite promising results as a biomarker in biology in general, and particularly in cancer diseases. 10 miRNAs are non-coding, single-stranded RNA molecules comprising about 19–24 nucleotides in length that regulate gene expression, not only posttranscriptionally but also at the transcriptional level.11,12 They are involved in different cellular processes such as differentiation, 13 apoptosis 14 and cell cycle regulation. 15 miRNAs also play a crucial role in the expression of up to 60% of the human genes, 16 and up to 50% of the miRNA genes are located in cancer-related genomic regions. 17
There is growing evidence of miRNAs as potential alternative biomarkers in many types of cancer, including PCa. First, miRNAs are quite stable in a diverse range of clinical samples, for example, formalin-fixed paraffin-embedded (FFPE), frozen tissue,18,19 and biofluids such as serum, plasma 20 and urine 21 . Second, its expression is obviously dysregulated in cancer, including PCa.22,23 Third, miRNA expression seems to be tissue specific and thus may be able to classify human cancer origin.24,25 Furthermore, miRNAs are highly conserved between species 26 and released into the circulation by tumour cells allowing for detection in blood samples. 27
In the precision medicine era, tissue biopsy is still the standard diagnostic tool in cancer, but its inability to reliably reflect the whole genomic profile of the tumour, both temporally and spatially, is one of its well-known challenges. 28 Also, heterogeneity of the tumour tissue has a considerable impact on the clinical application of any biomarker, including miRNAs. 29 On the other hand, liquid biopsy has attracted considerable attention in the last few years as a less invasive and more longitudinal approach to acquiring a molecular landscape of different cancers. 30 The analysis of miRNAs in blood samples poses several challenges, 31 but compared to tumour tissue this strategy has an obvious advantage in avoiding tumour heterogeneity and invasive sampling procedures. 32 Consequently, analysis of miRNA expression in paired tissue and blood samples may answer some questions about the validity and potential of miRNAs as biomarkers in cancer. A few studies have addressed this issue in other cancers,33,34 while it is still largely unaddressed in PCa.
The aim of this study was to investigate miRNA expression in tumour tissue and plasma and their intercorrelation in patients with primary metastatic prostate cancer (mPCa) and compare the result to that of a control cohort of patients, in which PCa could not be confirmed.
Material and methods
Patients
All patients were referred to the Department of Urology either at Vejle Hospital or at Esbjerg Hospital, Denmark, during the period between September 2015 and May 2017. All participants provided informed written consent.
Screening cohort
Based on high PSA levels with or without lower urinary tract symptoms, patients were referred to undergo further diagnostic evaluation. This study consists of two cohorts recruited from a PCa biobank (PerPros), that is, 21 patients newly diagnosed with primary mPCa and a control cohort of 25 patients with suspected PCa but no evidence of the disease in the biopsy. The patients with mPCa were treated according to the extent of their metastases (bone, lymph node or organ metastases) and the histological pattern of the biopsy (adenocarcinoma versus neuroendocrine PCa). All patients in the control cohort were followed with PSA tests every 3–6 months either at the Department of Urology or with the general practitioner. Moreover, five patients had a rebiopsy of the prostate (within 6–18 months), still without evidence of cancer.
Validation cohort
Plasma samples from another independent cohort of 149 newly diagnosed patients with local/locally advanced PCa were prospectively collected at the time of diagnosis (before transrectal ultrasound biopsy (TRUS)) and again 5 months later.
Tissue
All FFPE tissue samples from needle biopsies had been routinely processed for pathoanatomic diagnosis and were retrieved from the archives of the Departments of Clinical Pathology at Vejle and Esbjerg Hospitals. In most cases, 12 needle biopsies were available from each patient. A 4-µm-thick, haematoxylin–eosin (H&E)-stained routine section from all tissue blocks was reviewed by two experienced uropathologists. The needle biopsy showing the highest GS according to the updated guideline 35 was selected for further analysis.
For every patient in the mPCa cohort, the cancerous area of the biopsy was identified, marked microscopically and manually selected out of the block. The resected part was heated at 60°C. The tissue was placed in the centre of a new paraffin block and then frozen to −4°C. Afterwards, 10–15 slices of 10-µm-thick sections were cut from the selected cancerous area and placed in a 1.5-mL standard tube.
Blood collection and storage
Plasma samples were prospectively obtained from all patients prior to TRUS and collected in 9-mL ethylenediaminetetraacetic acid (EDTA) tubes. Platelet-poor plasma (PPP) was prepared by dual centrifugation within 2 h from blood sampling. The samples were centrifuged at 3000 g for 15 min and carefully transferred to another tube, leaving approximately 1 mL of plasma on top of the buffy coat. The centrifugation step was repeated and again approximately 1 mL was left at the bottom of the tube when the PPP was transferred into cryo-tubes and stored at −80°C. To reduce the risk of haemolysis and diminish the risk of release of miRNAs from other intravascular cell compartments, all blood samples were handled within the first 2 h after sample collection. Furthermore, all samples have been evaluated for haemolysis by measuring absorbance at 414 nm. All values are below log(abs) = 0, which correspond to less than 1% haemolysis when comparing to recommendations. 36
Selected miRNA targets
In this study, a panel of 12 miRNAs was selected to investigate the expression in tumour tissue compared to plasma levels in two cohorts (screening cohorts): primary metastatic PCa and control individuals. This choice was based on results from our previous work, 29 and on a comprehensive review of the literature. In our previous study, the expression of four miRNAs (miRNA-34a, -126, -143 and -145) demonstrated a relatively high interclass correlation in PCa tissue cores from prostatectomy specimens in 49 local/locally advanced PCa patients. Furthermore, the tissue expression of two miRNAs (miRNA-21 and -125b) was significantly upregulated in PCa tissue cores compared with adjacent benign cores from the same cohort. The remaining six miRNAs (miRNA-25, -93, -141, -221, -375 and let-7b) were the most promising in PCa based on the literature.37–39 Summary of these results is presented in Table S1.
RNA extraction
Tissue samples
Paraffin was removed from the FFPE tissue samples by the addition of 180 µL incubation buffer (Promega, AS1135) and 20 µL Proteinase K (Promega, AS1460) and incubated for 1 h at 70°C. And 400 µL lysis buffer (Promega, AS1460) was added and the reaction was cooled. About 500–750 µL just below the fat layer was transferred directly to Well #1 for purification of miRNA using the Maxwell RSC miRNA Tissue Kit (AS1460) by the Maxwell RSC instrument. In brief, the tissue was suspended in 1-thiolglycerol solution and homogenized by the addition of lysis buffer and Proteinase K and then vortexed. DNA was removed by adding DNase I. Elution was done in 60 µL. For spike-in control 4.7 pM Cel-miRNA-39 was used.
Plasma samples
miRNA purification from PPP was done using the Maxwell RSC miRNA Tissue Kit (AS1460). 200 µL plasma was mixed with 200 µL chilled 1-thioglycerol/homogenization solution and 200 µL lysis solution. After incubation for 10 min, spike-in Cel-miRNA-39 was added (final concentration 4.7 pM) and then loaded into the Maxwell RSC Instrument.
Reverse transcription, pre-amplification and quantitative polymerase chain reaction
All preparations and quantitative polymerase chain reaction (qPCR) were done using the standard protocol from Life Technologies, Custom TaqMan® Array MicroRNA Cards and an ABI 7900 HT Fast Real-Time PCR system. In brief, reverse transcription was performed using a custom primer pool and a TaqMan MicroRNA Reverse Transcription Kit (4366596). After reverse transcription, targeted pre-amplification was performed and the final product was diluted eight times. The Custom TaqMan Array MicroRNA Cards were prepared, loaded and run as recommended (PPN 4478705). Results were analysed using ExpressionSuite Software® 1.1 from Thermo Fisher Scientific.
U6 and other standard use housekeeping genes have repeatedly proved to be unqualified as internal control in miRNA studies in body fluids.40,41 Therefore, in this study we used endogenous controls within the same RNA class as recommended. 42 In the screening cohort, both miRNA-17 and miRNA-191 were chosen as internal controls, as they displayed a stable expression level in all samples and had previously proven suitable as controls. 43 In addition, using the algorithm NormFinder identifies these miRNAs as the most suitable controls in this dataset. 44 In the validation cohort, only miRNA-17 was chosen as the internal control.
The miRNA-34a assay in plasma in both cohorts did not show exponential amplification during qPCR and was hence excluded from the experiment.
Statistical analysis
Data are presented as means of three technical replicates, for both plasma and tissue samples.
The fold changes of miRNA expression in each sample, tissue and plasma, relative to the average expression in the control cohort, were calculated based on the threshold cycle (Ct) value using the following formula: ΔCt = mean Ct – mean value of (mean Ct of miRNA-17 + mean Ct of miRNA-191).
Fold change is calculated as follows: ΔΔCt for every patient = ΔCt for every patient in cancer cohort – mean of all ΔCt for control cohort. Results were linearized using 2−(ΔCT) or 2−(ΔΔCT) and then tested statistically.
Values of linearized ΔCt were used to test the correlation between miRNA expression in tissue and plasma in both cohorts, and also its correlation between PSA and GS, whereas the values of linearized ΔΔCt (RQ) were used to compare the cancer and control cohorts to dysregulation pattern in plasma and tissue (up/downregulation).
All Ct measurements above 35 were dismissed. Ct measurements were also dismissed, if the mean Ct differed with >1 from any of the three replicates. Ct values for miRNA-141 were dismissed in 19 plasma samples on this account (7 in the mPCa cohort and 12 from the control cohort).
Spearman’s rank-order correlation coefficient was used to investigate the correlation between plasma and tissue samples. Wilcoxon rank-sum test was used to look at up/downregulation of miRNA expression across different groups (e.g. plasma in cancer cohort versus plasma in control cohort) and univariate analysis was applied for the correlation between PSA and GS in the mPCa cohort. Box plots were used to illustrate up/downregulation of miRNA expression in both tissue and plasma.
Wilcoxon signed rank test was used to analyse the difference in miRNA-93 levels in plasma (linearized ΔCt) after intervention compared to baseline.
All analyses were performed in STATA version 15 (StataCorp, TX, USA), and correlations/differences were considered statistically significant when the P value was less than 0.05.
Results
Patient characteristics
Screening cohort
The mean age in the control cohort was significantly lower than that in the mPCa cohort (61.9 versus 71.2 years; p < 0.01). Most of the mPCa patients were diagnosed with adenocarcinoma of the prostate, and an atypical PCa component along with the adenocarcinoma was found in three patients. One patient in each cohort also had another cancer (both patients had been treated surgically by radical removal of this cancer).
Validation cohort
Both main PSA level and mean prostate volume in the observational cohort were significantly lower than those in the interventional cohort. Three different treatment strategies were applied in the interventional cohort (curative intended treatment, radical prostatectomy (RP) or radiotherapy (RT), or palliative treatment with androgen deprivation therapy (ADT)). In the observational cohort, either an active surveillance (AS) or a watchful waiting (WW) strategy was applied.
The clinicopathological characteristics of the two cohorts are presented in Table 1.
Clinicopathological characteristics of both the screening and validation cohorts.

ADT: androgen deprivation therapy; cTcNcM: clinical stage; DC: ductal carcinoma of prostate; GS: Gleason score; LUTS: lower urinary tract symptoms; mPCa: metastatic PCa; PSA: pprostate specific antigen; RARP: robot-assisted radical prostatectomy; RT: radiotherapy; SCNEC: small cell neuroendocrine carcinoma of the prostate; N/A: not applicable; AS: active surveillance; WW: watchful waiting.
The highest GS.
Correlation between miRNA expression in tumour tissue and matched plasma
In the mPCa cohort, miRNA-93 demonstrated a significant negative correlation between tumour tissue expression and plasma levels (r =−0.44, p ≤ 0.05). In the control cohort, four miRNAs (miRNA-21, -25, -93 and -143) showed significant positive correlations between tissue expression and plasma levels (r = 0.58, p < 0.01; r = 0.49, p = 0.01; r = 0.41, p = 0.04; and r = 0.43, p = 0.03, respectively; Table 2).
Correlation between miRNA expression in tissue and plasma levels in the two cohorts.

mPCa: metastatic prostate cancer; miRNA: microRNA; rho: Spearman’s rank correlation coefficient.
Bold values are statistically significant values.
miRNA expression in the mPCa cohort versus the control cohort
The expression of six miRNAs (let-7b, miRNA-34a, -125b, -143, -145 and -221) was significantly downregulated, whereas three miRNAs (miRNA-21, -25 and -93) were upregulated in cancer tissue compared to the control tissue (Table 3).
Up/downregulation of miRNA expression in the mPCa cancer cohort compared to the control cohort in both tissue and plasma samples.
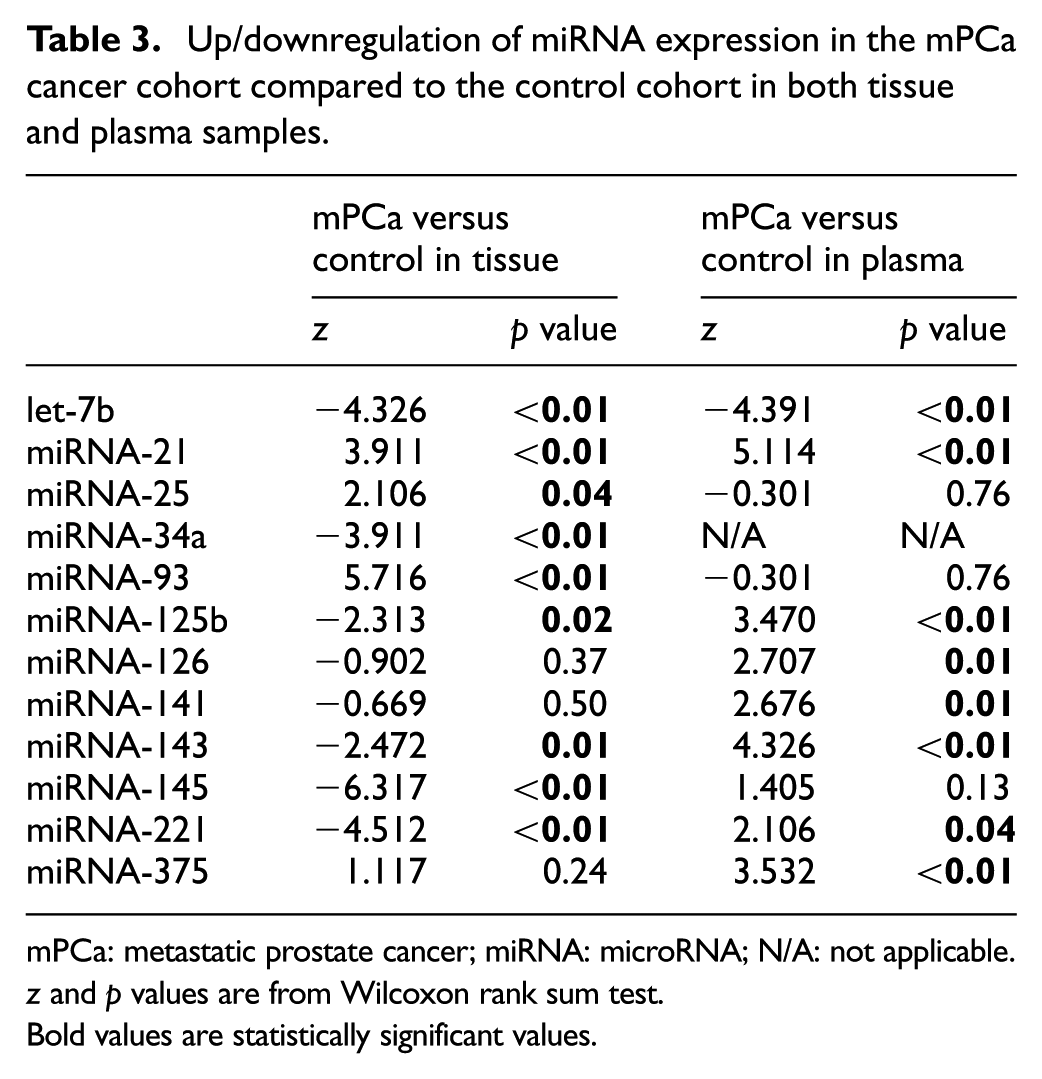
mPCa: metastatic prostate cancer; miRNA: microRNA; N/A: not applicable.
z and p values are from Wilcoxon rank sum test.
Bold values are statistically significant values.
When comparing plasma miRNA levels in the mPCa patients with the control cohort, only let-7b was significantly downregulated, while seven miRNAs (miRNA-21, -125b, -126, -141, -143, -221 and -375) were significantly upregulated (Table 3). The fold change between the individual miRNAs in the mPCa cohort and the control cohort in both tissue and plasma is further illustrated by box plots in Figure 1.
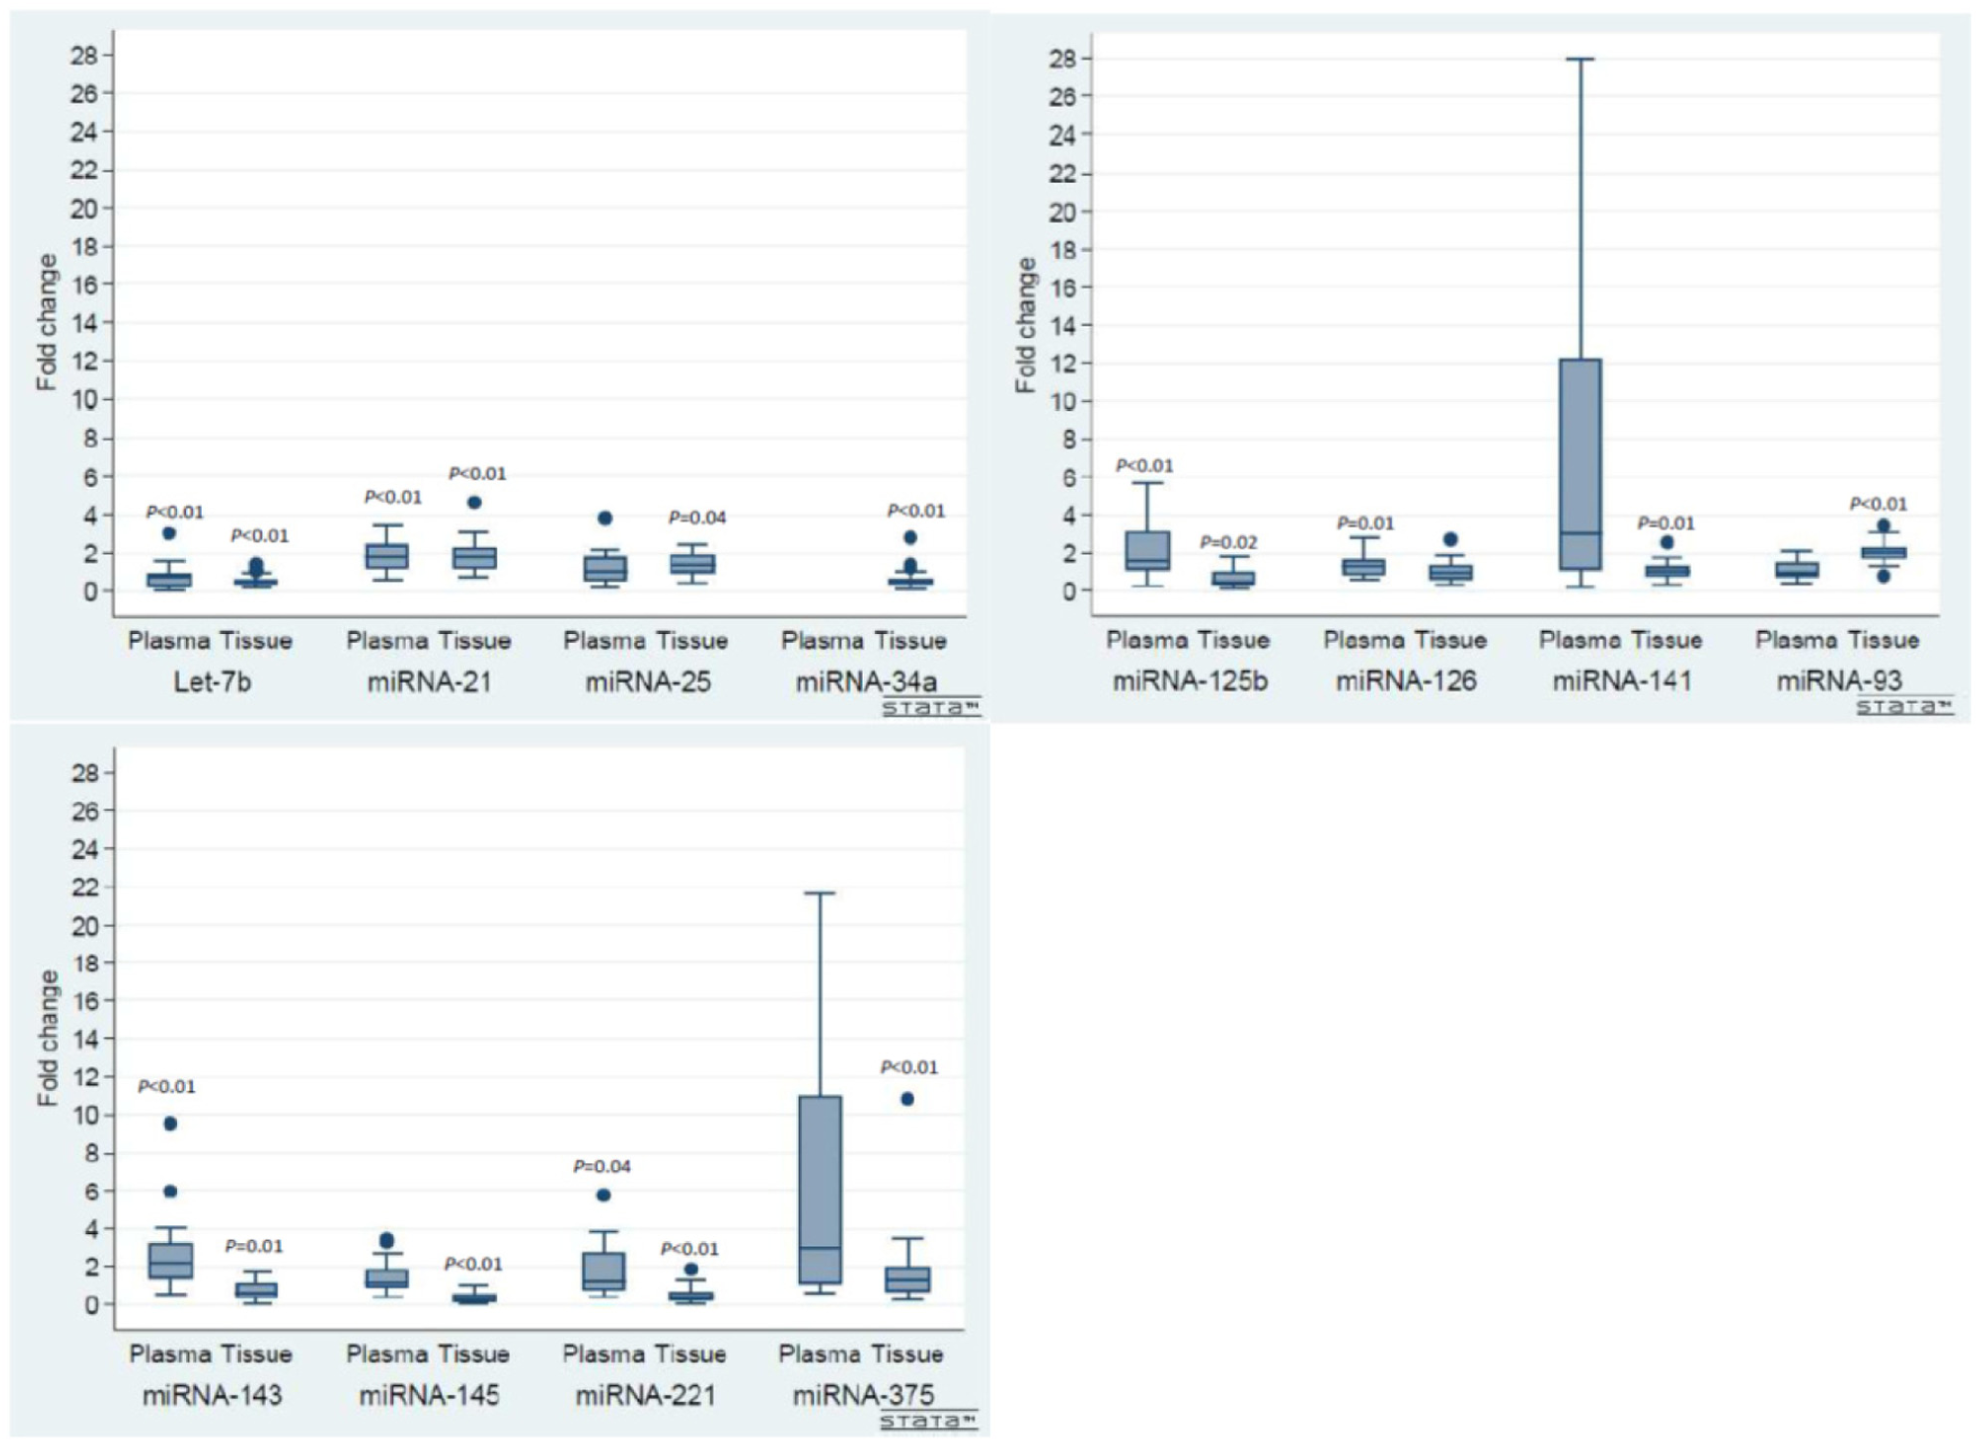
Up- and down regulation of miRNA expression in mPCa cohort compared with the control cohort.
Compared to the entire miRNA panel, both miRNA-141 and -375 had relatively high fold change values in plasma. Furthermore, one patient in the mPCa cohort had extreme fold change values for both miRNA-141 and -375 (39- and 74-fold, respectively). There were no special clinicopathological characteristics observed in this patient. These two values were removed in the box plots for graphical reasons.
Relationship between clinical characteristics and miRNAs in the mPCa cohort
Table 4 demonstrates the individual miRNA differences according to prebiopsy PSA and GS in the mPCa cohort. miRNA-141 was significantly lower in tissue samples of patients with a prebiopsy PSA < 53 ng/mL compared to those with a PSA ≥ 53 ng/mL (PSA 53 ng/mL was the median PSA value in the mPCa cohort). In addition, the tumour expression of five miRNAs (miRNA-125b, -126, -143, -145 and -221) was significantly higher in patients with GS < 9 compared to those with GS ≥ 9. No differences were detected either for PSA or for GS in regard to miRNA levels in plasma.
Relationship between miRNAs, PSA and GS in the mPCa cohort.

GS: Gleason score; mPCa: metastatic prostate cancer; PSA: prostate specific antigen.
Median PSA value (ng/mL) in the mPCa cohort.
z and p values are from Wilcoxon rank sum test.
Bold values are statistically significant values.
Change of miRNA-93 plasma levels in the validation cohort
In the interventional cohort, the plasma level of miRNA-93 decreased significantly after intervention compared to the baseline level at the time of diagnosis (z = –2.654; p = 0.008). The difference between miRNA-93 levels in the observational cohort at baseline and those at 5 months was non-significant (z = –1.586; p = 0.112; Figure 2).

Change in miRNA-93 plasma levels in both the interventional and observational cohorts for local/locally advanced PCa patients.
Discussion
The aim of this study was to investigate the expression pattern and correlation of 12 miRNAs between tissue and plasma in mPCa patients and a control cohort. For miRNA-93, significant correlations between tissue expression and plasma levels were observed in both cohorts. Several miRNAs were expressed differently in malignant and benign prostatic disease in tissue as well as plasma. In addition, an independent validation cohort demonstrated that the plasma levels of miRNA-93 decreased significantly after intervention, whereas in AS/WW patients no difference between baseline and control at 5 months could be detected.
Singh et al. 45 documented correlations in the expression of several miRNAs (among these miRNA-125b) between tumour tissue and serum of 10 radically treated local PCa patients.
In localized breast cancer, Wang et al. 33 found a strong correlation between the expression of a panel of seven miRNAs (including miRNA-21 and -126) in tumour tissue and serum of 58 patients. Similarly, Armstrong et al. 34 demonstrated a correlation between the expression of 25 miRNAs (many of which were identical to those investigated in this study) in cancerous tissue and urine exomes and buffy coat, but not with plasma exomes from 16 localized bladder cancer patients. In the control cohort in our study, the expression of miRNA-21, -25, -93 and -143 in tissue was correlated to those expression in plasma. Patient population (mPCa versus local PCa) and type of cancer (breast cancer, bladder cancer or PCa) could explain the differences in correlation pattern in our work compared to previous studies.
Change in circulating miRNA levels after management has been previously reported in cancer diseases46,47 including PCa.48,49 Mahn et al. 48 have observed a significant reduction of serum miRNA-16, 26a and -195 already a week after RP in local PCa patients. Moreover, Lehmusvaara et al. 49 have detected both upregulation and downregulation in a panel of 52 miRNAs after ADT treatment for local PCa.
Both the correlation of miRNA-93 expression in cancerous tissue with plasma from PCa patients and the significant change of its plasma expression after management support the hypothesis of a tumour-associated miRNA.
Furthermore, we observed the upregulation of miRNA-93 in tissue samples from mPCa patients compared to the control cohort suggesting an oncogenic potential in PCa. In 2011, Moltzahn et al. 50 found miRNA-93 to have a diagnostic potential with significant upregulation in PCa tissue, which was in line with some studies.51–53 However, the pattern was quite different in another set of studies. Mihelich et al. 54 reported the downregulation of miRNA-93 in serum from localized PCa patients with high GS. This correlated apparently with the aggressiveness of PCa; since the expression of miRNA-93 was lower, the GS was higher. Interestingly, when the expression of miRNA-93 was compared with that of healthy men, the upregulation seen in N0 PCa changed to a pattern of downregulation in N + PCa. 55 As a part of the miRNA-17 family, which is located on chromosome 7, 56 miRNA-93 promotes tumourigenesis mainly by fine-tuning a potent tumour suppressor phosphatase and tensin (PTEN) homolog expression. 57
The expression pattern of the miRNAs investigated in our study was in agreement with the results from the vast majority of previous studies.23,58 Both in tissue and plasma samples, the expression of let-7b was downregulated, while that of miRNA-21 was upregulated in mPCa patients compared with the patients in the control cohort.
However, our results contradict some of the previously reported observations, in particular the results on miRNA-34a, -125b and -221, the expression of which was downregulated in the tumour tissue compared to the tissue expression in the control cohort of our study. These observations deviate from other studies with the upregulation of miRNA-34a expression in PCa.29,59,60 Studies of Zedan et al. 29 and Shi et al. 61 demonstrated increased expression of miRNA-125b in cancerous tissue from localized PCa patients compared with matched benign prostate tissue. Chen et al. 62 also showed the upregulation of miRNA-221 in PC-3 (PCa-derived cell line) compared with RWPE-1 (normal human prostate epithelial cells). Differences in materials (cell lines versus clinical tissue and localized PCa versus mPCa) and methods applied (in situ hybridization (ISH), microarray or PCR) may in part explain this inconsistency.
It is worth noticing the paradoxical expression pattern of miRNA-125b, -143 and -221 between tissue and plasma; while being downregulated in tissue they were upregulated in plasma from mPCa patients compared to the control cohort. Mitchell et al. 20 also demonstrated the upregulation of both miRNA-125b and -143 in the serum of mPCa patients compared to healthy controls. Compatible with these results, Singh et al. 45 showed the upregulation of miRNA-125b in PCa patients who experienced biochemical relapse, compared with relapse-free PCa patients. The upregulation pattern of miRNA-221 in blood from patients with PCa has also been documented in other studies.63–65
Neither the source nor the mechanism of miRNAs released into the extracellular environment is completely understood. There are several hypotheses to explain the source of circulating miRNAs.66,67 Passive release of miRNAs from broken cells,68,69 released either via microvesicles70,71 or directly through different types of proteins,72,73 has been proposed. A third assumption is that extracellular miRNAs originate from immunocytes in the tumour microenvironment.74,75
The exact role of miRNA-125 and -143 in cancer and specifically in PCa has recently been an issue of consideration. While both miRNAs were thought to be tumour suppressors in many types of cancer, recent studies argue for a potential role as oncogenic miRNAs in other cancers, including PCa.76,77
The high fold change of both miRNA-141 and -375 in one mPCa patient could indicate a poor prognosis as reported previously,78,79 but the issue is beyond the scope of this study and was therefore not investigated.
Although not being the main objective of this study, the correlation of miRNA expression with clinicopathological characteristics (PSA and GS) was also explored.
Five miRNAs (miRNA-125b, -126, -143, -145 and -221) were upregulated in tumour tissue with increasing GS. Similar observations have been documented in previous studies.53,60,80 Brase et al. 78 demonstrated a significant correlation between miRNA-141 expression in serum and GS. In our study, miRNA-141 expression in tumour tissue was significantly lower in patients with PSA > 53 ng/mL versus those with PSA < 53 ng/mL. Gonzales et al. 81 documented the same pattern for miRNA-141 in the plasma of mPCa patients.
There is still uncertainty about the future implication of miRNAs in clinical practice due to diverging study results. One of the main reasons for the inconsistent conclusions may be the pre-analytical preparation of blood and tissue samples.82,83 This includes the methodology of extraction and quantification of miRNAs, normalization, amplification, contamination and data analysis. The use of plasma versus serum and the type of anticoagulant applied (EDTA and citrate versus heparin) have a great impact on the quantification of miRNAs. Moreover, there is a lack of standardization of the time lapse between blood collection and processing. The choice of internal controls for biological variability is still controversial. Pre-amplification reagents are not always the same in miRNA studies, leading to another challenge regarding standardization. Finally, quantification of valid miRNAs in the serum can be grossly altered by contamination by miRNAs leaking from cellular blood components, either through haemolysis during sampling or through processing or by carryover of whole cells in the serum or plasma.84,85 Recently, it was also documented that some miRNAs (e.g. miRNA-375) exhibit a rhythmic behaviour and thus diurnal variation may contribute to a significant difference in miRNA expression. 86 Hence, unless these causes of imprecision are considered and mitigated, only miRNAs that are extremely up- or downregulated will be suitable as clinical biomarkers.
There are still many challenges in relation to the clinical implementation of miRNAs, but evidence pointing towards their potential as alternative biomarkers in PCa is increasing.
The diversity of clinicopathological characteristics of mPCa patients in our study regarding tumour stage, pathological subtype of PCa and location of metastases reflects a large spectrum of mPCa patients in the daily practice. Moreover, the prospective pattern of material sampling (both tissue and plasma) and the pre-analytical considerations increase the credibility of the data. Also, the matched control cohort is considered a strength of this study. However, the sample size and uncertainty of the amount of macrodissected tumour tissue in the mPCa cohort may represent some limitations. Nevertheless, considering that overall the study is methodological and hypotheses generated, the sample size may be a minor issue.
Conclusion
In this study, miRNA-93 demonstrated a significant correlation between tumour tissue and plasma samples in a cohort of patients with mPCa, and its plasma level decreased significantly after treatment in local/locally advanced PCa patients, supporting its potential as a PCa biomarker. Furthermore, the potential tumour-suppressive role of let-7b and the oncogenic role of miRNA-21 were supported by the present results in tumour tissue as well as plasma.
Supplemental Material
Table_S1 – Supplemental material for microRNA expression in tumour tissue and plasma in patients with newly diagnosed metastatic prostate cancer
Supplemental material, Table_S1 for microRNA expression in tumour tissue and plasma in patients with newly diagnosed metastatic prostate cancer by Ahmed Hussein Zedan, Torben Frøstrup Hansen, Jannie Assenholt, Mindaugas Pleckaitis, Jonna Skov Madsen and Palle Jörn Sloth Osther in Tumor Biology
Footnotes
Acknowledgements
Many thanks to Lone Frischknecht, Marianne Mose Hansen and Christina Braad Petersen for excellent technical assistance. Special thanks to Karin Larsen, secretary in clinical research unit, Department of Oncology, Vejle Hospital, Vejle, Denmark, for her free linguistic editing of the manuscript. Both urologist Søren Sørensen Madsen and pathologist Niels Korsgaard from Esbjerg Hospital have contributed to this study by recruiting their patients and preparing their samples, respectively.
Declaration of conflicting interests
The author(s) declared no potential conflicts of interest with respect to the research, authorship, and/or publication of this article.
Ethical approval
This study was approved by The Regional Committees on Health Research Ethics for Southern Denmark (S-20170006) according to Danish law. The Danish Data Agency approved the study and the Danish Registry of Tissue Utilization was screened prior to study initiation.
Funding
The author(s) disclosed receipt of the following financial support for the research, authorship, and/or publication of this article: This study was funded by the Research Council of Lillebaelt Hospital (AHZ) and the Japanese–Swedish Research Foundation.
References
Supplementary Material
Please find the following supplemental material available below.
For Open Access articles published under a Creative Commons License, all supplemental material carries the same license as the article it is associated with.
For non-Open Access articles published, all supplemental material carries a non-exclusive license, and permission requests for re-use of supplemental material or any part of supplemental material shall be sent directly to the copyright owner as specified in the copyright notice associated with the article.